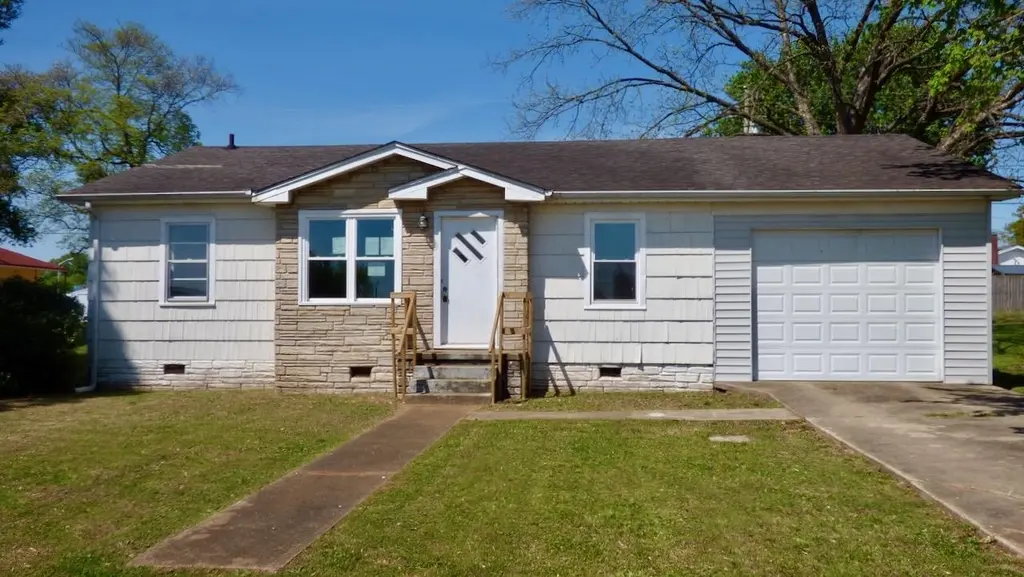
609 Hill Ave · Muscle Shoals, AL
Flood risk 1/10 · Minimal
- FEMA flood zone
- X (unshaded)
- Chance of flooding over 30 yrs
- 0.0%
- Est. flood insurance / yr
- $507 – $1,088
Fire risk 1/10 · Minimal
- Est. fire insurance / yr
- $916 – $1,700
Heat risk 6/10 · Moderate
- Hot days now (above 107°F)
- 7 days/yr
- Hot days in 30 yrs
- 20 days/yr
Wind risk 5/10 · Moderate
- Chance of severe wind over 30 yrs
- 23.0%
Air-quality risk 1/10 · Minimal
- Unhealthy air days now
- 0 days/yr
- Unhealthy air days in 30 yrs
- 0 days/yr
Risk factors via First Street. Map © Google.
Why this score? — see what drove the B- grade
The composite is a weighted blend of 9 inputs, each scored 0–100. Each bar is that input's sub-score; the figure is the points it added to the 100-point composite (weight × sub-score).
- Cash flow +28.7/30.0
- DSCR +10.0/10.0
- ARV discount +7.5/15.0
- 1% rule +7.0/10.0
- Schools +4.4/10.0
- Livability +3.4/5.0
- Rent growth +2.5/5.0
- Condition / age +2.5/5.0
- Appreciation +0.0/10.0
$97,000
🖨 Deal sheet 📄 Offer letter ✓ Due diligence
Listing remarks
Nice 3-bedroom home with 1 bathroom, hardwood floors, Some updates include a newer HVAC. Enjoy the convenience of a detached workshop on the property. Located in Muscle Shoals convenient to shopping, schools, and the hwy. Right of redemption may apply. Case 013-030780. Property is Owned by the US Dept. of HUD. Insurability is "IE", Subject to Appraisal. The seller makes no representations or warranties as to the property condition. HUD Homes are sold “As-Is”. Equal Housing Opportunity. The seller may contribute up to 3% for buyer’s closing costs, upon buyer request. Lead-based paint notices to be included in the contract. Contact your agent today to schedule a sh
Key facts
- Detached workshop
- Hardwood floors
- 0.29 acre lot
Tags
Property features AI
Finance
- Financial info: Tax annual amount listed as $532.10
Exterior
- Utilities: Sewer: Unknown
- Home design: Single-family residential property
- Exterior features: Lot dimensions approximately 100 x 125; Lot size about 0.29 acres; Located in the Highland Park #12 subdivision
Interior
- Bedrooms: Three main-level bedrooms
- Bathrooms: One full bathroom
- Interior features: Six total rooms
Neighborhood map
What this means for you Summary
Snapshot
- This is a 3-bed/1.0-bath single-family listed at $97k.
Deal economics
- At list price, monthly cash flow is $324 ($4k/yr) — positive.
- The deal already cash-flows at list — no discount required.
- Meets the 1% rule at list price ($1k rent vs $97k).
- Recommended offer: $94k (3.0% below list) — sets the bar for market timing.
- Cap rate 10.3% vs local median 2.8% in Muscle Shoals — top-decile yield for the area; either an underpriced asset or a hidden risk that comps aren't pricing in. Stress-test before assuming the spread holds.
Location & tenants
- Location reads 68/100 on livability (#68 in AL) — a middle-class / working-renter tenant base. Strengths: cost of living A+, housing A+, health & safety A; Watch: amenities F, commute F.
- Muscle Shoals City (urban): math 42% / reading 60% proficiency, ranked #11 of 129 in AL (top 8%) — acceptable for families but not a draw, mixed tenant base, ~2y average lease.
- Zoned schools: Highland Park Elementary School (221 students, 52% FRL); Muscle Shoals High School (math 47% / reading 42%, grade F, #22 of 305 statewide, top 8%, 853 students, 40% FRL) — zoned schools average 46% FRL vs 25% district-wide (21 pts higher); higher-poverty schools than district average — tighter screening recommended.
- Market conditions: 254 active listings in the ZIP; 4 comparable units currently listed for rent nearby; rentals lingering (median 44d on market — plan ~5-8 weeks vacancy on turnover, expect pricing pressure); 100% of comp listings sitting > 30 days — soft ceiling on asking rent; 91 units permitted in Colbert County in 2024 (0 in 5+ unit buildings).
Forward outlook
- Local home prices are declining (-3.0%/yr); year-one equity from $671 of loan paydown is wiped out by about $3k of value loss. Plan a longer hold.
- Colbert County population projected to shrink 7% by 2050 — rents likely to lag national; underwrite the cash flow, not the appreciation.
- At projected returns (-3.0% appreciation + 3.0% rent growth), your $27k cash investment doubles in ~9 years — after that, you're playing with house money.
Negotiation context
- It's been on market 49 days — a 3% lower offer ($94k) is reasonable based on typical stale-listing flexibility.
- 5 sale attempts since 21y ago; this cycle's ask has dropped $13k (12%) from the opening price — seller is motivated, your offer sets the floor, not the list.
Risks & watch-outs
- Watch-outs: built in 1954 — expect roof / HVAC / electrical / plumbing capex.
- Climate carrying-cost: moderate wind risk, 23% chance of damaging wind over 30y; extreme-heat days projected 7→20/yr by 2055 (HVAC capex compounding) — expect insurance premiums to compound above CPI over the hold.
Questions for the listing agent
- It's been on market 49 days. Have you received any prior offers? Is the seller open to a 3% concession, seller financing, or rate buy-down credit?
- Built in 1954 — when were the roof, HVAC, electrical panel, plumbing, and water heater last replaced?
- Is there a deadline driving the sale (1031 exchange, divorce, estate, relocation)? That informs how much negotiation room exists.
- Schools are B-rated — typically a magnet for longer-tenancy family renters. What's the average tenant stay here, and is there a school-zone premium baked into asking?
- What's the average days-on-market for RENTAL listings here right now (not sales)? A rising rental-DOM trend means longer vacancies and softer asking-rent achievability than the comps imply.
- What's the recent tenant-quality profile in this submarket — average credit score on applications, eviction rate, late-payment / NSF rate, and stable-employment percentage? A property-management company in the area should have these aggregated.
- How much new for-sale + rental construction is in the pipeline within 1–3 miles? Heavy new supply typically softens prices + rents 12–24 months out; constrained supply supports both.
Investment metrics
- 1% rule
- 1.20% ✓
- Cap rate
- 10.30%
- Cash-on-cash
- 14.32%
- DSCR
- 1.64
- GRM
- 7.0
CMA / ARV
- ARV (median comp)
- $204,990
- List price
- $97,000
- Delta
- -52.68%
- Verdict
- UNDERPRICED
- Comps
- 20 within 1.0 mi
Show comp detail 12 sales within ~0.75 mi
| Address | Dist | Beds/Ba | Sqft | Sold | Price | $/sf | Match |
|---|---|---|---|---|---|---|---|
| 706 Brighton Ave | 0.14mi | 3/1.5 | 1,272 (-3%) | 2mo | $155,000 | $122 | 84 |
| 406 W Stevens Ave | 0.40mi | 3/2.0 | 1,285 (-2%) | 4mo | $194,000 | $151 | 70 |
| 707 Brighton Ave | 0.17mi | 3/1.5 | 1,413 (+8%) | 13mo | $200,000 | $142 | 67 |
| 99 Elizabeth St | 0.53mi | 3/2.0 | 1,364 (+4%) | 7mo | $237,000 | $174 | 59 |
| 408 W Brighton Ave | 0.30mi | 3/1.5 | 1,423 (+8%) | 14mo | $179,500 | $126 | 59 |
| 2701 John R St | 0.06mi | 3/2.0 | 1,500 (+14%) | 13mo | $224,500 | $150 | 59 |
| 405 W Dearborn St | 0.45mi | 3/1.5 | 1,416 (+8%) | 7mo | $186,000 | $131 | 58 |
| 506 Lasalle Ave | 0.29mi | 3/2.0 | 1,209 (-8%) | 14mo | $175,000 | $145 | 58 |
| 410 Stevens Ave | 0.42mi | 3/2.0 | 1,400 (+7%) | 13mo | $289,900 | $207 | 54 |
| 608 Candler Ave | 0.34mi | 3/2.0 | 1,140 (-13%) | 8mo | $224,000 | $196 | 51 |
| 409 W Dearborn St | 0.43mi | 3/2.0 | 1,453 (+11%) | 9mo | $224,900 | $155 | 51 |
| 3403 Brush St | 0.54mi | 3/2.0 | 1,446 (+10%) | 9mo | $177,500 | $123 | 46 |
Match score weights: distance 35% · size 25% · config 20% · recency 20%. Top-matched comps best support the ARV.
Projected returns pro-forma
-3.0% appreciation · 3.0% rent growth · sell at horizon
- IRR
- 4.6%
- Equity multiple
- 1.18×
- Total profit
- $4,888
- Equity at exit
- $14,463
- IRR
- 14.1%
- Equity multiple
- 2.13×
- Total profit
- $30,707
- Equity at exit
- $8,387
Cash invested: $27,160 (down + closing). Projections, not guarantees.
Landlord ↔ Tenant lean methodology
- Overall (STATE)
- 90 Strongly Landlord-Friendly
- State Alabama
- 90 Strongly Landlord-Friendly · R+15
- County
- — inherits STATE
- City
- — inherits STATE
ZIP-level market 35661
- Active inventory
- 254
- Price-to-rent
- 7.0×
Monthly cashflow live
- Estimated rent
- $1,161 medium interval (Pro) →
- Mortgage (P&I)
- −$509
- Tax from tax record
- −$44 /mo · $532/yr
- Insurance
- −$40
- HOA
- −$0
- Vacancy / Maint / Mgmt
- −$244
- Net cashflow
- $324
Break-even live
UW: 25.0% down · 7.5% · 30yr · 1.5% tax · 5.0% vac · 8.0% maint · 8.0% mgmt
Financing live
Cash to close
- Down payment
- $24,250
- Closing costs
- $2,910
- Reserves months
- —
- Total cash needed
- —
Loan-product check · same deal, 3 products live
Conventional
25% down · 7.5% · 30yr
- Down + closing
- —
- Monthly P&I
- —
- Monthly cashflow
- —
- DSCR
- —
- Eligible?
- —
Personal DTI + credit; lowest rate.
DSCR
20% down · 8.5% · 30yr
- Down + closing
- —
- Monthly P&I
- —
- Monthly cashflow
- —
- DSCR
- —
- Eligible?
- —
No personal income docs; deal must DSCR.
Hard money
10% down · 12.0% · 12mo
- Down + closing
- —
- Monthly P&I
- —
- Monthly cashflow
- —
- DSCR
- —
- Eligible?
- —
Short-term bridge; refi at stabilization.
Rent comps 4 comps
| Address | Beds | Baths | Sqft | Rent | $/sqft | DOM | Units | Dist |
|---|---|---|---|---|---|---|---|---|
| 1130 Paul E Johnson Memorial Dr Tuscumbia, AL | 3.0 | 2.0 | 1700 | $1,450 | $0.85 | 43d | 1 | 1.30mi |
| 100 Brink Ct Sheffield, AL | 2.0 | 2.0 | 1100 | $899 | $0.82 | 43d | 5 | 1.39mi |
| 3971 Elledge Ln Muscle Shoals, AL | 2.0 | 2.0 | 1150 | $1,295 | $1.13 | 43d | 3 | 1.49mi |
| 4311 Elledge Ln Muscle Shoals, AL | 2.0 | 2.0 | 1200 | $1,010 | $0.84 | 43d | 1 | 1.50mi |
Listing history 19 events
-
2026-06-19days on market $97,000 Active 49 DOM
-
2026-06-18days on market $97,000 Active 48 DOM
-
2026-06-17days on market $97,000 Active 47 DOM
-
2026-06-17price $97,000 Active 46 DOM
-
2026-06-16days on market $110,000 Active 46 DOM
-
2026-06-15days on market $110,000 Active 45 DOM
-
2026-06-14days on market $110,000 Active 43 DOM
-
2026-06-13days on market $110,000 Active 42 DOM
-
2026-06-10days on market $110,000 Active 40 DOM
-
2026-06-09days on market $110,000 Active 39 DOM
-
2026-06-08days on market $110,000 Active 38 DOM
-
2026-06-07statusdays on market $110,000 Active 37 DOM
-
2026-04-24$110,000 Active 705-char remark
-
2024-12-17price $140,000
-
2024-07-26$150,000 Active
-
2023-11-09soldstatus $130,000 Closed
-
2023-06-09status Pending
-
2023-01-18$131,000 Active
-
2005-01-20$69,900
ⓘ Source: listings_history table (triggers on properties + properties_extension) + one-shot
backfill from property_details.listing_events for pre-trigger history.
Tax reassessment forecast AL · Resets to sale price
- Current annual tax
- $532 · $44/mo
- Projected year-2 tax
- $532 · $44/mo
- Expected delta
- $0/yr ($0/mo · 0.0%)
ⓘ Screening estimate from a state-policy table — verify with the county assessor before closing.
Climate risk First Street
- Flood 1/10 Low FEMA zone X (unshaded) · 0% chance over 30 yrs
- Wildfire 1/10 Low
- Heat 6/10 Major 7 d/yr ≥107°F today · 20 d/yr by 30 yrs out
- Wind 5/10 Major 23% chance of damaging wind over 30 yrs
- Air quality 1/10 Low 0 unhealthy d/yr today · 0 by 30 yrs out
Nearby sold comps map
Loading sold comps map…
Walkable amenities ~0.75 mi
Loading nearby amenities…
Taxation est. · year 1
- Rental income
- $13,936
- − Mortgage interest
- −$5,434
- − Property taxes
- −$532
- − Insurance
- −$485
- − Repairs & maintenance
- −$1,115
- − Management
- −$1,115
- − Depreciation
- −$2,822
- Taxable income
- $2,434
- Est. tax owed @ 24.0%
- −$584
- After-tax cash flow
- $3,304/yr
For passive investors: Depreciation is non-cash, so a rental often shows a tax loss while cash-flowing — sheltering income. Rental losses are passive: they offset passive income freely, and up to $25,000/yr can offset ordinary (W-2) income if you actively participate and your MAGI is under $100k (phasing out to $0 by $150k); unused losses carry forward. On sale, claimed depreciation is recaptured at up to 25%, and gains may owe capital-gains tax (a 1031 exchange can defer both). Figures are a year-1 estimate at your 24.0% rate — not tax advice; consult a CPA.
Schools (NCES district)
- District
- Muscle Shoals City
- NCES district ID
- 0102520
- Math proficiency
- 42% ▼ -28.00%
- Reading proficiency
- 60% ▼ -1.00%
- Median HH income
- $50,688
- Composite
- 43.61/100
- National rank
- #2969
- State rank
- #11 of 129 in AL
Livability — Muscle Shoals
- Score
- 68/100
- State rank
- #68
- US rank
- #9422
Category grades
Schools grade is shown separately in the Schools card above.
Census & demographics
- Census place
- Muscle Shoals, AL
- Population (ZIP)
- 18,957
Population outlook (Colbert County) Hauer SSP2
- Today (2025)
- 54,154 people
- By 2030
- 53,746 · -0.8%
- By 2040
- 52,431 · -3.2%
- By 2050
- 50,303 · -7.1%
- By 2075
- 44,789 · -17.3%
- By 2100
- 36,676 · -32.3%
Race, ethnicity, and origin ACS 2023
- Neighborhood character
- Predominantly White (78%)
- Race & ethnicity
- White 78% Black 14% Two or more races 5% Hispanic / Latino 5%
- Common ancestry
- Slovak 2% Serbian 1% Iranian 1%
- Foreign-born
- 2% · Canada
- Languages at home
- 97% English-only · Spanish 2% Other Indo-European 1%
Political lean MEDSL · Colbert
- 2024 margin
- Solid R (+46.4) · D 26.4% · R 72.8%
- 2008→2024 swing
- -26.2pp toward R · 2008: -20.3pp · 2024: -46.4pp
- All cycles
- 2024: R+46.4 2020: R+38.9 2016: R+38.3 2012: R+20.4 2008: R+20.3
Not yet ingested
- Civics
- —
Market trends
- HPI YoY
- ▼ -103.94%
- Current HPI
- 174.6414
- Rent YoY
- —
- Metro
- —
- State GDP YoY
- ▲ 2.94%
- F500 in state
- 4
Industry mix (Fortune 500 HQ in AL)
| Industry | F500 HQs | Revenue |
|---|---|---|
| Financial Services | 1 | $8B |
|
||
| Healthcare | 1 | $5B |
|
||
Price history
+38.8% since first listed10 events — show timeline
- 2026-06-16 Price Changed $97,000 SAARMLS
- 2026-06-05 Relisted — SAARMLS
- 2026-05-29 Pending — SAARMLS
- 2026-04-24 Listed $110,000 SAARMLS
- 2024-12-17 Price Changed $140,000 SAARMLS
- 2024-07-26 Listed $150,000 SAARMLS
- 2023-11-09 Sold (MLS) $130,000 SAARMLS
- 2023-06-09 Pending — SAARMLS
- 2023-01-18 Listed $131,000 SAARMLS
- 2005-01-20 Listed $69,900 SAARMLS
Property tax history
+5.7%/yrLatest (2025): $532 · +0.6% YoY. Source: county tax records.
Cash-flow waterfall
monthlySold comps — $/sqft
last 12 mo · ≤1 miLoading sold comps…