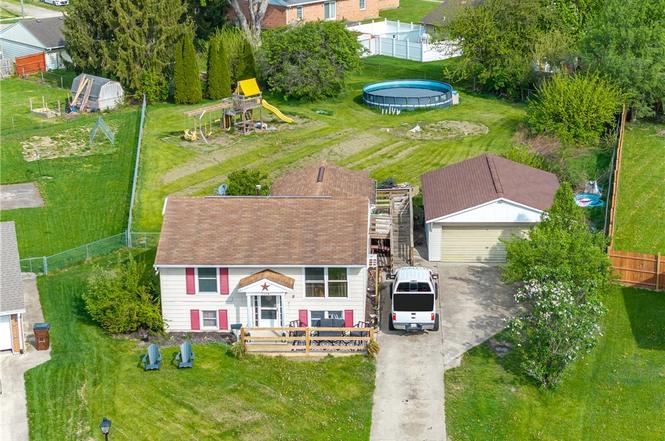
2014 Westboro Ave · Springfield, OH
Flood risk 1/10 · Minimal
- FEMA flood zone
- X (unshaded)
- Chance of flooding over 30 yrs
- 0.0%
- Est. flood insurance / yr
- $473 – $860
Fire risk 1/10 · Minimal
- Est. fire insurance / yr
- $713 – $1,323
Heat risk 3/10 · Minor
- Hot days now (above 100°F)
- 7 days/yr
- Hot days in 30 yrs
- 18 days/yr
Wind risk 2/10 · Minimal
- Chance of severe wind over 30 yrs
- 0.0%
Air-quality risk 4/10 · Minor
- Unhealthy air days now
- 3 days/yr
- Unhealthy air days in 30 yrs
- 5 days/yr
Risk factors via First Street. Map © Google.
Why this score? — see what drove the C- grade
The composite is a weighted blend of 9 inputs, each scored 0–100. Each bar is that input's sub-score; the figure is the points it added to the 100-point composite (weight × sub-score).
- ARV discount +15.0/15.0
- Cash flow +14.4/30.0
- Schools +4.7/10.0
- DSCR +4.4/10.0
- 1% rule +3.9/10.0
- Livability +2.8/5.0
- Rent growth +2.5/5.0
- Condition / age +2.5/5.0
- Appreciation +0.0/10.0
$187,000
🖨 Deal sheet (PDF) 📄 Offer letter ✓ Due diligence
Listing remarks
Rarely does a home offering this much space, flexibility, and value become available in Northeastern Local School District. Welcome to 2014 Westboro Avenue, where opportunity and functionality come together in all the right ways. This five bedroom, two full bath home offers approximately 1,730 square feet across two thoughtfully designed levels that live larger than expected and feel anything but ordinary. The main level features an inviting open concept layout centered around a remodeled kitchen with added cabinetry, an oversized island, and seamless flow into the dining and living areas. Wood beam accents and custom barn doors add warmth, character, and style rarely found at this price po
Key facts
- Remodeled kitchen
- Wood beam detail
- Custom barn doors
Tags
Property features AI
Finance
- Financial info: Offered for sale
Exterior
- Parking: Detached two-car garage with storage
- Home design: Residential zoning
- Construction: Aluminum siding; Vinyl siding; Stone exterior
- Exterior features: Deck; Patio; Porch; Fence
Interior
- Kitchen: Microwave; Range; Kitchen island; Pantry; Laminate counters
- Bedrooms: Bedroom on main level; Bedrooms on lower level
- Bathrooms: 2 full bathrooms; 1 bathroom on the main level
- Heating & cooling: Forced air heating; Natural gas heating
- Interior features: Wet bar; Ceiling fans; High-speed internet; Kitchen island; Kitchen/family room combo; Laminate counters; Pantry; Remodeled; Bar
- Laundry & utility: Laundry room on lower level
Neighborhood map
What this means for you Summary
Snapshot
- This is a 5-bed/1.5-bath single-family listed at $187k.
Deal economics
- At list price, monthly cash flow is $39 ($472/yr) — positive.
- The deal already cash-flows at list — no discount required.
- To meet the 1% rule (rent ≥ 1% of price), the offer needs to be $166k (11.1% below list).
- Recommended offer: $166k (11.1% below list) — sets the bar for 1% rule.
- Cap rate 6.5% vs local median 4.7% in Springfield — top-decile yield for the area; either an underpriced asset or a hidden risk that comps aren't pricing in. Stress-test before assuming the spread holds.
Location & tenants
- Location reads 56/100 on livability (#1,108 in OH) — a working-class tenant base; expect higher turnover. Strengths: cost of living A+, housing A+; Watch: crime F, amenities F, commute F.
- Northeastern Local (suburban): math 49% / reading 60% proficiency, ranked #365 of 656 in OH (top 56%) — acceptable for families but not a draw, mixed tenant base, ~2y average lease.
- Zoned schools: Northridge Middle School (math 47% / reading 55%, grade C, #405 of 654 statewide, top 63%, 445 students, 0% FRL) — zoned schools average 0% FRL vs 27% district-wide (27 pts lower); this property's tenant base skews higher-income than the district average.
- Market conditions: 144 active listings in the ZIP; 232 units permitted in Clark County in 2024 (116 in 5+ unit buildings).
- This rent runs 37% of the median local income ($55k/yr) — at the standard rent-burdened threshold; future hikes will face affordability resistance.
Forward outlook
- Local home prices are declining (-3.0%/yr); year-one equity from $1k of loan paydown is wiped out by about $6k of value loss. Plan a longer hold.
- Clark County population projected at -16% by 2050 — secular population decline; favor cash flow + early exit over multi-decade hold.
Negotiation context
- It's been on market 51 days — a 3% lower offer ($181k) is reasonable based on typical stale-listing flexibility.
- 2 sale attempts; this cycle's ask has dropped $12k (6%) from the opening price — seller is motivated, your offer sets the floor, not the list.
- Current owner paid $97k; list at $187k implies a 93% gain — meaningful room to come down on a strong offer.
Questions for the listing agent
- It's been on market 51 days. Have you received any prior offers? Is the seller open to a 11% concession, seller financing, or rate buy-down credit?
- Built in 1972 — when were the roof, HVAC, electrical panel, plumbing, and water heater last replaced?
- Is there a deadline driving the sale (1031 exchange, divorce, estate, relocation)? That informs how much negotiation room exists.
- Crime grade is F in this area — have there been break-ins, vandalism, or insurance claims at this property in the last 3 years? What carrier currently insures it and at what premium?
- What's the average days-on-market for RENTAL listings here right now (not sales)? A rising rental-DOM trend means longer vacancies and softer asking-rent achievability than the comps imply.
- What's the recent tenant-quality profile in this submarket — average credit score on applications, eviction rate, late-payment / NSF rate, and stable-employment percentage? A property-management company in the area should have these aggregated.
- How much new for-sale + rental construction is in the pipeline within 1–3 miles? Heavy new supply typically softens prices + rents 12–24 months out; constrained supply supports both.
Investment metrics
- 1% rule
- 0.89% ✗
- Cap rate
- 6.55%
- Cash-on-cash
- 0.90%
- DSCR
- 1.04
- GRM
- 9.4
CMA / ARV
- ARV (on-the-fly)
- $266,574
- Comps found
- 5
Show comp detail 5 sales within ~0.75 mi
| Address | Dist | Beds/Ba | Sqft | Sold | Price | $/sf | Match |
|---|---|---|---|---|---|---|---|
| 2907 Mystic Ln | 0.49mi | 4/1.5 (-1) | 1,600 (-8%) | 7mo | $246,000 | $154 | 53 |
| 1642 Falmouth Ave | 0.36mi | 4/1.5 (-1) | 1,550 (-10%) | 19mo | $183,000 | $118 | 45 |
| 3132 Woonsocket St | 0.37mi | 4/1.5 (-1) | 1,475 (-15%) | 13mo | $232,500 | $158 | 42 |
| 2923 Cavins Dr | 0.74mi | 5/2.5 | 1,661 (-4%) | 18mo | $260,000 | $157 | 40 |
| 2643 Casey Dr | 0.73mi | 4/2.5 (-1) | 1,575 (-9%) | 10mo | $235,000 | $149 | 33 |
Match score weights: distance 35% · size 25% · config 20% · recency 20%. Top-matched comps best support the ARV.
Projected returns pro-forma
-3.0% appreciation · 3.0% rent growth · sell at horizon
- IRR
- -14.9%
- Equity multiple
- 0.47×
- Total profit
- $-27,781
- Equity at exit
- $27,882
- IRR
- -6.2%
- Equity multiple
- 0.60×
- Total profit
- $-20,906
- Equity at exit
- $16,168
Cash invested: $52,360 (down + closing). Projections, not guarantees.
Landlord ↔ Tenant lean methodology
- Overall (STATE)
- 73 Landlord-Friendly
- State Ohio
- 73 Landlord-Friendly · R+6
- County
- — inherits STATE
- City
- — inherits STATE
ZIP-level market 45503
- Active inventory
- 144
- Price-to-rent
- 9.4×
Monthly cashflow live
- Estimated rent
- $1,663 medium interval (Pro) →
- Mortgage (P&I)
- −$981
- Tax from tax record
- −$216 /mo · $2,593/yr
- Insurance
- −$78
- HOA
- −$0
- Vacancy / Maint / Mgmt
- −$349
- Net cashflow
- $39
Break-even live
Sensitivity live
| Price | -10% $145 | -5% $92 | +0% $39 | +5% $-14 | +10% $-67 |
|---|---|---|---|---|---|
| Rent | -10% $-92 | -5% $-26 | +0% $39 | +5% $105 | +10% $171 |
| Rate | -1.0pp $134 | -0.5pp $87 | base $39 | +0.5pp $-9 | +1.0pp $-58 |
UW: 25.0% down · 7.5% · 30yr · 1.5% tax · 5.0% vac · 8.0% maint · 8.0% mgmt
Financing live
Cash to close
- Down payment
- $46,750
- Closing costs
- $5,610
- Reserves months
- —
- Total cash needed
- —
Loan-product check · same deal, 3 products live
Conventional
25% down · 7.5% · 30yr
- Down + closing
- —
- Monthly P&I
- —
- Monthly cashflow
- —
- DSCR
- —
- Eligible?
- —
Personal DTI + credit; lowest rate.
DSCR
20% down · 8.5% · 30yr
- Down + closing
- —
- Monthly P&I
- —
- Monthly cashflow
- —
- DSCR
- —
- Eligible?
- —
No personal income docs; deal must DSCR.
Hard money
10% down · 12.0% · 12mo
- Down + closing
- —
- Monthly P&I
- —
- Monthly cashflow
- —
- DSCR
- —
- Eligible?
- —
Short-term bridge; refi at stabilization.
Listing history 17 events
-
2026-06-21days on market $187,000 Active 51 DOM
-
2026-06-21statusdays on market $187,000 Active 50 DOM
-
2026-06-18days on market $187,000 ActiveUnderContract 48 DOM
-
2026-06-17days on market $187,000 ActiveUnderContract 47 DOM
-
2026-06-16days on market $187,000 ActiveUnderContract 46 DOM
-
2026-06-15days on market $187,000 ActiveUnderContract 45 DOM
-
2026-06-13days on market $187,000 ActiveUnderContract 43 DOM
-
2026-06-12days on market $187,000 ActiveUnderContract 42 DOM
-
2026-06-09days on market $187,000 ActiveUnderContract 39 DOM
-
2026-06-08days on market $187,000 ActiveUnderContract 38 DOM
-
2026-06-08days on market $187,000 ActiveUnderContract 37 DOM
-
2026-06-07days on market $187,000 ActiveUnderContract 36 DOM
-
2026-06-04days on market $187,000 ActiveUnderContract 33 DOM
-
2026-06-02days on market $187,000 ActiveUnderContract 32 DOM
-
2026-06-01days on market $187,000 ActiveUnderContract 31 DOM
-
2026-05-31remarks 699-char remark
-
2026-05-31$187,000 ActiveUnderContract 30 DOM
ⓘ Source: listings_history table (triggers on properties + properties_extension) + one-shot
backfill from property_details.listing_events for pre-trigger history.
Tax reassessment forecast OH · Partial reset (capped growth)
- Current annual tax
- $2,593 · $216/mo
- Projected year-2 tax
- $2,755 · $230/mo
- Expected delta
- +$162/yr (+$13/mo · 6.2%)
ⓘ Screening estimate from a state-policy table — verify with the county assessor before closing.
Climate risk First Street
- Flood 1/10 Low FEMA zone X (unshaded) · 0% chance over 30 yrs
- Wildfire 1/10 Low
- Heat 3/10 Moderate 7 d/yr ≥100°F today · 18 d/yr by 30 yrs out
- Wind 2/10 Low 0% chance of damaging wind over 30 yrs
- Air quality 4/10 Moderate 3 unhealthy d/yr today · 5 by 30 yrs out
Nearby sold comps map
Loading sold comps map…
Walkable amenities ~0.75 mi
Loading nearby amenities…
Taxation est. · year 1
- Rental income
- $19,960
- − Mortgage interest
- −$10,475
- − Property taxes
- −$2,593
- − Insurance
- −$935
- − Repairs & maintenance
- −$1,597
- − Management
- −$1,597
- − Depreciation
- −$5,440
- Taxable loss
- −$2,677
- Est. tax savings @ 24.0%
- +$642
- After-tax cash flow
- $1,115/yr
For passive investors: Depreciation is non-cash, so a rental often shows a tax loss while cash-flowing — sheltering income. Rental losses are passive: they offset passive income freely, and up to $25,000/yr can offset ordinary (W-2) income if you actively participate and your MAGI is under $100k (phasing out to $0 by $150k); unused losses carry forward. On sale, claimed depreciation is recaptured at up to 25%, and gains may owe capital-gains tax (a 1031 exchange can defer both). Figures are a year-1 estimate at your 24.0% rate — not tax advice; consult a CPA.
Schools (NCES district)
- District
- Northeastern Local
- NCES district ID
- 3904625
- Math proficiency
- 49% ▼ -16.00%
- Reading proficiency
- 60% ▼ -7.00%
- Median HH income
- $55,340
- Composite
- 46.99/100
- National rank
- #2350
- State rank
- #365 of 656 in OH
Livability — Springfield
- Score
- 56/100
- State rank
- #1108
- US rank
- #22551
Category grades
Schools grade is shown separately in the Schools card above.
Census & demographics
- Census place
- Springfield, OH
- County
- Clark · 134,280 people
- City population
- 33,261
- Metro
- Springfield, OH
- Population (ZIP)
- 32,673
- Household income
- $54,561
- Rent vs Own
- Severe rent burden
- 4.7
Population outlook (Clark County) Hauer SSP2
- Today (2025)
- 130,703 people
- By 2030
- 126,952 · -2.9%
- By 2040
- 118,344 · -9.5%
- By 2050
- 109,590 · -16.2%
- By 2075
- 89,464 · -31.6%
- By 2100
- 68,810 · -47.4%
Race, ethnicity, and origin ACS 2023
- Neighborhood character
- Predominantly White (84%)
- Race & ethnicity
- White 84% Black 9% Two or more races 5% Hispanic / Latino 2%
- Common ancestry
- Italian 2% Lithuanian 1% Slovak 1%
- Foreign-born
- 2% · Canada
- Languages at home
- 98% English-only · French/Haitian/Cajun 1% Spanish 1%
Political lean MEDSL · Clark
- 2024 margin
- Strong R (+29.5) · D 34.8% · R 64.3%
- 2008→2024 swing
- -27.0pp toward R · 2008: -2.5pp · 2024: -29.5pp
- All cycles
- 2024: R+29.5 2020: R+23.3 2016: R+19.5 2012: R+1.8 2008: R+2.5
Not yet ingested
- Civics
- —
Market trends
- HPI YoY
- ▼ -211.92%
- Current HPI
- 257.5694
- Rent YoY
- —
- Metro
- —
- State GDP YoY
- ▲ 1.98%
- F500 in state
- 48
Industry mix (Fortune 500 HQ in OH)
| Industry | F500 HQs | Revenue |
|---|---|---|
| Insurance | 3 | $145B |
|
||
| Industrial Machinery | 3 | $49B |
|
||
| Financial Services | 3 | $24B |
|
||
| Consumer Goods | 2 | $93B |
|
||
| Aerospace / Defense | 2 | $47B |
|
||
| Utilities | 2 | $33B |
|
||
Price history
+112.5% since first listed8 events — show timeline
- 2026-05-19 Contingent — Dayton MLS
- 2026-05-05 Relisted — Dayton MLS
- 2026-05-05 Price Changed $187,000 Dayton MLS
- 2026-04-22 Pending — Dayton MLS
- 2026-04-18 Listed $199,500 Dayton MLS
- 2014-04-08 Sold (Public Records) $96,700 Public Records
- 2011-06-01 Sold (Public Records) $98,000 Public Records
- 1999-05-06 Sold (Public Records) $88,000 Public Records
Property tax history
+6.5%/yrLatest (2025): $2,593 · +23.4% YoY. Source: county tax records.
Cash-flow waterfall
monthlySold comps — $/sqft
last 12 mo · ≤1 miLoading sold comps…