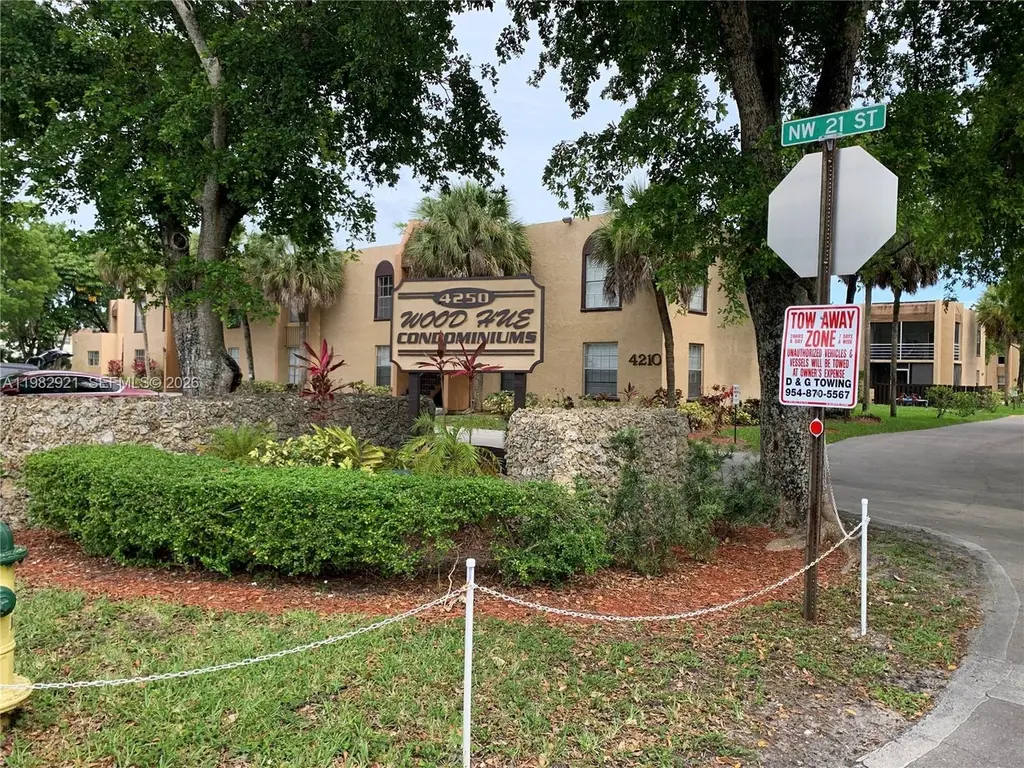
4210 NW 21st St #102 · Lauderhill, FL
Flood risk No data
- FEMA flood zone
- —
- Chance of flooding over 30 yrs
- —
- Est. flood insurance / yr
- —
Fire risk No data
- Est. fire insurance / yr
- —
Heat risk No data
- Hot days now (above threshold)
- —
- Hot days in 30 yrs
- —
Wind risk No data
- Chance of severe wind over 30 yrs
- —
Air-quality risk No data
- Unhealthy air days now
- —
- Unhealthy air days in 30 yrs
- —
Risk factors via First Street. Map © Google.
Why this score? — see what drove the D grade
The composite is a weighted blend of 9 inputs, each scored 0–100. Each bar is that input's sub-score; the figure is the points it added to the 100-point composite (weight × sub-score).
- Cash flow +10.0/30.0
- ARV discount +7.5/15.0
- 1% rule +7.3/10.0
- Schools +4.1/10.0
- Livability +4.0/5.0
- DSCR +2.8/10.0
- Rent growth +2.6/5.0
- Condition / age +2.5/5.0
- Appreciation +0.0/10.0
$142,000
🖨 Deal sheet 📄 Offer letter ✓ Due diligence
Listing remarks
Welcome to this lovely 2 bedroom, 2 bathroom corner unit. Ready for you to apply your personal touch to it. Washer and Dryer in unit. The association fee of $366 per month covers water, lawn care, exterior insurance, and trash. The community includes a pool, tennis court, clubhouse, and laundry facilities. No down payment required by association. Owner occupant are allowed pets. Property sold AS IS. Do not show without appointment. Tenant lease expires on August 31, 2026.
Key facts
- Laundry facilities
- Tennis court
- Clubhouse
Tags
Property features AI
Finance
- Financial info: Pets allowed with size limit (maximum 20 lbs)
- HOA & community: Monthly association fee; Association covers common areas, grounds maintenance, trash, and water; Community amenities include clubhouse, pool, and tennis courts
Exterior
- Parking: Assigned parking; Guest parking
- Security: Complex fenced
- Home design: Attached property; 2 stories; Entry at level 2
- Construction: Block construction; Effective year built
- Exterior features: Balcony; Screened balcony/porch; Complex is fenced; Association pool
Interior
- Kitchen: Electric range; Refrigerator
- Bedrooms: Includes bedroom on the main level
- Flooring: Ceramic tile
- Bathrooms: 2 full bathrooms
- Heating & cooling: Central heating; Central air conditioning
- Interior features: Bedroom on main level; Second floor entry; Living/dining room layout; Tub with shower; Walk-in closet(s)
Neighborhood map
What this means for you Summary
Snapshot
- This is a 2-bed/2.0-bath condo listed at $142k.
Deal economics
- At list price, monthly cash flow is $-86 ($-1k/yr) — negative.
- To cash-flow at today's rent, offer at most $127k (10.7% below list).
- Meets the 1% rule at list price ($2k rent vs $142k).
- Recommended offer: $127k (10.7% below list) — sets the bar for cash-flow.
- Cap rate 5.6% vs local median 4.3% in Lauderhill — top-decile yield for the area; either an underpriced asset or a hidden risk that comps aren't pricing in. Stress-test before assuming the spread holds.
Location & tenants
- Location reads 79/100 on livability (#139 in FL, #2,059 nationally) — a middle-class / working-renter tenant base. Strengths: commute A+, cost of living A+, housing A+; Watch: schools D, employment D, amenities F.
- Broward (suburban): math 42% / reading 53% proficiency, ranked #46 of 73 in FL (top 63%) — families likely to look elsewhere, expect single-tenant / working-renter base with shorter leases.
- Market conditions: Rents flat; 656 active listings in the ZIP; 40 comparable units currently listed for rent nearby; rentals at typical pace (median 24d on market — plan ~3-4 weeks tenant-placement turnaround); 2,111 units permitted in Broward County in 2024 (1,265 in 5+ unit buildings).
- At $1,745/mo this rent would consume 45% of the median local household income ($46k/yr) (locally 5692% of renters already pay >50% of income on rent) — very limited rent-growth headroom before tenants either downsize or default.
Forward outlook
- Local home prices are declining (-3.0%/yr); year-one equity from $982 of loan paydown is wiped out by about $4k of value loss. Plan a longer hold.
- Broward County population projected at +34% by 2050 — long-run rental-demand tailwind backs the buy-and-hold thesis.
Negotiation context
- It's been on market 90 days — a 6% lower offer ($133k) is reasonable based on typical stale-listing flexibility.
- 3 sale attempts with the ask held roughly flat each time — persistent listings suggest the price (not the market) is what's stuck; bring a comps-based counter.
- Current owner paid $73k; list at $142k implies a 95% gain — meaningful room to come down on a strong offer.
Risks & watch-outs
- Watch-outs: HOA is 21% of rent.
Questions for the listing agent
- What do current leases actually rent for vs. the listed asking? Can we see a recent rent roll and the last 12 months of T-12 income?
- It's been on market 90 days. Have you received any prior offers? Is the seller open to a 11% concession, seller financing, or rate buy-down credit?
- Built in 1975 — when were the roof, HVAC, electrical panel, plumbing, and water heater last replaced?
- What does the HOA fee cover, when was the last increase, and are there any pending special assessments or reserve-fund shortfalls?
- Any open or pending special assessments — roof, HVAC, plumbing, elevator, façade? What's the per-unit balance and payoff schedule, and is the seller paying it off at close or rolling it to the buyer?
- Why hasn't it sold? Are there any deal-killer items the seller is aware of (foundation, flood, title, zoning, code violations)?
- Is there a deadline driving the sale (1031 exchange, divorce, estate, relocation)? That informs how much negotiation room exists.
- Schools are D-rated, which usually means shorter tenancies and higher turnover. Who's the typical renter profile here, and what's been the actual vacancy rate?
- The area grade is low — what's the realistic commute time and amenity access for the typical tenant pool here? Any planned neighborhood developments (good or bad) we should know about?
- What's the average days-on-market for RENTAL listings here right now (not sales)? A rising rental-DOM trend means longer vacancies and softer asking-rent achievability than the comps imply.
- What's the recent tenant-quality profile in this submarket — average credit score on applications, eviction rate, late-payment / NSF rate, and stable-employment percentage? A property-management company in the area should have these aggregated.
- How much new apartment / multifamily construction is in the pipeline within 1–3 miles? Heavy new supply (>2% of stock underway) typically softens rents 12–24 months out; light construction supports rent growth.
Investment metrics
- 1% rule
- 1.23% ✓
- Cap rate
- 5.57%
- Cash-on-cash
- -2.60%
- DSCR
- 0.88
- GRM
- 6.8
CMA / ARV
No comps found within radius.
Projected returns pro-forma
-3.0% appreciation · 0.26% rent growth · sell at horizon
- IRR
- -25.2%
- Equity multiple
- 0.17×
- Total profit
- $-32,850
- Equity at exit
- $21,173
- IRR
- -42.9%
- Equity multiple
- -0.32×
- Total profit
- $-52,540
- Equity at exit
- $12,278
Cash invested: $39,760 (down + closing). Projections, not guarantees.
Landlord ↔ Tenant lean methodology
- Overall (STATE)
- 87 Strongly Landlord-Friendly
- State Florida
- 87 Strongly Landlord-Friendly · R+3
- County
- — inherits STATE
- City
- — inherits STATE
ZIP-level market 33313
- Rents YoY
- 0.3%
- Active inventory
- 656
- Price-to-rent
- 6.8×
Monthly cashflow live
- Estimated rent
- $1,745 high interval (Pro) →
- Mortgage (P&I)
- −$745
- Tax from tax record
- −$295 /mo · $3,540/yr
- Insurance
- −$59
- HOA
- −$366
- Vacancy / Maint / Mgmt
- −$367
- Net cashflow
- $-86
Break-even live
UW: 25.0% down · 7.5% · 30yr · 1.5% tax · 5.0% vac · 8.0% maint · 8.0% mgmt
Financing live
Cash to close
- Down payment
- $35,500
- Closing costs
- $4,260
- Reserves months
- —
- Total cash needed
- —
Loan-product check · same deal, 3 products live
Conventional
25% down · 7.5% · 30yr
- Down + closing
- —
- Monthly P&I
- —
- Monthly cashflow
- —
- DSCR
- —
- Eligible?
- —
Personal DTI + credit; lowest rate.
DSCR
20% down · 8.5% · 30yr
- Down + closing
- —
- Monthly P&I
- —
- Monthly cashflow
- —
- DSCR
- —
- Eligible?
- —
No personal income docs; deal must DSCR.
Hard money
10% down · 12.0% · 12mo
- Down + closing
- —
- Monthly P&I
- —
- Monthly cashflow
- —
- DSCR
- —
- Eligible?
- —
Short-term bridge; refi at stabilization.
Rent comps 40 comps
| Address | Beds | Baths | Sqft | Rent | $/sqft | DOM | Units | Dist |
|---|---|---|---|---|---|---|---|---|
| 4240 NW 21st St #134 Lauderhill, FL | 1.0 | 1.0 | 812 | $1,500 | $1.85 | 24d | 1 | 0.03mi |
| 4160 NW 21st St Lauderhill, FL | 1.0–2.0 | 1.0 | 810 | $1,700 | $2.10 | 24d | 3 | 0.06mi |
| 4160 NW 21st St Lauderhill, FL | 1.0–2.0 | 1.0 | 810 | $1,700 | $2.10 | 7d | 2 | 0.06mi |
| 4491 NW 19th St Lauderhill, FL | 1.0–3.0 | 1.0–2.5 | 1358 | $2,025 | $1.49 | 1d | 39 | 0.29mi |
| 4047 NW 16th St #109 Lauderhill, FL | 1.0 | 1.0 | 725 | $1,300 | $1.79 | 24d | 1 | 0.31mi |
| 2029 NW 46th Ave Lauderhill, FL | 1.0 | 1.5 | 800 | $1,500 | $1.88 | 24d | 1 | 0.35mi |
| 2017 NW 46th Ave Unit A110 Lauderhill, FL | 1.0 | 1.5 | 800 | $1,650 | $2.06 | 24d | 1 | 0.36mi |
| 4361 NW 25th Pl Lauderhill, FL | 3.0 | 1.0 | 1284 | $2,495 | $1.94 | 16d | 1 | 0.42mi |
| 4361 NW 25th Pl Lauderhill, FL | 3.0 | 1.0 | 1284 | $2,395 | $1.87 | 1d | 1 | 0.42mi |
| 1861 NW 46th Ave Lauderhill, FL | 2.0 | 1.0–2.0 | 730 | $1,679 | $2.30 | 1d | 13 | 0.45mi |
| 4299 NW 16th St #103 Lauderhill, FL | 1.0 | 1.0 | 700 | $1,400 | $2.00 | 24d | 1 | 0.46mi |
| 4299 NW 16th St #103 Lauderhill, FL | 1.0 | 1.0 | 700 | $1,400 | $2.00 | 7d | 1 | 0.46mi |
| 4321 NW 16th St Unit 202C Lauderhill, FL | 2.0 | 2.0 | 867 | $1,700 | $1.96 | 24d | 1 | 0.47mi |
| 3700 NW 21st St #203 Lauderdale Lakes, FL | 1.0 | 1.0 | 800 | $1,500 | $1.88 | 20d | 1 | 0.47mi |
| 4121 NW 26th St Unit T16 Lauderhill, FL | 1.0 | 1.5 | 750 | $1,500 | $2.00 | 24d | 1 | 0.47mi |
| 2061 NW 47th Ter Lauderhill, FL | 1.0 | 1.5 | 928 | $1,620 | $1.75 | 3d | 2 | 0.51mi |
| 2700 NW 39th Way Lauderdale Lakes, FL | 2.0–3.0 | 1.0–1.5 | 858 | $1,750 | $2.04 | 3d | 6 | 0.52mi |
| 3610 NW 21st St Lauderdale Lakes, FL | 1.0–2.0 | 1.0–2.0 | 950 | $1,750 | $1.84 | 24d | 2 | 0.52mi |
| 3610 NW 21st St #308 Lauderdale Lakes, FL | 2.0 | 2.0 | 1100 | $1,750 | $1.59 | 21d | 1 | 0.52mi |
| 3610 NW 21st St #413 Lauderdale Lakes, FL | 2.0 | 2.0 | 1100 | $1,750 | $1.59 | 20d | 1 | 0.52mi |
| 1701 NW 46th Ave #109 Lauderhill, FL | 2.0 | 2.0 | 828 | $1,800 | $2.17 | 21d | 1 | 0.54mi |
| 4740 NW 21st St Lauderhill, FL | 1.0 | 1.5 | 1003 | $1,575 | $1.57 | 19d | 2 | 0.55mi |
| 1599 NW 43rd Ave #106 Lauderhill, FL | 1.0 | 1.0 | 730 | $1,499 | $2.05 | 17d | 1 | 0.55mi |
| 4750 NW 22nd Ct #502 Lauderhill, FL | 1.0 | 1.5 | 928 | $1,600 | $1.72 | 24d | 1 | 0.56mi |
| 3710 NW 21st St #305 Lauderdale Lakes, FL | 2.0 | 2.0 | 1100 | $1,650 | $1.50 | 24d | 1 | 0.57mi |
| 1490 NW 43rd Ave #206 Lauderhill, FL | 2.0 | 2.0 | 950 | $1,800 | $1.89 | 19d | 1 | 0.58mi |
| 1631 NW 46th Ave #118 Lauderhill, FL | 2.0 | 2.0 | 828 | $1,750 | $2.11 | 24d | 1 | 0.59mi |
| 1501 NW 43rd Ave #204 Lauderhill, FL | 2.0 | 2.0 | 950 | $1,650 | $1.74 | 24d | 1 | 0.62mi |
| 2060 NW 48th Ter Lauderhill, FL | 1.0–2.0 | 1.0–2.0 | 886 | $1,595 | $1.80 | 7d | 2 | 0.64mi |
| 4851 NW 21st St Unit 2P Lauderhill, FL | 1.0 | 1.5 | 1074 | $1,400 | $1.30 | 24d | 1 | 0.66mi |
| 2980 NW 43rd Ter #207 Lauderdale Lakes, FL | 2.0 | 2.0 | 890 | $1,800 | $2.02 | 24d | 1 | 0.70mi |
| 1310 NW 43rd Ave #303 Lauderhill, FL | 1.0 | 1.0 | 950 | $1,400 | $1.47 | 24d | 1 | 0.71mi |
| 3684 NW 29th Ct Lauderdale Lakes, FL | 3.0 | 2.5 | 1478 | $2,700 | $1.83 | 24d | 1 | 0.72mi |
| 2800 NW 47th Ter Unit 106B Lauderdale Lakes, FL | 1.0 | 1.0 | 768 | $1,650 | $2.15 | 24d | 1 | 0.72mi |
| 1530 NW 47th Ave Lauderhill, FL | 3.0 | 2.0 | 1439 | $3,000 | $2.08 | 24d | 1 | 0.73mi |
| 1530 NW 47th Ave Unit 1 Lauderhill, FL | 1.0 | 1.0 | 1439 | $1,400 | $0.97 | 24d | 1 | 0.73mi |
| 2713 NW 47th Ter #504 Lauderdale Lakes, FL | 2.0 | 1.0 | 1133 | $1,700 | $1.50 | 1d | 1 | 0.74mi |
| 4848 NW 24th Ct Lauderdale Lakes, FL | 1.0–3.0 | 1.0–2.0 | 1045 | $1,725 | $1.65 | 16d | 3 | 0.74mi |
| 4848 NW 24th Ct Lauderdale Lakes, FL | 2.0–3.0 | 2.0 | 1230 | $1,800 | $1.46 | 24d | 2 | 0.74mi |
| 4848 NW 24th Ct Lauderdale Lakes, FL | 1.0–3.0 | 1.0–2.0 | 1045 | $1,675 | $1.60 | 5d | 4 | 0.74mi |
HOA detail condo
- Monthly dues
- $366 · $4,392/yr
- Likely covers
- watertrashlandscapingpool
- Assessments
- None detected in remarks — confirm with the listing agent.
Listing history 20 events
-
2026-06-18days on market $142,000 Active 90 DOM
-
2026-06-17days on market $142,000 Active 89 DOM
-
2026-06-16days on market $142,000 Active 88 DOM
-
2026-06-15days on market $142,000 Active 87 DOM
-
2026-06-13days on market $142,000 Active 85 DOM
-
2026-06-09days on market $142,000 Active 81 DOM
-
2026-06-08days on market $142,000 Active 80 DOM
-
2026-06-07days on market $142,000 Active 79 DOM
-
2026-06-04days on market $142,000 Active 76 DOM
-
2026-06-03days on market $142,000 Active 75 DOM
-
2026-06-02days on market $142,000 Active 74 DOM
-
2026-06-01days on market $142,000 Active 73 DOM
-
2026-05-31days on market $142,000 Active 72 DOM
-
2026-03-07$142,000 Active
-
2025-08-09historical $1,400
-
2025-08-01$1,400
-
2025-04-04$250,000 Active
-
2019-06-20soldstatus $72,900
-
1998-02-23soldstatus $37,000
-
1984-10-01soldstatus $42,000
ⓘ Source: listings_history table (triggers on properties + properties_extension) + one-shot
backfill from property_details.listing_events for pre-trigger history.
Tax reassessment forecast FL · Resets to sale price
- Current annual tax
- $3,540 · $295/mo
- Projected year-2 tax
- $3,540 · $295/mo
- Expected delta
- $0/yr ($0/mo · 0.0%)
ⓘ Screening estimate from a state-policy table — verify with the county assessor before closing.
Nearby sold comps map
Loading sold comps map…
Walkable amenities ~0.75 mi
Loading nearby amenities…
Taxation est. · year 1
- Rental income
- $20,943
- − Mortgage interest
- −$7,954
- − Property taxes
- −$3,540
- − Insurance
- −$710
- − Repairs & maintenance
- −$1,675
- − Management
- −$1,675
- − HOA
- −$4,392
- − Depreciation
- −$4,131
- Taxable loss
- −$3,134
- Est. tax savings @ 24.0%
- +$752
- After-tax cash flow
- $-280/yr
For passive investors: Depreciation is non-cash, so a rental often shows a tax loss while cash-flowing — sheltering income. Rental losses are passive: they offset passive income freely, and up to $25,000/yr can offset ordinary (W-2) income if you actively participate and your MAGI is under $100k (phasing out to $0 by $150k); unused losses carry forward. On sale, claimed depreciation is recaptured at up to 25%, and gains may owe capital-gains tax (a 1031 exchange can defer both). Figures are a year-1 estimate at your 24.0% rate — not tax advice; consult a CPA.
Schools (NCES district)
- District
- Broward
- NCES district ID
- 1200180
- Math proficiency
- 42% ▼ -18.00%
- Reading proficiency
- 53% ▼ -5.00%
- Median HH income
- $52,139
- Composite
- 40.88/100
- National rank
- #3621
- State rank
- #46 of 73 in FL
Livability — Lauderhill
- Score
- 79/100
- State rank
- #139
- US rank
- #2059
Category grades
Schools grade is shown separately in the Schools card above.
Census & demographics
- Census place
- Lauderhill, FL
- County
- Broward County · 1,963,430 people
- City population
- 62,807
- Metro
- Miami-Fort Lauderdale-Pompano Beach, FL
- Population (ZIP)
- 62,807
- Household income
- $46,305
- Rent vs Own
- Severe rent burden
- 5692.0
Population outlook (Broward County) Hauer SSP2
- Today (2025)
- 2,207,033 people
- By 2030
- 2,360,704 · +7.0%
- By 2040
- 2,661,208 · +20.6%
- By 2050
- 2,946,698 · +33.5%
- By 2075
- 3,602,273 · +63.2%
- By 2100
- 3,970,984 · +79.9%
Race, ethnicity, and origin ACS 2023
- Neighborhood character
- Predominantly Black (77%)
- Race & ethnicity
- Black 77% Hispanic / Latino 12% Two or more races 8% White 7% Asian 2%
- Hispanic origin (detail)
- Puerto Rican 2% Cuban 3% Dominican 1%
- Common ancestry
- Hispanic 20%
- Foreign-born
- 39% · Canada, Jamaica, Dominican Republic
- Languages at home
- 66% English-only · French/Haitian/Cajun 22% Spanish 10%
Political lean MEDSL · Broward
- 2024 margin
- D (+17.0) · D 58.0% · R 41.0%
- 2008→2024 swing
- -17.8pp toward R · 2008: 34.7pp · 2024: 17.0pp
- All cycles
- 2024: D+17.0 2020: D+29.8 2016: D+35.0 2012: D+34.9 2008: D+34.7
Not yet ingested
- Civics
- —
Market trends
- HPI YoY
- ▼ -338.15%
- Current HPI
- 288.9345
- Rent YoY
- ▲ 0.26%
- Metro
- Miami-Fort Lauderdale-Pompano Beach, FL
- State GDP YoY
- ▲ 3.28%
- F500 in state
- 36
Industry mix (Fortune 500 HQ in FL)
| Industry | F500 HQs | Revenue |
|---|---|---|
| Industrial Technology | 2 | $29B |
|
||
| Insurance | 2 | $17B |
|
||
| Retail | 1 | $60B |
|
||
| Technology Distribution | 1 | $58B |
|
||
| Homebuilding | 1 | $35B |
|
||
| Technology Manufacturing | 1 | $35B |
|
||
Price history
+238.1% since first listed7 events — show timeline
- 2026-03-07 Listed $142,000 MARMLS
- 2025-08-09 Rental Removed $1,400 MARMLS
- 2025-08-01 Listed for Rent $1,400 MARMLS
- 2025-04-04 Listed $250,000 MARMLS
- 2019-06-20 Sold (Public Records) $72,900 Public Records
- 1998-02-23 Sold (Public Records) $37,000 Public Records
- 1984-10-01 Sold (Public Records) $42,000 Public Records
Property tax history
+17.6%/yrLatest (2025): $3,540 · +5.2% YoY. Source: county tax records.
Cash-flow waterfall
monthlySold comps — $/sqft
last 12 mo · ≤1 miLoading sold comps…