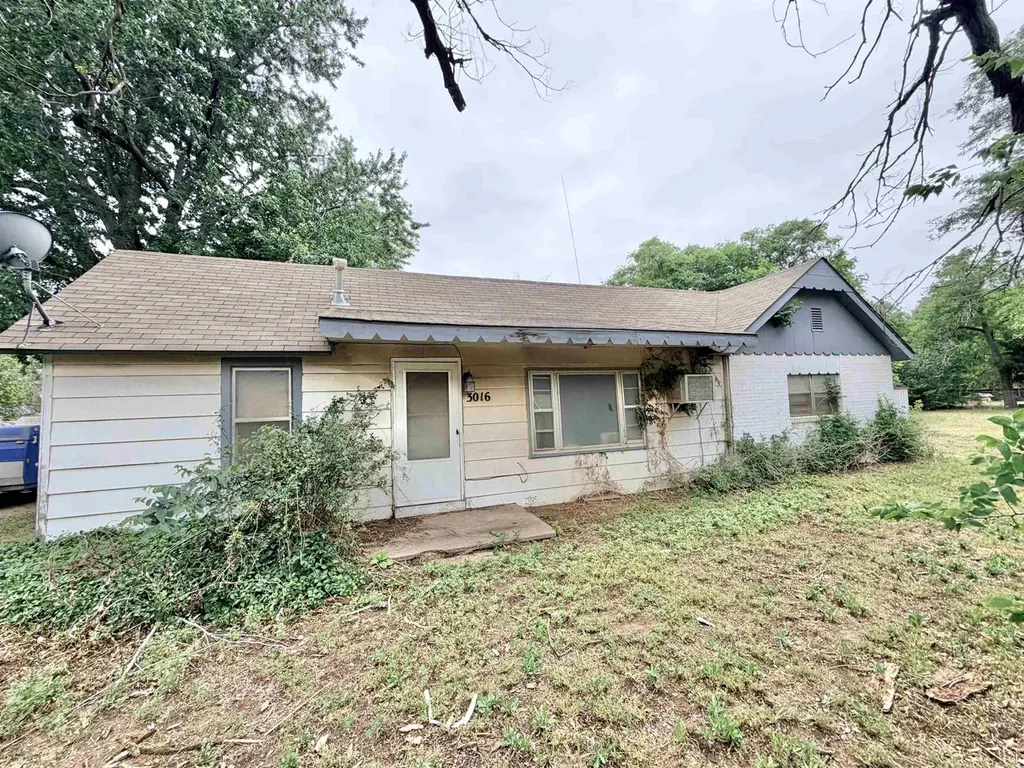
3016 N 5th St · Enid, OK
Flood risk No data
- FEMA flood zone
- —
- Chance of flooding over 30 yrs
- —
- Est. flood insurance / yr
- —
Fire risk No data
- Est. fire insurance / yr
- —
Heat risk No data
- Hot days now (above threshold)
- —
- Hot days in 30 yrs
- —
Wind risk No data
- Chance of severe wind over 30 yrs
- —
Air-quality risk No data
- Unhealthy air days now
- —
- Unhealthy air days in 30 yrs
- —
Risk factors via First Street. Map © Google.
Why this score? — see what drove the B grade
The composite is a weighted blend of 9 inputs, each scored 0–100. Each bar is that input's sub-score; the figure is the points it added to the 100-point composite (weight × sub-score).
- Cash flow +30.0/30.0
- 1% rule +10.0/10.0
- DSCR +10.0/10.0
- ARV discount +7.5/15.0
- Schools +4.8/10.0
- Rent growth +3.3/5.0
- Livability +3.2/5.0
- Condition / age +2.5/5.0
- Appreciation +0.0/10.0
$34,000
🖨 Deal sheet 📄 Offer letter ✓ Due diligence
Listing remarks
This is a great spot to build your perfect home! The home currently on the property has been gutted and recommended for tear down, but the lots. .. they are great. This property is located in Chisholm School District and ready for it's next adventure.
Key facts
- 2 garage spots
- Built 1935
- Listed 30 days
Property features AI
Finance
- Other: Located in SPALDING'S GARDENS W/2 32 subdivision; Zoned residential
Exterior
- Parking: Detached 2-car garage
- Utilities: Public water; Public sewer
- Home design: Single-family residence; Single-story
- Construction: Residential construction
- Exterior features: Composition roof; East-facing
Interior
- Bathrooms: 1 full bathroom
- Heating & cooling: Window unit cooling
- Interior features: Window cooling units
Neighborhood map
What this means for you Summary
Snapshot
- This is a 3-bed/1.0-bath single-family listed at $34k.
Deal economics
- At list price, monthly cash flow is $579 ($7k/yr) — positive.
- The deal already cash-flows at list — no discount required.
- Meets the 1% rule at list price ($1k rent vs $34k).
- Recommended offer: $33k (3.0% below list) — sets the bar for market timing.
- Cap rate 26.7% vs local median 5.0% in Enid — top-decile yield for the area; either an underpriced asset or a hidden risk that comps aren't pricing in. Stress-test before assuming the spread holds.
Location & tenants
- Location reads 63/100 on livability (#212 in OK) — a middle-class / working-renter tenant base. Strengths: cost of living A+, housing A+; Watch: employment C-, schools D-, crime F.
- Chisholm (rural): math 54% / reading 54% proficiency, ranked #3 of 270 in OK (top 1%) — acceptable for families but not a draw, mixed tenant base, ~2y average lease.
- Market conditions: Rents rising (+3.2%/yr); 79 active listings in the ZIP; 19 units permitted in Garfield County in 2024 (0 in 5+ unit buildings).
Forward outlook
- Local home prices are declining (-3.0%/yr); year-one equity from $235 of loan paydown is wiped out by about $1k of value loss. Plan a longer hold.
- Garfield County population projected at +27% by 2050 — long-run rental-demand tailwind backs the buy-and-hold thesis.
- At projected returns (-3.0% appreciation + 3.2% rent growth), your $10k cash investment doubles in ~2 years — after that, you're playing with house money.
Negotiation context
- It's been on market 31 days — a 3% lower offer ($33k) is reasonable based on typical stale-listing flexibility.
Risks & watch-outs
- Watch-outs: built in 1935 — expect roof / HVAC / electrical / plumbing capex.
Questions for the listing agent
- It's been on market 31 days. Have you received any prior offers? Is the seller open to a 3% concession, seller financing, or rate buy-down credit?
- Built in 1935 — when were the roof, HVAC, electrical panel, plumbing, and water heater last replaced?
- Is there a deadline driving the sale (1031 exchange, divorce, estate, relocation)? That informs how much negotiation room exists.
- Schools are D-rated, which usually means shorter tenancies and higher turnover. Who's the typical renter profile here, and what's been the actual vacancy rate?
- Crime grade is F in this area — have there been break-ins, vandalism, or insurance claims at this property in the last 3 years? What carrier currently insures it and at what premium?
- What's the average days-on-market for RENTAL listings here right now (not sales)? A rising rental-DOM trend means longer vacancies and softer asking-rent achievability than the comps imply.
- What's the recent tenant-quality profile in this submarket — average credit score on applications, eviction rate, late-payment / NSF rate, and stable-employment percentage? A property-management company in the area should have these aggregated.
- How much new for-sale + rental construction is in the pipeline within 1–3 miles? Heavy new supply typically softens prices + rents 12–24 months out; constrained supply supports both.
Investment metrics
- 1% rule
- 3.11% ✓
- Cap rate
- 26.73%
- Cash-on-cash
- 72.99%
- DSCR
- 4.25
- GRM
- 2.7
CMA / ARV
- ARV (on-the-fly)
- $123,970
- Comps found
- 10
Show comp detail 10 sales within ~0.75 mi
| Address | Dist | Beds/Ba | Sqft | Sold | Price | $/sf | Match |
|---|---|---|---|---|---|---|---|
| 3112 N 5th St | 0.05mi | 3/1.0 | 1,224 (+9%) | 2mo | $87,500 | $71 | 81 |
| 225 E Cottonwood Ave | 0.59mi | 3/2.0 | 1,120 (-1%) | 1mo | $99,900 | $89 | 67 |
| 2715 N Emerson St | 0.19mi | 3/1.5 | 1,080 (-4%) | 22mo | $109,000 | $101 | 64 |
| 217 E Olive Ave | 0.72mi | 3/1.0 | 1,092 (-3%) | 10mo | $129,900 | $119 | 52 |
| 1905 Mimosa Dr | 0.73mi | 2/1.5 (-1) | 1,075 (-5%) | 2mo | $63,000 | $59 | 49 |
| 92 Abby Rd | 0.61mi | 3/2.0 | 1,269 (+13%) | 5mo | $140,000 | $110 | 42 |
| 341 E Olive Ave | 0.67mi | 2/2.0 (-1) | 1,080 (-4%) | 16mo | $79,000 | $73 | 40 |
| 312 Ridgewood St | 0.74mi | 3/2.0 | 1,018 (-10%) | 7mo | $125,000 | $123 | 39 |
| 86 Abby Rd | 0.59mi | 3/2.0 | 1,289 (+14%) | 12mo | $152,000 | $118 | 35 |
| 90 Abby Rd | 0.61mi | 3/2.0 | 1,269 (+13%) | 23mo | $145,000 | $114 | 27 |
Match score weights: distance 35% · size 25% · config 20% · recency 20%. Top-matched comps best support the ARV.
Projected returns pro-forma
-3.0% appreciation · 3.16% rent growth · sell at horizon
- IRR
- 72.9%
- Equity multiple
- 4.32×
- Total profit
- $31,569
- Equity at exit
- $5,070
- IRR
- 76.8%
- Equity multiple
- 8.96×
- Total profit
- $75,794
- Equity at exit
- $2,940
Cash invested: $9,520 (down + closing). Projections, not guarantees.
Landlord ↔ Tenant lean methodology
- Overall (STATE)
- 83 Strongly Landlord-Friendly
- State Oklahoma
- 83 Strongly Landlord-Friendly · R+20
- County
- — inherits STATE
- City
- — inherits STATE
ZIP-level market 73701
- Home prices YoY
- -30.2%
- Rents YoY
- 3.2%
- Active inventory
- 79
- Price-to-rent
- 2.7×
Monthly cashflow live
- Estimated rent
- $1,056 medium interval (Pro) →
- Mortgage (P&I)
- −$178
- Tax from tax record
- −$62 /mo · $750/yr
- Insurance
- −$14
- HOA
- −$0
- Vacancy / Maint / Mgmt
- −$222
- Net cashflow
- $579
Break-even live
UW: 25.0% down · 7.5% · 30yr · 1.5% tax · 5.0% vac · 8.0% maint · 8.0% mgmt
Financing live
Cash to close
- Down payment
- $8,500
- Closing costs
- $1,020
- Reserves months
- —
- Total cash needed
- —
Loan-product check · same deal, 3 products live
Conventional
25% down · 7.5% · 30yr
- Down + closing
- —
- Monthly P&I
- —
- Monthly cashflow
- —
- DSCR
- —
- Eligible?
- —
Personal DTI + credit; lowest rate.
DSCR
20% down · 8.5% · 30yr
- Down + closing
- —
- Monthly P&I
- —
- Monthly cashflow
- —
- DSCR
- —
- Eligible?
- —
No personal income docs; deal must DSCR.
Hard money
10% down · 12.0% · 12mo
- Down + closing
- —
- Monthly P&I
- —
- Monthly cashflow
- —
- DSCR
- —
- Eligible?
- —
Short-term bridge; refi at stabilization.
Listing history 17 events
-
2026-06-19days on market $34,000 Active 31 DOM
-
2026-06-18price $34,000 Active 30 DOM
-
2026-06-18days on market $36,500 Active 30 DOM
-
2026-06-17days on market $36,500 Active 29 DOM
-
2026-06-16days on market $36,500 Active 28 DOM
-
2026-06-15days on market $36,500 Active 27 DOM
-
2026-06-14days on market $36,500 Active 25 DOM
-
2026-06-12days on market $36,500 Active 24 DOM
-
2026-06-09days on market $36,500 Active 21 DOM
-
2026-06-08days on market $36,500 Active 20 DOM
-
2026-06-07days on market $36,500 Active 19 DOM
-
2026-06-05days on market $36,500 Active 16 DOM
-
2026-06-02days on market $36,500 Active 14 DOM
-
2026-06-01days on market $36,500 Active 13 DOM
-
2026-05-31days on market $36,500 Active 12 DOM
-
2026-05-30days on market $36,500 Active 11 DOM
-
2026-05-19$36,500 Active
ⓘ Source: listings_history table (triggers on properties + properties_extension) + one-shot
backfill from property_details.listing_events for pre-trigger history.
Tax reassessment forecast OK · Resets to sale price
- Current annual tax
- $750 · $62/mo
- Projected year-2 tax
- $750 · $62/mo
- Expected delta
- $0/yr ($0/mo · 0.0%)
ⓘ Screening estimate from a state-policy table — verify with the county assessor before closing.
Nearby sold comps map
Loading sold comps map…
Walkable amenities ~0.75 mi
Loading nearby amenities…
Taxation est. · year 1
- Rental income
- $12,669
- − Mortgage interest
- −$1,905
- − Property taxes
- −$750
- − Insurance
- −$170
- − Repairs & maintenance
- −$1,013
- − Management
- −$1,013
- − Depreciation
- −$989
- Taxable income
- $6,828
- Est. tax owed @ 24.0%
- −$1,639
- After-tax cash flow
- $5,310/yr
For passive investors: Depreciation is non-cash, so a rental often shows a tax loss while cash-flowing — sheltering income. Rental losses are passive: they offset passive income freely, and up to $25,000/yr can offset ordinary (W-2) income if you actively participate and your MAGI is under $100k (phasing out to $0 by $150k); unused losses carry forward. On sale, claimed depreciation is recaptured at up to 25%, and gains may owe capital-gains tax (a 1031 exchange can defer both). Figures are a year-1 estimate at your 24.0% rate — not tax advice; consult a CPA.
Schools (NCES district)
- District
- Chisholm
- NCES district ID
- 4021780
- Math proficiency
- 54% ▼ -7.00%
- Reading proficiency
- 54% ▼ -5.00%
- Median HH income
- $66,655
- Composite
- 47.7/100
- National rank
- #2243
- State rank
- #3 of 270 in OK
Livability — Enid
- Score
- 63/100
- State rank
- #212
- US rank
- #15472
Category grades
Schools grade is shown separately in the Schools card above.
Census & demographics
- Census place
- Enid, OK
- County
- Garfield County · 55,032 people
- City population
- 55,032
- Metro
- Enid, OK
- Population (ZIP)
- 24,476
- Household income
- $50,843
- Rent vs Own
- Severe rent burden
- 576.0
Population outlook (Garfield County) Hauer SSP2
- Today (2025)
- 69,026 people
- By 2030
- 72,171 · +4.6%
- By 2040
- 79,366 · +15.0%
- By 2050
- 87,847 · +27.3%
- By 2075
- 112,714 · +63.3%
- By 2100
- 135,682 · +96.6%
Race, ethnicity, and origin ACS 2023
- Neighborhood character
- Diverse neighborhood (Simpson 0.61)
- Race & ethnicity
- White 58% Hispanic / Latino 22% Two or more races 11% Pacific Islander 10% Native American 4% Black 2%
- Hispanic origin (detail)
- Mexican 21%
- Common ancestry
- Iranian 4% Lithuanian 2% Slovak 1%
- Foreign-born
- 10% · Canada
- Languages at home
- 79% English-only · Spanish 14% Other Asian/Pacific 6%
Political lean MEDSL · Garfield
- 2024 margin
- Solid R (+53.8) · D 22.2% · R 76.0% · Other 1.8%
- 2008→2024 swing
- -2.8pp toward R · 2008: -51.0pp · 2024: -53.8pp
- All cycles
- 2024: R+53.8 2020: R+53.7 2016: R+53.5 2012: R+52.5 2008: R+51.0
Not yet ingested
- Civics
- —
Market trends
- HPI YoY
- ▼ -73.42%
- Current HPI
- 169.408
- Rent YoY
- ▲ 3.16%
- Metro
- Enid, OK
- State GDP YoY
- ▲ 1.55%
- F500 in state
- 6
Industry mix (Fortune 500 HQ in OK)
| Industry | F500 HQs | Revenue |
|---|---|---|
| Energy | 3 | $48B |
|
||
Price history
1 event — show timeline
- 2026-05-19 Listed $36,500 NWOAR
Property tax history
+44.6%/yrLatest (2025): $750 · +143.5% YoY. Source: county tax records.
Cash-flow waterfall
monthlySold comps — $/sqft
last 12 mo · ≤1 miLoading sold comps…