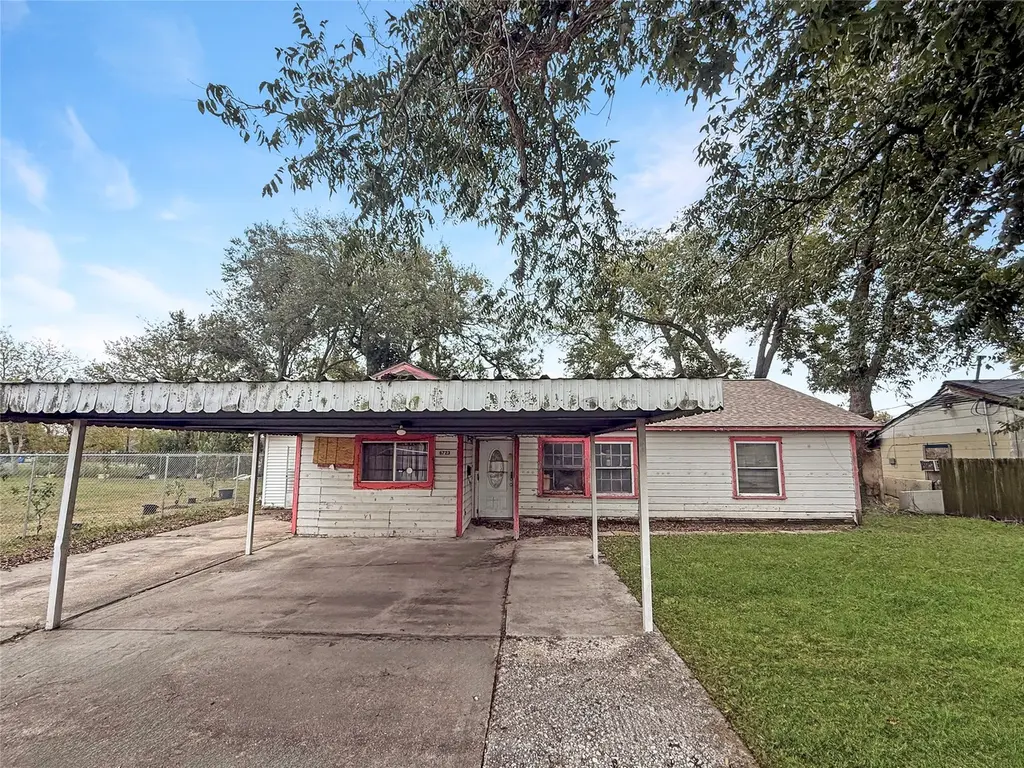
6723 London St · Houston, TX
Flood risk 3/10 · Minor
- FEMA flood zone
- X (unshaded)
- Chance of flooding over 30 yrs
- 0.1%
- Est. flood insurance / yr
- $507 – $1,088
Fire risk 1/10 · Minimal
- Est. fire insurance / yr
- $1,222 – $2,270
Heat risk 9/10 · Severe
- Hot days now (above 109°F)
- 7 days/yr
- Hot days in 30 yrs
- 24 days/yr
Wind risk 9/10 · Severe
- Chance of severe wind over 30 yrs
- 99.0%
Air-quality risk 2/10 · Minimal
- Unhealthy air days now
- 2 days/yr
- Unhealthy air days in 30 yrs
- 2 days/yr
Risk factors via First Street. Map © Google.
Why this score? — see what drove the B- grade
The composite is a weighted blend of 9 inputs, each scored 0–100. Each bar is that input's sub-score; the figure is the points it added to the 100-point composite (weight × sub-score).
- Cash flow +30.0/30.0
- 1% rule +10.0/10.0
- DSCR +10.0/10.0
- ARV discount +7.5/15.0
- Livability +3.7/5.0
- Rent growth +3.0/5.0
- Schools +2.7/10.0
- Condition / age +2.5/5.0
- Appreciation +0.0/10.0
$73,000
🖨 Deal sheet (PDF) 📄 Offer letter ✓ Due diligence
Listing remarks MLS
Welcome to this stunning 2-bedroom, 1 -bathroom home, perfectly situated in a desirable neighborhood. Outside, enjoy the beautifully yard perfect for entertaining. With convenient access to schools, shopping, and parks, this home is the perfect blend of comfort and style. To help visualize this home’s floor plan and to highlight its potential, virtual furnishings may have been added to photos found in this listing. To help visualize this homes floor plan and to highlight its potential virtual furnishings may have been added to photos found in this listing.
Key facts
- 7,501 sq ft lot
- Built 1950
- Listed 161 days
Neighborhood map
What this means for you Summary
Snapshot
- This is a 2-bed/1.0-bath single-family listed at $73k.
Deal economics
- At list price, monthly cash flow is $1k ($12k/yr) — positive.
- The deal already cash-flows at list — no discount required.
- Meets the 1% rule at list price ($2k rent vs $73k).
- Recommended offer: $64k (12.0% below list) — sets the bar for market timing.
- Cap rate 23.1% vs local median 3.2% in Houston — top-decile yield for the area; either an underpriced asset or a hidden risk that comps aren't pricing in. Stress-test before assuming the spread holds.
Location & tenants
- Location reads 74/100 on livability (#184 in TX, #4,771 nationally) — a middle-class / working-renter tenant base. Strengths: amenities A+, cost of living A+, housing A+; Watch: schools D, crime F.
- Houston ISD (urban): math 27% / reading 35% proficiency, ranked #593 of 826 in TX (top 72%) — families likely to look elsewhere, expect single-tenant / working-renter base with shorter leases; 71% free/reduced lunch — lower-income household profile, screen leases tightly.
- Market conditions: Rents rising (+2.2%/yr); 471 active listings in the ZIP; 40 comparable units currently listed for rent nearby; rentals at typical pace (median 18d on market — plan ~3-4 weeks tenant-placement turnaround); 29,883 units permitted in Harris County in 2024 (8,621 in 5+ unit buildings).
- At $2,046/mo this rent would consume 54% of the median local household income ($46k/yr) (locally 2532% of renters already pay >50% of income on rent) — very limited rent-growth headroom before tenants either downsize or default.
Forward outlook
- Local home prices are declining (-3.0%/yr); year-one equity from $505 of loan paydown is wiped out by about $2k of value loss. Plan a longer hold.
- Harris County population projected at +47% by 2050 — long-run rental-demand tailwind backs the buy-and-hold thesis.
- At projected returns (-3.0% appreciation + 2.2% rent growth), your $20k cash investment doubles in ~2 years — after that, you're playing with house money.
Negotiation context
- It's been on market 162 days — a 12% lower offer ($64k) is reasonable based on typical stale-listing flexibility.
- 2 sale attempts; this cycle's ask has dropped $28k (28%) from the opening price — seller is motivated, your offer sets the floor, not the list.
Risks & watch-outs
- Watch-outs: property tax is 3.0% of price; built in 1950 — expect roof / HVAC / electrical / plumbing capex.
- Climate carrying-cost: severe wind risk, 99% chance of damaging wind over 30y; extreme-heat days projected 7→24/yr by 2055 (HVAC capex compounding) — expect insurance premiums to compound above CPI over the hold.
Questions for the listing agent
- It's been on market 162 days. Have you received any prior offers? Is the seller open to a 12% concession, seller financing, or rate buy-down credit?
- Built in 1950 — when were the roof, HVAC, electrical panel, plumbing, and water heater last replaced?
- Property tax is high relative to price — has the assessment been appealed recently, and will the sale trigger a re-assessment?
- Why hasn't it sold? Are there any deal-killer items the seller is aware of (foundation, flood, title, zoning, code violations)?
- Is there a deadline driving the sale (1031 exchange, divorce, estate, relocation)? That informs how much negotiation room exists.
- Schools are D-rated, which usually means shorter tenancies and higher turnover. Who's the typical renter profile here, and what's been the actual vacancy rate?
- Crime grade is F in this area — have there been break-ins, vandalism, or insurance claims at this property in the last 3 years? What carrier currently insures it and at what premium?
- What's the average days-on-market for RENTAL listings here right now (not sales)? A rising rental-DOM trend means longer vacancies and softer asking-rent achievability than the comps imply.
- What's the recent tenant-quality profile in this submarket — average credit score on applications, eviction rate, late-payment / NSF rate, and stable-employment percentage? A property-management company in the area should have these aggregated.
- How much new for-sale + rental construction is in the pipeline within 1–3 miles? Heavy new supply typically softens prices + rents 12–24 months out; constrained supply supports both.
Investment metrics
- 1% rule
- 2.80% ✓
- Cap rate
- 23.08%
- Cash-on-cash
- 59.96%
- DSCR
- 3.67
- GRM
- 3.0
CMA / ARV
- ARV (median comp)
- $253,997
- List price
- $73,000
- Delta
- -71.26%
- Verdict
- UNDERPRICED
- Comps
- 20 within 1.0 mi
Show comp detail 12 sales within ~0.75 mi
| Address | Dist | Beds/Ba | Sqft | Sold | Price | $/sf | Match |
|---|---|---|---|---|---|---|---|
| 6625 Goforth St | 0.22mi | 3/1.0 (+1) | 1,489 (-3%) | 4mo | $142,000 | $95 | 76 |
| 6832 Goforth St | 0.25mi | 3/1.0 (+1) | 1,392 (-10%) | 5mo | $98,000 | $70 | 63 |
| 6906 England St | 0.37mi | 3/2.5 (+1) | 1,600 (+4%) | 4mo | $309,900 | $194 | 61 |
| 6908 England St | 0.38mi | 3/2.5 (+1) | 1,600 (+4%) | 5mo | $309,900 | $194 | 60 |
| 4211 Faulkner St | 0.46mi | 3/2.5 (+1) | 1,610 (+5%) | 3mo | $274,900 | $171 | 57 |
| 6419 Madrid St | 0.41mi | 3/2.5 (+1) | 1,693 (+10%) | 3mo | $329,900 | $195 | 50 |
| 7117 England St Unit C | 0.50mi | 3/2.5 (+1) | 1,700 (+10%) | 1mo | $340,000 | $200 | 48 |
| 6614 Sherwood Dr | 0.51mi | 3/2.0 (+1) | 1,701 (+11%) | 5mo | $149,900 | $88 | 46 |
| 7131 Eastwood St Unit C | 0.45mi | 3/2.5 (+1) | 1,700 (+10%) | 6mo | $320,000 | $188 | 46 |
| 7117 England St Unit A | 0.49mi | 3/2.5 (+1) | 1,700 (+10%) | 5mo | $359,900 | $212 | 44 |
| 7117 England St Unit B | 0.49mi | 3/2.5 (+1) | 1,700 (+10%) | 5mo | $359,900 | $212 | 44 |
| 6401 Goforth St | 0.38mi | 3/2.5 (+1) | 1,767 (+15%) | 4mo | $339,000 | $192 | 43 |
Match score weights: distance 35% · size 25% · config 20% · recency 20%. Top-matched comps best support the ARV.
Projected returns pro-forma
-3.0% appreciation · 2.17% rent growth · sell at horizon
- IRR
- 57.7%
- Equity multiple
- 3.53×
- Total profit
- $51,612
- Equity at exit
- $10,885
- IRR
- 62.3%
- Equity multiple
- 6.98×
- Total profit
- $122,217
- Equity at exit
- $6,312
Cash invested: $20,440 (down + closing). Projections, not guarantees.
Landlord ↔ Tenant lean methodology
- Overall (STATE)
- 87 Strongly Landlord-Friendly
- State Texas
- 87 Strongly Landlord-Friendly · R+5
- County
- — inherits STATE
- City
- — inherits STATE
ZIP-level market 77021
- Home prices YoY
- -23.6%
- Rents YoY
- 2.2%
- Active inventory
- 471
- Price-to-rent
- 3.0×
Monthly cashflow live
- Estimated rent
- $2,046 high interval (Pro) →
- Mortgage (P&I)
- −$383
- Tax from tax record
- −$182 /mo · $2,184/yr
- Insurance
- −$30
- HOA
- −$0
- Vacancy / Maint / Mgmt
- −$430
- Net cashflow
- $1,021
Break-even live
Sensitivity live
| Price | -10% $1,063 | -5% $1,042 | +0% $1,021 | +5% $1,001 | +10% $980 |
|---|---|---|---|---|---|
| Rent | -10% $860 | -5% $941 | +0% $1,021 | +5% $1,102 | +10% $1,183 |
| Rate | -1.0pp $1,058 | -0.5pp $1,040 | base $1,021 | +0.5pp $1,002 | +1.0pp $983 |
UW: 25.0% down · 7.5% · 30yr · 1.5% tax · 5.0% vac · 8.0% maint · 8.0% mgmt
Financing live
Cash to close
- Down payment
- $18,250
- Closing costs
- $2,190
- Reserves months
- —
- Total cash needed
- —
Loan-product check · same deal, 3 products live
Conventional
25% down · 7.5% · 30yr
- Down + closing
- —
- Monthly P&I
- —
- Monthly cashflow
- —
- DSCR
- —
- Eligible?
- —
Personal DTI + credit; lowest rate.
DSCR
20% down · 8.5% · 30yr
- Down + closing
- —
- Monthly P&I
- —
- Monthly cashflow
- —
- DSCR
- —
- Eligible?
- —
No personal income docs; deal must DSCR.
Hard money
10% down · 12.0% · 12mo
- Down + closing
- —
- Monthly P&I
- —
- Monthly cashflow
- —
- DSCR
- —
- Eligible?
- —
Short-term bridge; refi at stabilization.
Rent comps 40 comps
| Address | Beds | Baths | Sqft | Rent | $/sqft | DOM | Units | Dist |
|---|---|---|---|---|---|---|---|---|
| 6731 New York St Houston, TX | 3.0 | 3.0 | 2211 | $2,100 | $0.95 | 44d | 1 | 0.04mi |
| 4705 Idaho St Houston, TX | 3.0 | 2.5 | 1664 | $2,500 | $1.50 | 18d | 1 | 0.20mi |
| 6926 Paris St Houston, TX | 3.0 | 2.0 | 1276 | $1,900 | $1.49 | 0d | 1 | 0.22mi |
| 6928 Paris St Houston, TX | 3.0 | 2.0 | 1276 | $1,900 | $1.49 | 0d | 1 | 0.23mi |
| 6532 Weston St Unit A Houston, TX | 3.0 | 3.0 | 1484 | $2,200 | $1.48 | 19d | 1 | 0.34mi |
| 6528 Weston St Unit A Houston, TX | 3.0 | 3.0 | 1484 | $2,200 | $1.48 | 0d | 1 | 0.35mi |
| 6528 Weston St Unit A Houston, TX | 3.0 | 3.0 | 1484 | $2,200 | $1.48 | 44d | 1 | 0.35mi |
| 6809 Conley St Houston, TX | 3.0 | 4.0 | 1921 | $2,600 | $1.35 | 44d | 1 | 0.38mi |
| 4515 Dewberry St Houston, TX | 1.0 | 1.0 | 1400 | $664 | $0.47 | 21d | 1 | 0.49mi |
| 7032 Conley St Houston, TX | 3.0 | 2.0 | 1220 | $2,850 | $2.34 | 44d | 1 | 0.50mi |
| 7321 Conley St Unit B Houston, TX | 3.0 | 2.0 | 1501 | $2,025 | $1.35 | 21d | 1 | 0.73mi |
| 7321 Conley St Unit A Houston, TX | 3.0 | 2.5 | 1869 | $2,025 | $1.08 | 21d | 1 | 0.73mi |
| 5813 England St Unit A Houston, TX | 3.0 | 2.5 | 1473 | $2,195 | $1.49 | 5d | 1 | 0.84mi |
| 7358 Guadalcanal Rd Houston, TX | 3.0 | 3.0 | 1768 | $2,195 | $1.24 | 44d | 1 | 0.84mi |
| 3731 Alsace St Unit 1560804P Houston, TX | 3.0 | 2.0 | 2002 | $3,387 | $1.69 | 4d | 1 | 0.88mi |
| 5317 Chennault Rd Unit A Houston, TX | 3.0 | 2.5 | 1608 | $1,849 | $1.15 | 0d | 1 | 0.92mi |
| 3846 Seabrook St Houston, TX | 3.0 | 3.5 | 1833 | $2,300 | $1.25 | 44d | 1 | 0.92mi |
| 4530 Mayflower St Houston, TX | 3.0 | 2.0 | 1302 | $1,800 | $1.38 | 44d | 1 | 0.98mi |
| 5116 Griggs Rd Houston, TX | 3.0 | 2.0 | 1131 | $1,316 | $1.16 | 44d | 1 | 1.03mi |
| 3732 Seabrook St Houston, TX | 3.0 | 2.5 | 1727 | $2,350 | $1.36 | 25d | 1 | 1.03mi |
| 3615 Dreyfus St Houston, TX | 3.0 | 3.0 | 2011 | $2,800 | $1.39 | 44d | 1 | 1.05mi |
| 3655 Seabrook St Unit 6 Houston, TX | 2.0 | 1.0 | 1600 | $1,000 | $0.62 | 44d | 1 | 1.06mi |
| 5154 Griggs Rd Unit CAVE Houston, TX | 2.0 | 2.0 | 1322 | $1,420 | $1.07 | 4d | 1 | 1.06mi |
| 7710 Darnay Dr Houston, TX | 3.0 | 3.0 | 1635 | $2,095 | $1.28 | 44d | 1 | 1.14mi |
| 4943 Culmore Dr Houston, TX | 1.0 | 1.0 | 1700 | $651 | $0.38 | 6d | 1 | 1.19mi |
| 3560 Dixie Dr Unit 2165 Houston, TX | 2.0 | 2.0 | 1322 | $1,394 | $1.05 | 0d | 1 | 1.21mi |
| 3560 Dixie Dr Apt 422 Houston, TX | 2.0 | 2.0 | 1322 | $1,410 | $1.07 | 8d | 1 | 1.21mi |
| 3560 Dixie Dr Unit 2162 Houston, TX | 2.0 | 2.0 | 1322 | $1,410 | $1.07 | 6d | 1 | 1.21mi |
| 3560 Dixie Dr Unit 3597 Houston, TX | 2.0 | 2.0 | 1322 | $1,434 | $1.08 | 12d | 1 | 1.21mi |
| 3560 Dixie Dr Unit 3617 Houston, TX | 2.0 | 2.0 | 1322 | $1,435 | $1.09 | 44d | 1 | 1.21mi |
| 4609 Bricker St Unit C Houston, TX | 2.0 | 1.5 | 1100 | $3,200 | $2.91 | 14d | 1 | 1.21mi |
| 4609 Bricker St Unit B Houston, TX | 3.0 | 2.5 | 1300 | $3,500 | $2.69 | 14d | 1 | 1.21mi |
| 4609 Bricker St Unit ABC Houston, TX | 3.0 | 2.5 | 1375 | $3,500 | $2.55 | 12d | 1 | 1.21mi |
| 4613 Bricker St Unit B Houston, TX | 3.0 | 2.5 | 1600 | $2,300 | $1.44 | 44d | 1 | 1.22mi |
| 3644 Griggs Rd Unit 1047940P Houston, TX | 3.0 | 2.5 | 1399 | $2,161 | $1.54 | 3d | 1 | 1.22mi |
| 5835 Southmont St Houston, TX | 3.0 | 2.0 | 1200 | $1,700 | $1.42 | 44d | 1 | 1.26mi |
| 5514 Griggs Rd Unit 2187 Houston, TX | 2.0 | 2.0 | 1322 | $1,174 | $0.89 | 0d | 1 | 1.26mi |
| 5514 Griggs Rd Unit 422 Houston, TX | 2.0 | 2.0 | 1322 | $1,190 | $0.90 | 8d | 1 | 1.26mi |
| 5514 Griggs Rd Unit 5571 Houston, TX | 2.0 | 2.0 | 1322 | $1,214 | $0.92 | 12d | 1 | 1.26mi |
| 5514 Griggs Rd Unit 2165 Houston, TX | 2.0 | 2.0 | 1322 | $1,215 | $0.92 | 0d | 1 | 1.26mi |
Listing history 18 events
-
2026-06-21statusdays on market $73,000 Pending 162 DOM
-
2026-06-18days on market $73,000 Active 159 DOM
-
2026-06-17days on market $73,000 Active 158 DOM
-
2026-06-16days on market $73,000 Active 157 DOM
-
2026-06-15days on market $73,000 Active 156 DOM
-
2026-06-13days on market $73,000 Active 154 DOM
-
2026-06-10days on market $73,000 Active 150 DOM
-
2026-06-08days on market $73,000 Active 149 DOM
-
2026-06-07pricedays on market $73,000 Active 148 DOM
-
2026-06-04days on market $78,000 Active 145 DOM
-
2026-06-01days on market $78,000 Active 142 DOM
-
2026-05-31days on market $78,000 Active 141 DOM
-
2026-05-11status Active 568-char remark
Show marketing remark (568 chars)
Welcome to this stunning 2-bedroom, 1 -bathroom home, perfectly situated in a desirable neighborhood. Outside, enjoy the beautifully yard perfect for entertaining. With convenient access to schools, shopping, and parks, this home is the perfect blend of comfort and style. To help visualize this home’s floor plan and to highlight its potential, virtual furnishings may have been added to photos found in this listing. To help visualize this homes floor plan and to highlight its potential virtual furnishings may have been added to photos found in this listing.
-
2026-04-17status Pending 568-char remark
Show marketing remark (568 chars)
Welcome to this stunning 2-bedroom, 1 -bathroom home, perfectly situated in a desirable neighborhood. Outside, enjoy the beautifully yard perfect for entertaining. With convenient access to schools, shopping, and parks, this home is the perfect blend of comfort and style. To help visualize this home’s floor plan and to highlight its potential, virtual furnishings may have been added to photos found in this listing. To help visualize this homes floor plan and to highlight its potential virtual furnishings may have been added to photos found in this listing.
-
2026-04-10status Pending 568-char remark
Show marketing remark (568 chars)
Welcome to this stunning 2-bedroom, 1 -bathroom home, perfectly situated in a desirable neighborhood. Outside, enjoy the beautifully yard perfect for entertaining. With convenient access to schools, shopping, and parks, this home is the perfect blend of comfort and style. To help visualize this home’s floor plan and to highlight its potential, virtual furnishings may have been added to photos found in this listing. To help visualize this homes floor plan and to highlight its potential virtual furnishings may have been added to photos found in this listing.
-
2026-01-21price $95,950 568-char remark
Show marketing remark (568 chars)
Welcome to this stunning 2-bedroom, 1 -bathroom home, perfectly situated in a desirable neighborhood. Outside, enjoy the beautifully yard perfect for entertaining. With convenient access to schools, shopping, and parks, this home is the perfect blend of comfort and style. To help visualize this home’s floor plan and to highlight its potential, virtual furnishings may have been added to photos found in this listing. To help visualize this homes floor plan and to highlight its potential virtual furnishings may have been added to photos found in this listing.
-
2025-12-17$101,000 Active 568-char remark
Show marketing remark (568 chars)
Welcome to this stunning 2-bedroom, 1 -bathroom home, perfectly situated in a desirable neighborhood. Outside, enjoy the beautifully yard perfect for entertaining. With convenient access to schools, shopping, and parks, this home is the perfect blend of comfort and style. To help visualize this home’s floor plan and to highlight its potential, virtual furnishings may have been added to photos found in this listing. To help visualize this homes floor plan and to highlight its potential virtual furnishings may have been added to photos found in this listing.
-
1989-05-08soldstatus
ⓘ Source: listings_history table (triggers on properties + properties_extension) + one-shot
backfill from property_details.listing_events for pre-trigger history.
Tax reassessment forecast TX · Resets to sale price
- Current annual tax
- $2,184 · $182/mo
- Projected year-2 tax
- $2,184 · $182/mo
- Expected delta
- $0/yr ($0/mo · 0.0%)
ⓘ Screening estimate from a state-policy table — verify with the county assessor before closing.
Climate risk First Street
- Flood 3/10 Moderate FEMA zone X (unshaded) · 10% chance over 30 yrs
- Wildfire 1/10 Low
- Heat 9/10 Extreme 7 d/yr ≥109°F today · 24 d/yr by 30 yrs out
- Wind 9/10 Extreme 99% chance of damaging wind over 30 yrs
- Air quality 2/10 Low 2 unhealthy d/yr today · 2 by 30 yrs out
Nearby sold comps map
Loading sold comps map…
Walkable amenities ~0.75 mi
Loading nearby amenities…
Taxation est. · year 1
- Rental income
- $24,555
- − Mortgage interest
- −$4,089
- − Property taxes
- −$2,184
- − Insurance
- −$365
- − Repairs & maintenance
- −$1,964
- − Management
- −$1,964
- − Depreciation
- −$2,124
- Taxable income
- $11,865
- Est. tax owed @ 24.0%
- −$2,848
- After-tax cash flow
- $9,409/yr
For passive investors: Depreciation is non-cash, so a rental often shows a tax loss while cash-flowing — sheltering income. Rental losses are passive: they offset passive income freely, and up to $25,000/yr can offset ordinary (W-2) income if you actively participate and your MAGI is under $100k (phasing out to $0 by $150k); unused losses carry forward. On sale, claimed depreciation is recaptured at up to 25%, and gains may owe capital-gains tax (a 1031 exchange can defer both). Figures are a year-1 estimate at your 24.0% rate — not tax advice; consult a CPA.
Schools (NCES district)
- District
- Houston ISD
- NCES district ID
- 4823640
- Math proficiency
- 27% ▼ -18.00%
- Reading proficiency
- 35% ▼ -6.00%
- Median HH income
- $46,054
- Composite
- 26.63/100
- National rank
- #7173
- State rank
- #593 of 826 in TX
Livability — Houston
- Score
- 74/100
- State rank
- #184
- US rank
- #4771
Category grades
Schools grade is shown separately in the Schools card above.
Census & demographics
- Census place
- Houston, TX
- County
- Harris County · 4,702,590 people
- City population
- 3,226,434
- Metro
- Houston-The Woodlands-Sugar Land, TX
- Population (ZIP)
- 26,153
- Household income
- $45,574
- Rent vs Own
- Severe rent burden
- 2532.0
Population outlook (Harris County) Hauer SSP2
- Today (2025)
- 5,571,493 people
- By 2030
- 6,089,821 · +9.3%
- By 2040
- 7,142,806 · +28.2%
- By 2050
- 8,185,864 · +46.9%
- By 2075
- 10,574,329 · +89.8%
- By 2100
- 12,109,958 · +117.4%
Race, ethnicity, and origin ACS 2023
- Neighborhood character
- Diverse neighborhood (Simpson 0.55)
- Race & ethnicity
- Black 62% Hispanic / Latino 22% Two or more races 12% White 10% Asian 2%
- Hispanic origin (detail)
- Mexican 15%
- Common ancestry
- Italian 1% Romanian 1% Lithuanian 1%
- Foreign-born
- 11% · Canada
- Languages at home
- 77% English-only · Spanish 19% French/Haitian/Cajun 1% Other Indo-European 1%
Political lean MEDSL · Harris
- 2024 margin
- Lean D (+5.5) · D 52.0% · R 46.4% · Other 1.6%
- 2008→2024 swing
- +3.9pp toward D · 2008: 1.6pp · 2024: 5.5pp
- All cycles
- 2024: D+5.5 2020: D+13.3 2016: D+12.4 2012: D+0.1 2008: D+1.6
Not yet ingested
- Civics
- —
Market trends
- HPI YoY
- ▼ -71.22%
- Current HPI
- 230.2869
- Rent YoY
- ▲ 2.17%
- Metro
- Houston-The Woodlands-Sugar Land, TX
- State GDP YoY
- ▲ 3.95%
- F500 in state
- 110
Industry mix (Fortune 500 HQ in TX)
| Industry | F500 HQs | Revenue |
|---|---|---|
| Energy | 16 | $1,198B |
|
||
| Technology | 5 | $198B |
|
||
| Engineering / Construction | 4 | $72B |
|
||
| Energy Services | 3 | $60B |
|
||
| Utilities | 3 | $41B |
|
||
| Healthcare | 2 | $330B |
|
||
Price history
-5.0% since first listed6 events — show timeline
- 2026-05-11 Relisted — HARMLS
- 2026-04-17 Pending — HARMLS
- 2026-04-10 Pending — HARMLS
- 2026-01-21 Price Changed $95,950 HARMLS
- 2025-12-17 Listed $101,000 HARMLS
- 1989-05-08 Sold (Public Records) — Public Records
Property tax history
+7.3%/yrLatest (2025): $2,184 · +11.7% YoY. Source: county tax records.
Cash-flow waterfall
monthlySold comps — $/sqft
last 12 mo · ≤1 miLoading sold comps…