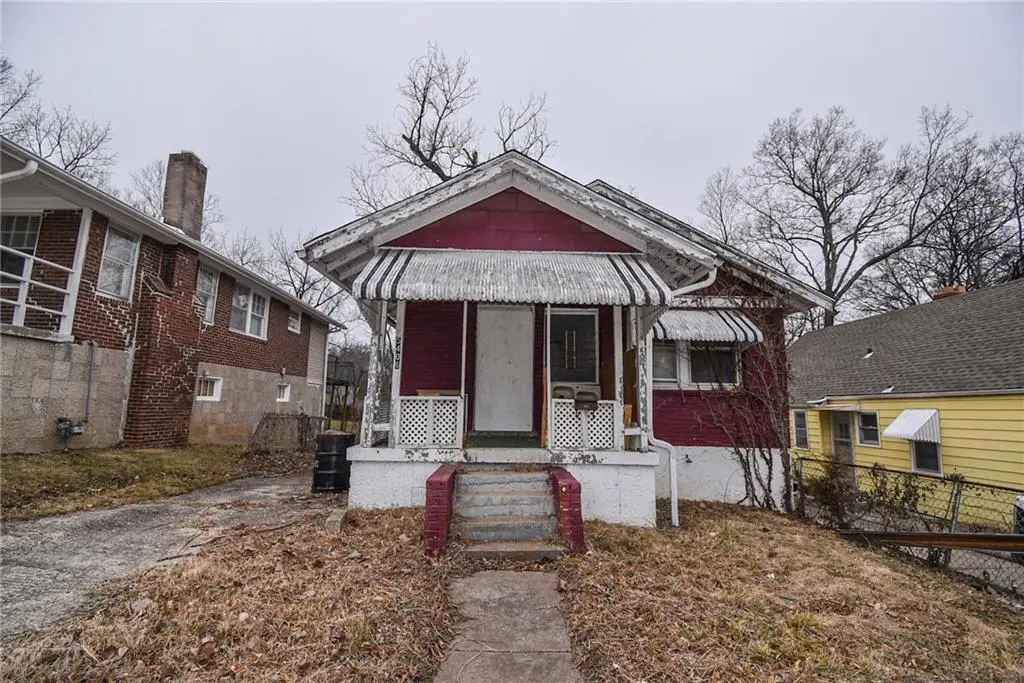
5406 Jackson Ave · Kansas City, MO
Flood risk 1/10 · Minimal
- FEMA flood zone
- X (unshaded)
- Chance of flooding over 30 yrs
- 0.0%
- Est. flood insurance / yr
- $473 – $860
Fire risk 1/10 · Minimal
- Est. fire insurance / yr
- $1,054 – $1,958
Heat risk 4/10 · Minor
- Hot days now (above 107°F)
- 7 days/yr
- Hot days in 30 yrs
- 17 days/yr
Wind risk 2/10 · Minimal
- Chance of severe wind over 30 yrs
- —
Air-quality risk 3/10 · Minor
- Unhealthy air days now
- 3 days/yr
- Unhealthy air days in 30 yrs
- 5 days/yr
Risk factors via First Street. Map © Google.
Why this score? — see what drove the B- grade
The composite is a weighted blend of 9 inputs, each scored 0–100. Each bar is that input's sub-score; the figure is the points it added to the 100-point composite (weight × sub-score).
- Cash flow +30.0/30.0
- 1% rule +10.0/10.0
- DSCR +10.0/10.0
- ARV discount +7.5/15.0
- Livability +3.9/5.0
- Rent growth +3.6/5.0
- Condition / age +2.5/5.0
- Schools +1.5/10.0
- Appreciation +0.0/10.0
$30,000
🖨 Deal sheet 📄 Offer letter ✓ Due diligence
Listing remarks MLS
Bring your contractors to this spacious ranch in South Kansas City. Walk up the front steps onto the patio and enter into the large living room with a brick fireplace. To the right you'll find two bedrooms and the full bathroom as well as a linen closet. Further into the home is a kitchen with adjacent dining area. The third bedroom is to the right of the dining area in the back of the home. There is a small porch in the back of the home that is currently inaccessible. The large unfinished basement has lots of potential.
Key facts
- Brick fireplace
- Unfinished basement
- Large living room
Tags
Neighborhood map
What this means for you Summary
Snapshot
- This is a 2-bed/1.0-bath single-family listed at $30k.
Deal economics
- At list price, monthly cash flow is $773 ($9k/yr) — positive.
- The deal already cash-flows at list — no discount required.
- Meets the 1% rule at list price ($1k rent vs $30k).
- Recommended offer: $29k (3.0% below list) — sets the bar for market timing.
- Cap rate 37.2% vs local median 3.9% in Kansas City — top-decile yield for the area; either an underpriced asset or a hidden risk that comps aren't pricing in. Stress-test before assuming the spread holds.
Location & tenants
- Location reads 78/100 on livability (#28 in MO, #2,671 nationally) — a middle-class / working-renter tenant base. Strengths: amenities A+, commute A+, cost of living A+; Watch: schools C-, crime F.
- Kansas City 33 (urban): math 12% / reading 24% proficiency, ranked #308 of 324 in MO (top 95%) — low school quality limits family demand, transient renter base, plan for 1-2y turnover; 75% free/reduced lunch — lower-income household profile, screen leases tightly.
- Market conditions: Rents rising fast (+4.4%/yr); 187 active listings in the ZIP; 35 comparable units currently listed for rent nearby; rentals at typical pace (median 24d on market — plan ~3-4 weeks tenant-placement turnaround); 46% of comp listings sitting > 30 days — soft ceiling on asking rent; lower-income renter base — watch delinquency; 4,002 units permitted in Jackson County in 2024 (2,271 in 5+ unit buildings).
- This rent runs 35% of the median local income ($42k/yr) — at the standard rent-burdened threshold; future hikes will face affordability resistance.
Forward outlook
- Local home prices are declining (-3.0%/yr); year-one equity from $207 of loan paydown is wiped out by about $900 of value loss. Plan a longer hold.
- Jackson County population projected at +4% by 2050 — modest demand growth; plan on rents tracking national, not racing it.
- At projected returns (-3.0% appreciation + 4.4% rent growth), your $8k cash investment doubles in ~1 year — after that, you're playing with house money.
Negotiation context
- It's been on market 51 days — a 3% lower offer ($29k) is reasonable based on typical stale-listing flexibility.
- 4 sale attempts since 2y ago with the ask held roughly flat each time — persistent listings suggest the price (not the market) is what's stuck; bring a comps-based counter.
Risks & watch-outs
- Watch-outs: built in 1926 — expect roof / HVAC / electrical / plumbing capex.
Questions for the listing agent
- It's been on market 51 days. Have you received any prior offers? Is the seller open to a 3% concession, seller financing, or rate buy-down credit?
- Built in 1926 — when were the roof, HVAC, electrical panel, plumbing, and water heater last replaced?
- Is there a deadline driving the sale (1031 exchange, divorce, estate, relocation)? That informs how much negotiation room exists.
- Crime grade is F in this area — have there been break-ins, vandalism, or insurance claims at this property in the last 3 years? What carrier currently insures it and at what premium?
- What's the average days-on-market for RENTAL listings here right now (not sales)? A rising rental-DOM trend means longer vacancies and softer asking-rent achievability than the comps imply.
- What's the recent tenant-quality profile in this submarket — average credit score on applications, eviction rate, late-payment / NSF rate, and stable-employment percentage? A property-management company in the area should have these aggregated.
- How much new for-sale + rental construction is in the pipeline within 1–3 miles? Heavy new supply typically softens prices + rents 12–24 months out; constrained supply supports both.
Investment metrics
- 1% rule
- 4.14% ✓
- Cap rate
- 37.21%
- Cash-on-cash
- 110.42%
- DSCR
- 5.91
- GRM
- 2.0
CMA / ARV
- ARV (median comp)
- $121,957
- List price
- $30,000
- Delta
- -75.40%
- Verdict
- UNDERPRICED
- Comps
- 20 within 1.0 mi
Show comp detail 12 sales within ~0.75 mi
| Address | Dist | Beds/Ba | Sqft | Sold | Price | $/sf | Match |
|---|---|---|---|---|---|---|---|
| 5260 Cypress Ave | 0.25mi | 3/1.0 (+1) | 1,052 (-5%) | 0mo | $115,000 | $109 | 75 |
| 3819 E 53rd Ter | 0.19mi | 3/2.0 (+1) | 1,103 (-0%) | 13mo | $124,000 | $112 | 71 |
| 4226 E 54th St | 0.10mi | 2/1.0 | 1,200 (+8%) | 14mo | $90,000 | $75 | 70 |
| 5255 Spruce Ave | 0.25mi | 3/1.5 (+1) | 1,056 (-4%) | 10mo | $145,000 | $137 | 66 |
| 4401 E 54th Ter | 0.16mi | 3/1.0 (+1) | 984 (-11%) | 10mo | $89,999 | $91 | 61 |
| 5227 Franklin Dr | 0.31mi | 2/1.5 | 1,244 (+12%) | 13mo | $139,000 | $112 | 52 |
| 5707 Swope Pkwy | 0.42mi | 3/1.0 (+1) | 992 (-10%) | 10mo | $127,500 | $129 | 50 |
| 5725 Bales Ave | 0.59mi | 3/2.0 (+1) | 1,026 (-7%) | 12mo | $84,999 | $83 | 42 |
| 3815 E 58th St | 0.52mi | 3/1.0 (+1) | 976 (-12%) | 16mo | $64,500 | $66 | 38 |
| 5833 Jackson Ave | 0.56mi | 3/1.0 (+1) | 941 (-15%) | 10mo | $69,999 | $74 | 36 |
| 3005 E 54th St | 0.72mi | 2/1.0 | 1,239 (+12%) | 15mo | $95,000 | $77 | 34 |
| 2921 E 54th St | 0.74mi | 2/1.5 | 1,242 (+12%) | 11mo | $67,000 | $54 | 33 |
Match score weights: distance 35% · size 25% · config 20% · recency 20%. Top-matched comps best support the ARV.
Projected returns pro-forma
-3.0% appreciation · 4.42% rent growth · sell at horizon
- IRR
- —
- Equity multiple
- 6.50×
- Total profit
- $46,186
- Equity at exit
- $4,473
- IRR
- —
- Equity multiple
- 14.25×
- Total profit
- $111,280
- Equity at exit
- $2,594
Cash invested: $8,400 (down + closing). Projections, not guarantees.
Landlord ↔ Tenant lean methodology
- Overall (STATE)
- 81 Strongly Landlord-Friendly
- State Missouri
- 81 Strongly Landlord-Friendly · R+10
- County
- — inherits STATE
- City
- — inherits STATE
ZIP-level market 64130
- Home prices YoY
- -21.5%
- Rents YoY
- 4.4%
- Active inventory
- 187
- Price-to-rent
- 2.0×
Monthly cashflow live
- Estimated rent
- $1,241 high interval (Pro) →
- Mortgage (P&I)
- −$157
- Tax est. 1.5%
- −$38 /mo · $450/yr
- Insurance
- −$12
- HOA
- −$0
- Vacancy / Maint / Mgmt
- −$261
- Net cashflow
- $773
Break-even live
UW: 25.0% down · 7.5% · 30yr · 1.5% tax · 5.0% vac · 8.0% maint · 8.0% mgmt
Financing live
Cash to close
- Down payment
- $7,500
- Closing costs
- $900
- Reserves months
- —
- Total cash needed
- —
Loan-product check · same deal, 3 products live
Conventional
25% down · 7.5% · 30yr
- Down + closing
- —
- Monthly P&I
- —
- Monthly cashflow
- —
- DSCR
- —
- Eligible?
- —
Personal DTI + credit; lowest rate.
DSCR
20% down · 8.5% · 30yr
- Down + closing
- —
- Monthly P&I
- —
- Monthly cashflow
- —
- DSCR
- —
- Eligible?
- —
No personal income docs; deal must DSCR.
Hard money
10% down · 12.0% · 12mo
- Down + closing
- —
- Monthly P&I
- —
- Monthly cashflow
- —
- DSCR
- —
- Eligible?
- —
Short-term bridge; refi at stabilization.
Rent comps 35 comps
| Address | Beds | Baths | Sqft | Rent | $/sqft | DOM | Units | Dist |
|---|---|---|---|---|---|---|---|---|
| 3600 E 57th St Kansas City, MO | 3.0 | 1.0 | 1037 | $1,250 | $1.21 | 43d | 1 | 0.49mi |
| 3821 E 58th St Kansas City, MO | 3.0 | 1.5 | 1153 | $1,350 | $1.17 | 16d | 1 | 0.49mi |
| 3949 Doctor Martin Luther King Junior Blvd Kansas City, MO | 1.0–2.0 | 1.0–2.0 | 945 | $1,565 | $1.66 | 1d | 3 | 0.53mi |
| 5614 Indiana Ave Kansas City, MO | 3.0 | 1.0 | 900 | $1,175 | $1.31 | 43d | 1 | 0.55mi |
| 3617 E 58th St Unit 2 Kansas City, MO | 2.0 | 1.0 | 936 | $875 | $0.93 | 43d | 1 | 0.55mi |
| 3615 E 58th St Unit 1 Kansas City, MO | 2.0 | 1.0 | 936 | $875 | $0.93 | 43d | 1 | 0.55mi |
| 5709 Bales Ave Kansas City, MO | 2.0 | 1.0 | 782 | $1,095 | $1.40 | 23d | 1 | 0.56mi |
| 3861 E 60th St Kansas City, MO | 3.0 | 2.0 | 1491 | $1,250 | $0.84 | 2d | 1 | 0.71mi |
| 4250 E 60 Ter Unit 4250 Kansas City, MO | 2.0 | 1.0 | 783 | $895 | $1.14 | 23d | 1 | 0.75mi |
| 4935 College Ave Kansas City, MO | 3.0 | 1.0 | 1216 | $1,350 | $1.11 | 23d | 1 | 0.79mi |
| 4211 E 61st St Kansas City, MO | 2.0 | 1.5 | 1220 | $1,500 | $1.23 | 43d | 1 | 0.86mi |
| 3604 E 61st St Unit 3604 Kansas City, MO | 3.0 | 1.0 | 875 | $1,300 | $1.49 | 43d | 1 | 0.88mi |
| 6029 Indiana Ave Kansas City, MO | 2.0 | 1.0 | 832 | $1,150 | $1.38 | 43d | 1 | 0.90mi |
| 5013 S Benton Ave Kansas City, MO | 3.0 | 1.0 | 978 | $1,225 | $1.25 | 23d | 1 | 0.93mi |
| 4917 S Benton Ave Kansas City, MO | 2.0 | 1.0 | 1000 | $1,100 | $1.10 | 23d | 1 | 1.00mi |
| 4911 S Benton Ave Kansas City, MO | 2.0 | 1.0 | 1000 | $1,100 | $1.10 | 16d | 1 | 1.00mi |
| 5801 Wabash Ave Kansas City, MO | 3.0 | 1.0 | 1200 | $1,200 | $1.00 | 43d | 1 | 1.12mi |
| 2420 E 51st St Kansas City, MO | 3.0 | 2.0 | 1460 | $1,350 | $0.92 | 23d | 1 | 1.13mi |
| 2512 E 59th St Kansas City, MO | 2.0 | 1.0 | 750 | $1,150 | $1.53 | 43d | 1 | 1.16mi |
| 5824 Wabash Ave Kansas City, MO | 3.0 | 1.0 | 1276 | $1,050 | $0.82 | 43d | 1 | 1.17mi |
| 5114 Brooklyn Ave Kansas City, MO | 3.0 | 1.5 | 1116 | $1,300 | $1.16 | 7d | 1 | 1.30mi |
| 4930 Park Ave Kansas City, MO | 3.0 | 1.0 | 900 | $1,300 | $1.44 | 16d | 1 | 1.32mi |
| 5531 Euclid Ave Kansas City, MO | 3.0 | 1.0 | 1135 | $1,300 | $1.15 | 43d | 1 | 1.35mi |
| 2205 E 59th St Kansas City, MO | 2.0 | 1.0 | 724 | $1,025 | $1.42 | 16d | 1 | 1.35mi |
| 2100 E 58th St Kansas City, MO | 2.0 | 1.0 | 1030 | $1,500 | $1.46 | 43d | 1 | 1.35mi |
| 4534 S Benton Ave Kansas City, MO | 2.0 | 1.0 | 912 | $1,045 | $1.15 | 16d | 1 | 1.36mi |
| 5410 Euclid Ave Kansas City, MO | 3.0 | 2.0 | 1119 | $1,395 | $1.25 | 43d | 1 | 1.37mi |
| 5730 Garfield Ave Kansas City, MO | 3.0 | 1.0 | 866 | $1,195 | $1.38 | 16d | 1 | 1.38mi |
| 5529 Michigan Ave Kansas City, MO | 2.0 | 1.0 | 847 | $995 | $1.17 | 43d | 1 | 1.41mi |
| 5241 Brookwood Ave Kansas City, MO | 3.0 | 2.0 | 1431 | $1,550 | $1.08 | 43d | 1 | 1.41mi |
| 4427 Agnes Ave Kansas City, MO | 3.0 | 1.0 | 1100 | $1,350 | $1.23 | 16d | 1 | 1.42mi |
| 5430 Michigan Ave Kansas City, MO | 2.0 | 1.0 | 1250 | $1,495 | $1.20 | 43d | 1 | 1.43mi |
| 6431 S Benton Ave Kansas City, MO | 3.0 | 1.0 | 1160 | $1,225 | $1.06 | 23d | 1 | 1.47mi |
| 4309 College Ave Kansas City, MO | 3.0 | 2.0 | 1040 | $1,550 | $1.49 | 16d | 1 | 1.49mi |
| 5524 Woodland Ave Kansas City, MO | 3.0 | 1.0 | 1243 | $1,095 | $0.88 | 23d | 1 | 1.50mi |
Listing history 17 events
-
2026-06-07statusdays on market $30,000 Pending 51 DOM
-
2026-06-05days on market $30,000 Active 50 DOM
-
2026-06-03days on market $30,000 Active 49 DOM
-
2026-06-02days on market $30,000 Active 48 DOM
-
2026-06-01days on market $30,000 Active 47 DOM
-
2026-05-31days on market $30,000 Active 46 DOM
-
2026-04-15$30,000 Active 526-char remark
Show marketing remark (526 chars)
Bring your contractors to this spacious ranch in South Kansas City. Walk up the front steps onto the patio and enter into the large living room with a brick fireplace. To the right you'll find two bedrooms and the full bathroom as well as a linen closet. Further into the home is a kitchen with adjacent dining area. The third bedroom is to the right of the dining area in the back of the home. There is a small porch in the back of the home that is currently inaccessible. The large unfinished basement has lots of potential.
-
2026-03-31historical
-
2026-03-06price $30,000
-
2026-01-06status Active
-
2025-03-22status Pending
-
2025-01-29price $35,000
-
2025-01-14status Active
-
2025-01-10historical Active Under Contract
-
2024-12-24$45,000 Active
-
2006-12-19soldstatus
-
1995-05-11soldstatus
ⓘ Source: listings_history table (triggers on properties + properties_extension) + one-shot
backfill from property_details.listing_events for pre-trigger history.
Climate risk First Street
- Flood 1/10 Low FEMA zone X (unshaded) · 0% chance over 30 yrs
- Wildfire 1/10 Low
- Heat 4/10 Moderate 7 d/yr ≥107°F today · 17 d/yr by 30 yrs out
- Wind 2/10 Low
- Air quality 3/10 Moderate 3 unhealthy d/yr today · 5 by 30 yrs out
Nearby sold comps map
Loading sold comps map…
Walkable amenities ~0.75 mi
Loading nearby amenities…
Taxation est. · year 1
- Rental income
- $14,890
- − Mortgage interest
- −$1,680
- − Property taxes
- −$450
- − Insurance
- −$150
- − Repairs & maintenance
- −$1,191
- − Management
- −$1,191
- − Depreciation
- −$873
- Taxable income
- $9,355
- Est. tax owed @ 24.0%
- −$2,245
- After-tax cash flow
- $7,030/yr
For passive investors: Depreciation is non-cash, so a rental often shows a tax loss while cash-flowing — sheltering income. Rental losses are passive: they offset passive income freely, and up to $25,000/yr can offset ordinary (W-2) income if you actively participate and your MAGI is under $100k (phasing out to $0 by $150k); unused losses carry forward. On sale, claimed depreciation is recaptured at up to 25%, and gains may owe capital-gains tax (a 1031 exchange can defer both). Figures are a year-1 estimate at your 24.0% rate — not tax advice; consult a CPA.
Schools (NCES district)
- District
- Kansas City 33
- NCES district ID
- 2916400
- Math proficiency
- 12% ▼ -8.00%
- Reading proficiency
- 24% ▬ 0.00%
- Median HH income
- $35,227
- Composite
- 14.8/100
- National rank
- #9387
- State rank
- #308 of 324 in MO
Livability — Kansas City
- Score
- 78/100
- State rank
- #28
- US rank
- #2671
Category grades
Schools grade is shown separately in the Schools card above.
Census & demographics
- Census place
- Kansas City, MO
- County
- Jackson County · 687,798 people
- City population
- 439,467
- Metro
- Kansas City, MO-KS
- Population (ZIP)
- 19,644
- Household income
- $42,221
- Rent vs Own
- Severe rent burden
- 1132.0
Population outlook (Jackson County) Hauer SSP2
- Today (2025)
- 719,589 people
- By 2030
- 731,456 · +1.6%
- By 2040
- 746,689 · +3.8%
- By 2050
- 749,289 · +4.1%
- By 2075
- 736,227 · +2.3%
- By 2100
- 668,210 · -7.1%
Race, ethnicity, and origin ACS 2023
- Neighborhood character
- Predominantly Black (80%)
- Race & ethnicity
- Black 80% White 9% Hispanic / Latino 8% Two or more races 6%
- Hispanic origin (detail)
- Mexican 5%
- Common ancestry
- Lithuanian 1% Swedish 0%
- Foreign-born
- 6% · Canada
- Languages at home
- 92% English-only · Spanish 7%
Political lean MEDSL · Jackson
- 2024 margin
- D (+19.3) · D 58.9% · R 39.5% · Other 1.6%
- 2008→2024 swing
- -6.1pp toward R · 2008: 25.4pp · 2024: 19.3pp
- All cycles
- 2024: D+19.3 2020: D+22.0 2016: D+16.6 2012: D+19.0 2008: D+25.4
Not yet ingested
- Civics
- —
Market trends
- HPI YoY
- ▼ -73.32%
- Current HPI
- 267.491
- Rent YoY
- ▲ 4.42%
- Metro
- Kansas City, MO-KS
- State GDP YoY
- ▲ 1.84%
- F500 in state
- 20
Industry mix (Fortune 500 HQ in MO)
| Industry | F500 HQs | Revenue |
|---|---|---|
| Healthcare | 1 | $163B |
|
||
| Insurance | 1 | $21B |
|
||
| Industrial Technology | 1 | $17B |
|
||
| Retail | 1 | $16B |
|
||
| Industrial Distribution | 1 | $10B |
|
||
| Utilities | 1 | $9B |
|
||
Price history
-33.3% since first listed11 events — show timeline
- 2026-04-15 Listed $30,000 Heartland MLS as Distributed by MLS Grid
- 2026-03-31 Listing Removed — Heartland MLS as Distributed by MLS Grid
- 2026-03-06 Price Changed $30,000 Heartland MLS as Distributed by MLS Grid
- 2026-01-06 Relisted — Heartland MLS as Distributed by MLS Grid
- 2025-03-22 Pending — Heartland MLS as Distributed by MLS Grid
- 2025-01-29 Price Changed $35,000 Heartland MLS as Distributed by MLS Grid
- 2025-01-14 Relisted — Heartland MLS as Distributed by MLS Grid
- 2025-01-10 Contingent — Heartland MLS as Distributed by MLS Grid
- 2024-12-24 Listed $45,000 Heartland MLS as Distributed by MLS Grid
- 2006-12-19 Sold (Public Records) — Public Records
- 1995-05-11 Sold (Public Records) — Public Records
Property tax history
+31.0%/yrLatest (2025): $5,323 · +956.5% YoY. Source: county tax records.
Cash-flow waterfall
monthlySold comps — $/sqft
last 12 mo · ≤1 miLoading sold comps…