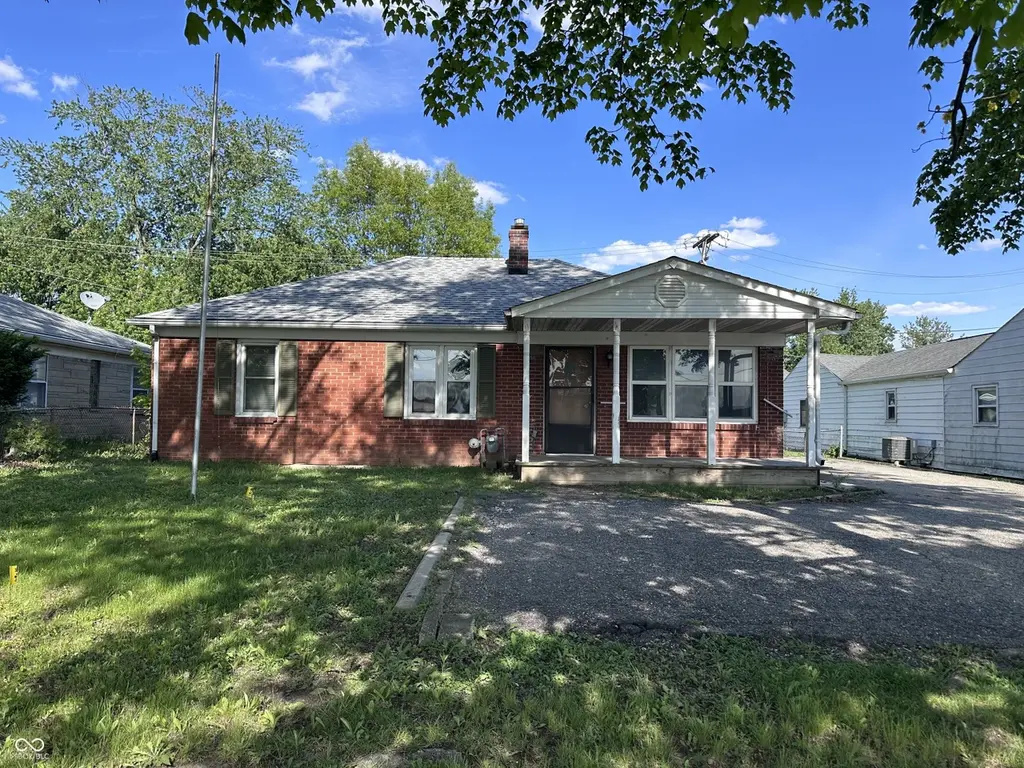
3125 N Avon Ave · Avon, IN
Flood risk 1/10 · Minimal
- FEMA flood zone
- X (unshaded)
- Chance of flooding over 30 yrs
- 0.0%
- Est. flood insurance / yr
- $473 – $860
Fire risk 1/10 · Minimal
- Est. fire insurance / yr
- $717 – $1,331
Heat risk 3/10 · Minor
- Hot days now (above 101°F)
- 7 days/yr
- Hot days in 30 yrs
- 19 days/yr
Wind risk 2/10 · Minimal
- Chance of severe wind over 30 yrs
- 0.0%
Air-quality risk 2/10 · Minimal
- Unhealthy air days now
- 1 days/yr
- Unhealthy air days in 30 yrs
- 2 days/yr
Risk factors via First Street. Map © Google.
Why this score? — see what drove the B- grade
The composite is a weighted blend of 9 inputs, each scored 0–100. Each bar is that input's sub-score; the figure is the points it added to the 100-point composite (weight × sub-score).
- Cash flow +29.3/30.0
- DSCR +10.0/10.0
- 1% rule +8.2/10.0
- ARV discount +7.5/15.0
- Schools +4.7/10.0
- Livability +3.7/5.0
- Rent growth +3.2/5.0
- Condition / age +2.2/5.0
- Appreciation +0.0/10.0
$160,000
🖨 Deal sheet 📄 Offer letter ✓ Due diligence
Listing remarks
Rare opportunity in a high-demand area! Ideal for a fix & flip or short-term rental with strong upside potential. Features include an all-brick exterior, newer roof, and hardwood floors believed to be under the carpet. Great opportunity to add value and build equity.
Key facts
- Newer roof
- Hardwood floors
- All-brick exterior
Tags
Property features AI
Exterior
- Utilities: Municipal sewer connection; Private water source
- Home design: Single-family residence; One-story layout
- Construction: Brick construction; Block foundation
- Exterior features: Lot under 1/4 acre (approximately 0.21 acre)
Interior
- Kitchen: Kitchen on the main level
- Bedrooms: Three bedrooms on the main level
- Flooring: Carpet in living room
- Bathrooms: One full bathroom on the main level
- Heating & cooling: Forced air heating (natural gas); Central air conditioning
- Interior features: Finished basement; Refrigerator included
Neighborhood map
What this means for you Summary
Snapshot
- This is a 3-bed/1.0-bath single-family listed at $160k. Condition is rated fair.
Deal economics
- At list price, monthly cash flow is $564 ($7k/yr) — positive.
- The deal already cash-flows at list — no discount required.
- Meets the 1% rule at list price ($2k rent vs $160k).
- Cap rate 10.5% vs local median 3.8% in Avon — top-decile yield for the area; either an underpriced asset or a hidden risk that comps aren't pricing in. Stress-test before assuming the spread holds.
Location & tenants
- Location reads 74/100 on livability (#75 in IN, #4,686 nationally) — a middle-class / working-renter tenant base. Strengths: employment A+, cost of living A+, housing A+; Watch: amenities F, commute F.
- Avon Community School Corporation (suburban): math 51% / reading 53% proficiency, ranked #32 of 301 in IN (top 11%) — acceptable for families but not a draw, mixed tenant base, ~2y average lease; only 20% free/reduced lunch — higher-income household profile.
- Market conditions: Rents rising (+3.0%/yr); 380 active listings in the ZIP; 2 comparable units currently listed for rent nearby; solid renter incomes; 1,294 units permitted in Hendricks County in 2024 (18 in 5+ unit buildings).
Forward outlook
- Local home prices are declining (-3.0%/yr); year-one equity from $1k of loan paydown is wiped out by about $5k of value loss. Plan a longer hold.
- Hendricks County population projected at +35% by 2050 — long-run rental-demand tailwind backs the buy-and-hold thesis.
- At projected returns (-3.0% appreciation + 3.0% rent growth), your $45k cash investment doubles in ~8 years — after that, you're playing with house money.
Negotiation context
- Only 3 days on market — expect competitive offers; lowballing is unlikely to land.
Risks & watch-outs
- Watch-outs: built in 1952 — expect roof / HVAC / electrical / plumbing capex.
Questions for the listing agent
- Have any recent inspections been done? Can we get a copy of the seller's disclosures and any deferred-maintenance estimates?
- Built in 1952 — when were the roof, HVAC, electrical panel, plumbing, and water heater last replaced?
- Is there a deadline driving the sale (1031 exchange, divorce, estate, relocation)? That informs how much negotiation room exists.
- Schools are A-rated — typically a magnet for longer-tenancy family renters. What's the average tenant stay here, and is there a school-zone premium baked into asking?
- What's the average days-on-market for RENTAL listings here right now (not sales)? A rising rental-DOM trend means longer vacancies and softer asking-rent achievability than the comps imply.
- What's the recent tenant-quality profile in this submarket — average credit score on applications, eviction rate, late-payment / NSF rate, and stable-employment percentage? A property-management company in the area should have these aggregated.
- How much new for-sale + rental construction is in the pipeline within 1–3 miles? Heavy new supply typically softens prices + rents 12–24 months out; constrained supply supports both.
Investment metrics
- 1% rule
- 1.32% ✓
- Cap rate
- 10.52%
- Cash-on-cash
- 15.10%
- DSCR
- 1.67
- GRM
- 6.3
CMA / ARV
- ARV (on-the-fly)
- $344,448
- Comps found
- 12
Show comp detail 12 sales within ~0.75 mi
| Address | Dist | Beds/Ba | Sqft | Sold | Price | $/sf | Match |
|---|---|---|---|---|---|---|---|
| 63 N Avon Ave | 0.00mi | 3/1.0 | 1,872 (0%) | 0mo | $150,000 | $80 | 99 |
| 116 S Avon Ave | 0.18mi | 3/1.0 | 1,728 (-8%) | 15mo | $150,000 | $87 | 66 |
| 792 Abundance Ln | 0.73mi | 3/2.0 | 1,902 (+2%) | 1mo | $359,900 | $189 | 59 |
| 636 Hamlet Dr | 0.64mi | 3/2.0 | 1,987 (+6%) | 2mo | $385,000 | $194 | 54 |
| 249 Meadow Glen Dr | 0.50mi | 3/2.5 | 1,644 (-12%) | 1mo | $308,000 | $187 | 50 |
| 6879 Juliet Dr | 0.63mi | 3/2.5 | 1,998 (+7%) | 4mo | $340,500 | $170 | 50 |
| 678 Harvest Ridge Dr | 0.69mi | 3/2.0 | 1,785 (-5%) | 8mo | $362,000 | $203 | 49 |
| 662 Harvest Ridge Dr | 0.68mi | 3/2.0 | 1,781 (-5%) | 9mo | $355,000 | $199 | 49 |
| 603 Raintree Dr | 0.70mi | 3/2.5 | 1,890 (+1%) | 13mo | $348,000 | $184 | 48 |
| 6896 Maywood Cir | 0.74mi | 3/2.0 | 1,850 (-1%) | 14mo | $272,500 | $147 | 47 |
| 620 Hamlet Dr | 0.62mi | 4/2.5 (+1) | 2,041 (+9%) | 3mo | $355,000 | $174 | 43 |
| 595 Macbeth Dr | 0.57mi | 2/2.0 (-1) | 1,713 (-8%) | 16mo | $305,000 | $178 | 37 |
Match score weights: distance 35% · size 25% · config 20% · recency 20%. Top-matched comps best support the ARV.
Projected returns pro-forma
-3.0% appreciation · 2.98% rent growth · sell at horizon
- IRR
- 5.7%
- Equity multiple
- 1.22×
- Total profit
- $9,959
- Equity at exit
- $23,857
- IRR
- 15.1%
- Equity multiple
- 2.22×
- Total profit
- $54,850
- Equity at exit
- $13,834
Cash invested: $44,800 (down + closing). Projections, not guarantees.
Landlord ↔ Tenant lean methodology
- Overall (STATE)
- 90 Strongly Landlord-Friendly
- State Indiana
- 90 Strongly Landlord-Friendly · R+11
- County
- — inherits STATE
- City
- — inherits STATE
ZIP-level market 46123
- Home prices YoY
- -21.3%
- Rents YoY
- 3.0%
- Active inventory
- 380
- Price-to-rent
- 6.3×
Monthly cashflow live
- Estimated rent
- $2,113 medium interval (Pro) →
- Mortgage (P&I)
- −$839
- Tax est. 1.5%
- −$200 /mo · $2,400/yr
- Insurance
- −$67
- HOA
- −$0
- Vacancy / Maint / Mgmt
- −$444
- Net cashflow
- $564
Break-even live
UW: 25.0% down · 7.5% · 30yr · 1.5% tax · 5.0% vac · 8.0% maint · 8.0% mgmt
Financing live
Cash to close
- Down payment
- $40,000
- Closing costs
- $4,800
- Reserves months
- —
- Total cash needed
- —
Loan-product check · same deal, 3 products live
Conventional
25% down · 7.5% · 30yr
- Down + closing
- —
- Monthly P&I
- —
- Monthly cashflow
- —
- DSCR
- —
- Eligible?
- —
Personal DTI + credit; lowest rate.
DSCR
20% down · 8.5% · 30yr
- Down + closing
- —
- Monthly P&I
- —
- Monthly cashflow
- —
- DSCR
- —
- Eligible?
- —
No personal income docs; deal must DSCR.
Hard money
10% down · 12.0% · 12mo
- Down + closing
- —
- Monthly P&I
- —
- Monthly cashflow
- —
- DSCR
- —
- Eligible?
- —
Short-term bridge; refi at stabilization.
Rent comps 2 comps
| Address | Beds | Baths | Sqft | Rent | $/sqft | DOM | Units | Dist |
|---|---|---|---|---|---|---|---|---|
| 8335 Eagles Nest Dr Avon, IN | 3.0 | 2.0 | 1410 | $1,830 | $1.30 | 23d | 1 | 1.42mi |
| 7147 Governors Row Avon, IN | 3.0 | 3.5 | 2130 | $1,999 | $0.94 | 43d | 1 | 1.48mi |
Listing history 2 events
-
2026-05-14status Pending
-
2026-05-10$160,000 Active
ⓘ Source: listings_history table (triggers on properties + properties_extension) + one-shot
backfill from property_details.listing_events for pre-trigger history.
Climate risk First Street
- Flood 1/10 Low FEMA zone X (unshaded) · 0% chance over 30 yrs
- Wildfire 1/10 Low
- Heat 3/10 Moderate 7 d/yr ≥101°F today · 19 d/yr by 30 yrs out
- Wind 2/10 Low 0% chance of damaging wind over 30 yrs
- Air quality 2/10 Low 1 unhealthy d/yr today · 2 by 30 yrs out
Nearby sold comps map
Loading sold comps map…
Walkable amenities ~0.75 mi
Loading nearby amenities…
Taxation est. · year 1
- Rental income
- $25,357
- − Mortgage interest
- −$8,962
- − Property taxes
- −$2,400
- − Insurance
- −$800
- − Repairs & maintenance
- −$2,029
- − Management
- −$2,029
- − Depreciation
- −$4,655
- Taxable income
- $4,483
- Est. tax owed @ 24.0%
- −$1,076
- After-tax cash flow
- $5,687/yr
For passive investors: Depreciation is non-cash, so a rental often shows a tax loss while cash-flowing — sheltering income. Rental losses are passive: they offset passive income freely, and up to $25,000/yr can offset ordinary (W-2) income if you actively participate and your MAGI is under $100k (phasing out to $0 by $150k); unused losses carry forward. On sale, claimed depreciation is recaptured at up to 25%, and gains may owe capital-gains tax (a 1031 exchange can defer both). Figures are a year-1 estimate at your 24.0% rate — not tax advice; consult a CPA.
Condition & rehab AI · 9 photos
This property presents a moderate renovation opportunity with significant potential for value increase through kitchen and bathroom updates, interior painting, and HVAC maintenance.
Repairs flagged
- Major kitchen cabinets — Severe wear and tear
- Major kitchen appliances — Outdated and worn
- Major bathroom carpet — Severe wear and tear
- Major bathroom fixtures — Outdated and worn
- Major interior walls — Peeling paint
Value-add opportunities
- Both New kitchen cabinets and appliances — Modernizes the kitchen and adds value
- Both New bathroom fixtures and carpet — Modernizes the bathroom and adds value
- Both Paint interior walls — Fresh paint enhances curb appeal and interior aesthetics
- Both HVAC system maintenance — Ensures system is running efficiently and adds value
Renovation cost estimate screening
| Repair item | Severity | Est. cost |
|---|---|---|
| kitchen cabinets · Severe wear and tear | Major | $15,000–50,000 |
| kitchen appliances · Outdated and worn | Major | $15,000–50,000 |
| bathroom carpet · Severe wear and tear | Major | $15,000–50,000 |
| bathroom fixtures · Outdated and worn | Major | $15,000–50,000 |
| interior walls · Peeling paint | Major | $15,000–50,000 |
| Total estimated repair cost · 5 items | $75,000–250,000 |
Value-add ROI direction
- Both New kitchen cabinets and appliances — Modernizes the kitchen and adds value ↑
- Both New bathroom fixtures and carpet — Modernizes the bathroom and adds value ↑
- Both Paint interior walls — Fresh paint enhances curb appeal and interior aesthetics ↑
- Both HVAC system maintenance — Ensures system is running efficiently and adds value ↑
ⓘ Cost ranges are severity-bucket heuristics (US national rule-of-thumb). Get contractor quotes + a written scope before underwriting a rehab budget.
Schools (NCES district)
- District
- Avon Community School Corporation
- NCES district ID
- 1800270
- Math proficiency
- 51% ▼ -8.00%
- Reading proficiency
- 53% ▼ -8.00%
- Median HH income
- $75,987
- Composite
- 46.93/100
- National rank
- #2362
- State rank
- #32 of 301 in IN
Livability — Avon
- Score
- 74/100
- State rank
- #75
- US rank
- #4686
Category grades
Schools grade is shown separately in the Schools card above.
Census & demographics
- Census place
- Avon, IN
- County
- Hendricks County · 143,373 people
- City population
- 43,353
- Metro
- Indianapolis-Carmel-Anderson, IN
- Population (ZIP)
- 43,353
- Household income
- $103,485
- Rent vs Own
- Severe rent burden
- 529.0
Population outlook (Hendricks County) Hauer SSP2
- Today (2025)
- 187,418 people
- By 2030
- 201,494 · +7.5%
- By 2040
- 228,487 · +21.9%
- By 2050
- 253,068 · +35.0%
- By 2075
- 308,920 · +64.8%
- By 2100
- 336,510 · +79.6%
Race, ethnicity, and origin ACS 2023
- Neighborhood character
- Predominantly White (74%)
- Race & ethnicity
- White 74% Black 12% Hispanic / Latino 7% Two or more races 6% Asian 4%
- Hispanic origin (detail)
- Mexican 2%
- Common ancestry
- Slovak 3% Romanian 2% Italian 1%
- Foreign-born
- 6% · Canada, South Korea
- Languages at home
- 92% English-only · Spanish 4% Other Indo-European 2%
Political lean MEDSL · Hendricks
- 2024 margin
- Strong R (+21.5) · D 38.4% · R 59.9% · Other 1.7%
- 2008→2024 swing
- +1.9pp toward D · 2008: -23.4pp · 2024: -21.5pp
- All cycles
- 2024: R+21.5 2020: R+23.9 2016: R+34.2 2012: R+34.9 2008: R+23.4
Not yet ingested
- Civics
- —
Market trends
- HPI YoY
- ▼ -55.05%
- Current HPI
- 203.9226
- Rent YoY
- ▲ 2.98%
- Metro
- Indianapolis-Carmel-Anderson, IN
- State GDP YoY
- ▲ 2.90%
- F500 in state
- 18
Industry mix (Fortune 500 HQ in IN)
| Industry | F500 HQs | Revenue |
|---|---|---|
| Industrial Machinery | 2 | $37B |
|
||
| Healthcare | 1 | $177B |
|
||
| Pharmaceuticals | 1 | $45B |
|
||
| Metals / Steel | 1 | $18B |
|
||
| Agriculture | 1 | $17B |
|
||
| Packaging | 1 | $12B |
|
||
Price history
2 events — show timeline
- 2026-05-14 Pending — MIBOR as Distributed by MLS Grid
- 2026-05-10 Listed $160,000 MIBOR as Distributed by MLS Grid
Cash-flow waterfall
monthlySold comps — $/sqft
last 12 mo · ≤1 miLoading sold comps…