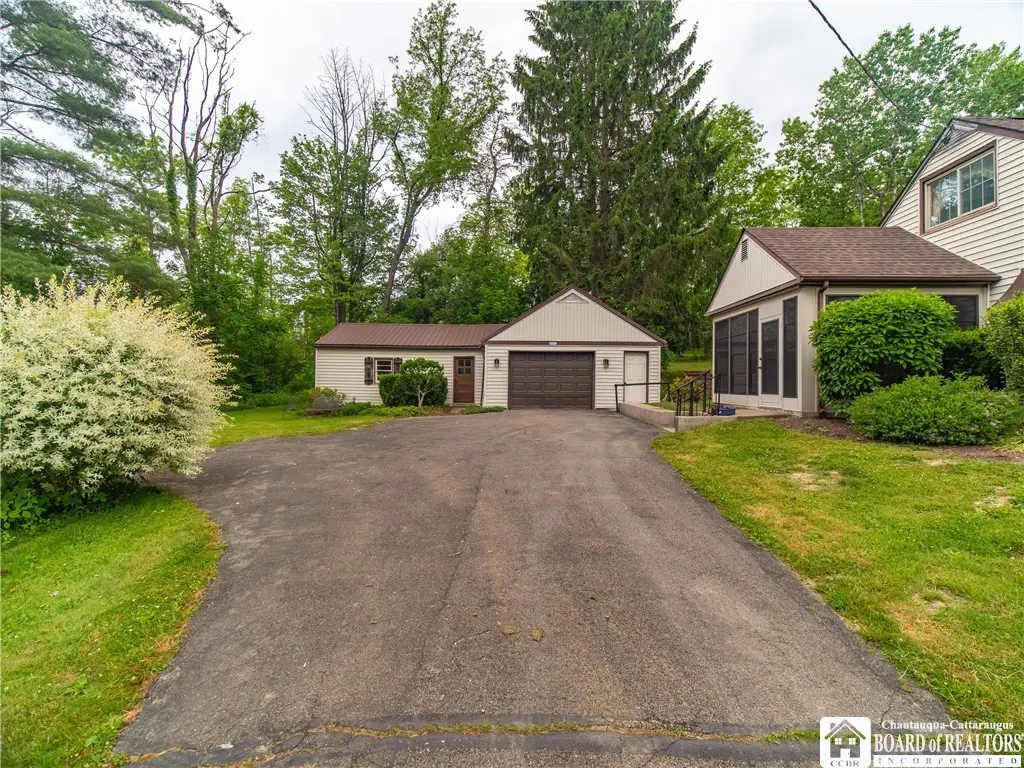
3467 Belleview Rd · Lakewood, NY
Flood risk 1/10 · Minimal
- FEMA flood zone
- X
- Chance of flooding over 30 yrs
- 0.0%
- Est. flood insurance / yr
- $473 – $860
Fire risk 1/10 · Minimal
- Est. fire insurance / yr
- $691 – $1,283
Heat risk 1/10 · Minimal
- Hot days now (above 91°F)
- 7 days/yr
- Hot days in 30 yrs
- 17 days/yr
Wind risk 1/10 · Minimal
- Chance of severe wind over 30 yrs
- —
Air-quality risk 2/10 · Minimal
- Unhealthy air days now
- 0 days/yr
- Unhealthy air days in 30 yrs
- 1 days/yr
Risk factors via First Street. Map © Google.
Why this score? — see what drove the D grade
The composite is a weighted blend of 9 inputs, each scored 0–100. Each bar is that input's sub-score; the figure is the points it added to the 100-point composite (weight × sub-score).
- Appreciation +10.0/10.0
- ARV discount +7.5/15.0
- Cash flow +7.4/30.0
- Schools +5.5/10.0
- Livability +3.6/5.0
- Rent growth +2.5/5.0
- Condition / age +2.5/5.0
- 1% rule +2.2/10.0
- DSCR +1.5/10.0
$258,500
🖨 Deal sheet (PDF) 📄 Offer letter ✓ Due diligence
Listing remarks
First time ever offered! Located in the Bemus Point School District, this well-loved Cape Cod was built in 1958 by the seller's father and has remained in the family ever since. Full of character and potential, the home features a spacious three-season Florida room with a beautiful maple wood ceiling, an eat-in kitchen with sliding glass doors leading to a side deck, and a large living room highlighted by a wood beam ceiling and electric fireplace. The main floor offers two bedrooms and a full bath, while the second floor includes two additional bedrooms and a convenient half bath. Hardwood floors are believed to be under the dining room carpet, and ample storage can be found throughout the
Key facts
- Maple wood ceiling
- Eat in kitchen
- Sliding glass doors
Tags
Neighborhood map
What this means for you Summary
Snapshot
- This is a 3-bed/1.5-bath single-family listed at $258k.
Deal economics
- At list price, monthly cash flow is $-333 ($-4k/yr) — negative.
- To cash-flow at today's rent, offer at most $200k (22.7% below list).
- To meet the 1% rule (rent ≥ 1% of price), the offer needs to be $185k (28.5% below list).
- Recommended offer: $185k (28.5% below list) — sets the bar for 1% rule.
- Cap rate 4.7% vs local median 3.0% in Lakewood — top-decile yield for the area; either an underpriced asset or a hidden risk that comps aren't pricing in. Stress-test before assuming the spread holds.
Location & tenants
- Location reads 71/100 on livability (#398 in NY) — a middle-class / working-renter tenant base. Strengths: cost of living A+, housing A+, health & safety A+; Watch: employment D+, amenities F, commute F.
- Bemus Point Central School District (rural): math 65% / reading 61% proficiency, ranked #238 of 755 in NY (top 32%) — acceptable for families but not a draw, mixed tenant base, ~2y average lease; only 18% free/reduced lunch — higher-income household profile.
- Zoned schools: Bemus Point Elementary School (math 57% / reading 57%, grade C+, #842 of 2,108 statewide, top 43%, 283 students, 35% FRL); Maple Grove Junior/Senior High School (math 57% / reading 52%, grade C-, #912 of 1,100 statewide, top 85%, 319 students, 30% FRL).
- Market conditions: 47 active listings in the ZIP; 127 units permitted in Chautauqua County in 2024 (0 in 5+ unit buildings).
Forward outlook
- In year one you build about $28k of equity ($2k loan paydown + $26k appreciation (10.0% local appreciation)).
- Chautauqua County population projected at -22% by 2050 — secular population decline; favor cash flow + early exit over multi-decade hold.
- By year 2, paydown + projected appreciation supports a ~$44k cash-out refi (75% LTV) — recoverable capital for the next deal without selling this one.
Negotiation context
- Only 11 days on market — expect competitive offers; lowballing is unlikely to land.
Risks & watch-outs
- Watch-outs: built in 1958 — expect roof / HVAC / electrical / plumbing capex.
Questions for the listing agent
- What do current leases actually rent for vs. the listed asking? Can we see a recent rent roll and the last 12 months of T-12 income?
- Built in 1958 — when were the roof, HVAC, electrical panel, plumbing, and water heater last replaced?
- Is there a deadline driving the sale (1031 exchange, divorce, estate, relocation)? That informs how much negotiation room exists.
- Schools are D-rated, which usually means shorter tenancies and higher turnover. Who's the typical renter profile here, and what's been the actual vacancy rate?
- The area grade is low — what's the realistic commute time and amenity access for the typical tenant pool here? Any planned neighborhood developments (good or bad) we should know about?
- What's the average days-on-market for RENTAL listings here right now (not sales)? A rising rental-DOM trend means longer vacancies and softer asking-rent achievability than the comps imply.
- What's the recent tenant-quality profile in this submarket — average credit score on applications, eviction rate, late-payment / NSF rate, and stable-employment percentage? A property-management company in the area should have these aggregated.
- How much new for-sale + rental construction is in the pipeline within 1–3 miles? Heavy new supply typically softens prices + rents 12–24 months out; constrained supply supports both.
Investment metrics
- 1% rule
- 0.72% ✗
- Cap rate
- 4.75%
- Cash-on-cash
- -5.52%
- DSCR
- 0.75
- GRM
- 11.6
CMA / ARV
No comps found within radius.
Projected returns pro-forma
10.0% appreciation · 3.0% rent growth · sell at horizon
- IRR
- 20.4%
- Equity multiple
- 2.65×
- Total profit
- $119,621
- Equity at exit
- $232,877
- IRR
- 18.6%
- Equity multiple
- 6.10×
- Total profit
- $368,998
- Equity at exit
- $502,209
Cash invested: $72,380 (down + closing). Projections, not guarantees.
Landlord ↔ Tenant lean methodology
- Overall (STATE)
- 15 Strongly Tenant-Friendly
- State New York
- 15 Strongly Tenant-Friendly · D+10
- County
- — inherits STATE
- City
- — inherits STATE
ZIP-level market 14712
- Home prices YoY
- 15.3%
- Active inventory
- 47
- Price-to-rent
- 11.6×
Monthly cashflow live
- Estimated rent
- $1,849 medium interval (Pro) →
- Mortgage (P&I)
- −$1,356
- Tax from tax record
- −$331 /mo · $3,967/yr
- Insurance
- −$108
- HOA
- −$0
- Vacancy / Maint / Mgmt
- −$388
- Net cashflow
- $-333
Break-even live
Sensitivity live
| Price | -10% $-186 | -5% $-260 | +0% $-333 | +5% $-406 | +10% $-479 |
|---|---|---|---|---|---|
| Rent | -10% $-479 | -5% $-406 | +0% $-333 | +5% $-260 | +10% $-187 |
| Rate | -1.0pp $-203 | -0.5pp $-267 | base $-333 | +0.5pp $-400 | +1.0pp $-468 |
UW: 25.0% down · 7.5% · 30yr · 1.5% tax · 5.0% vac · 8.0% maint · 8.0% mgmt
Financing live
Cash to close
- Down payment
- $64,625
- Closing costs
- $7,755
- Reserves months
- —
- Total cash needed
- —
Loan-product check · same deal, 3 products live
Conventional
25% down · 7.5% · 30yr
- Down + closing
- —
- Monthly P&I
- —
- Monthly cashflow
- —
- DSCR
- —
- Eligible?
- —
Personal DTI + credit; lowest rate.
DSCR
20% down · 8.5% · 30yr
- Down + closing
- —
- Monthly P&I
- —
- Monthly cashflow
- —
- DSCR
- —
- Eligible?
- —
No personal income docs; deal must DSCR.
Hard money
10% down · 12.0% · 12mo
- Down + closing
- —
- Monthly P&I
- —
- Monthly cashflow
- —
- DSCR
- —
- Eligible?
- —
Short-term bridge; refi at stabilization.
Listing history 23 events
-
2026-06-21days on market $258,500 Active 11 DOM
-
2026-06-19days on market $258,500 Active 9 DOM
-
2026-06-18days on market $258,500 Active 8 DOM
-
2026-06-17days on market $258,500 Active 7 DOM
-
2026-06-16days on market $258,500 Active 6 DOM
-
2026-06-15days on market $258,500 Active 5 DOM
-
2026-06-14days on market $258,500 Active 3 DOM
-
2026-06-12days on market $258,500 Active 2 DOM
-
2026-06-08days on market $258,500 Active 194 DOM
-
2026-06-07days on market $258,500 Active 193 DOM
-
2026-06-05remarks 699-char remark
-
2026-06-05pricestatusdays on market $258,500 Active 190 DOM
-
2026-06-03days on market $259,000 Active Under Contract 189 DOM
-
2026-06-02days on market $259,000 Active Under Contract 188 DOM
-
2026-06-01days on market $259,000 Active Under Contract 187 DOM
-
2026-05-31days on market $259,000 Active Under Contract 186 DOM
-
2026-05-30days on market $259,000 Active Under Contract 185 DOM
-
2026-04-27status Pending
-
2026-03-30price $259,000
-
2026-02-10price $279,000
-
2026-01-05price $299,000
-
2025-11-08price $325,000
-
2025-10-28$349,900 Active
ⓘ Source: listings_history table (triggers on properties + properties_extension) + one-shot
backfill from property_details.listing_events for pre-trigger history.
Tax reassessment forecast NY · Partial reset (capped growth)
- Current annual tax
- $3,967 · $331/mo
- Projected year-2 tax
- $4,168 · $347/mo
- Expected delta
- +$201/yr (+$17/mo · 5.1%)
ⓘ Screening estimate from a state-policy table — verify with the county assessor before closing.
Climate risk First Street
- Flood 1/10 Low FEMA zone X · 0% chance over 30 yrs
- Wildfire 1/10 Low
- Heat 1/10 Low 7 d/yr ≥91°F today · 17 d/yr by 30 yrs out
- Wind 1/10 Low
- Air quality 2/10 Low 0 unhealthy d/yr today · 1 by 30 yrs out
Nearby sold comps map
Loading sold comps map…
Walkable amenities ~0.75 mi
Loading nearby amenities…
Taxation est. · year 1
- Rental income
- $22,193
- − Mortgage interest
- −$14,480
- − Property taxes
- −$3,967
- − Insurance
- −$1,292
- − Repairs & maintenance
- −$1,775
- − Management
- −$1,775
- − Depreciation
- −$7,520
- Taxable loss
- −$8,617
- Est. tax savings @ 24.0%
- +$2,068
- After-tax cash flow
- $-1,926/yr
For passive investors: Depreciation is non-cash, so a rental often shows a tax loss while cash-flowing — sheltering income. Rental losses are passive: they offset passive income freely, and up to $25,000/yr can offset ordinary (W-2) income if you actively participate and your MAGI is under $100k (phasing out to $0 by $150k); unused losses carry forward. On sale, claimed depreciation is recaptured at up to 25%, and gains may owe capital-gains tax (a 1031 exchange can defer both). Figures are a year-1 estimate at your 24.0% rate — not tax advice; consult a CPA.
Schools (NCES district)
- District
- Bemus Point Central School District
- NCES district ID
- 3604530
- Math proficiency
- 65% ▼ -4.00%
- Reading proficiency
- 61% ▼ -9.00%
- Median HH income
- $50,968
- Composite
- 55.15/100
- National rank
- #2753
- State rank
- #238 of 755 in NY
Livability — Lakewood
- Score
- 71/100
- State rank
- #398
- US rank
- #6904
Category grades
Schools grade is shown separately in the Schools card above.
Census & demographics
- Population (ZIP)
- 3,079
Population outlook (Chautauqua County) Hauer SSP2
- Today (2025)
- 123,454 people
- By 2030
- 118,509 · -4.0%
- By 2040
- 107,311 · -13.1%
- By 2050
- 96,703 · -21.7%
- By 2075
- 76,757 · -37.8%
- By 2100
- 60,984 · -50.6%
Race, ethnicity, and origin ACS 2023
- Neighborhood character
- Predominantly White (95%)
- Race & ethnicity
- White 95% Two or more races 3% Hispanic / Latino 2%
- Common ancestry
- Iranian 3% Romanian 3% Slovak 3%
- Foreign-born
- 1% · Canada
- Languages at home
- 98% English-only · German/W. Germanic 1% Spanish 1%
Political lean MEDSL · Chautauqua
- 2024 margin
- Strong R (+22.0) · D 39.0% · R 61.0%
- 2008→2024 swing
- -22.9pp toward R · 2008: 0.9pp · 2024: -22.0pp
- All cycles
- 2024: R+22.0 2020: R+19.8 2016: R+24.6 2012: R+8.2 2008: D+0.9
Not yet ingested
- Civics
- —
Market trends
- HPI YoY
- ▲ 48.79%
- Current HPI
- 368.206
- Rent YoY
- —
- Metro
- —
- State GDP YoY
- ▲ 2.60%
- F500 in state
- 92
Industry mix (Fortune 500 HQ in NY)
| Industry | F500 HQs | Revenue |
|---|---|---|
| Financial Services | 10 | $950B |
|
||
| Consumer Goods | 9 | $162B |
|
||
| Insurance | 4 | $225B |
|
||
| Telecommunications | 2 | $144B |
|
||
| Pharmaceuticals | 2 | $112B |
|
||
| Media / Entertainment | 2 | $69B |
|
||
Price history
-26.0% since first listed6 events — show timeline
- 2026-04-27 Pending — UNYREIS
- 2026-03-30 Price Changed $259,000 UNYREIS
- 2026-02-10 Price Changed $279,000 UNYREIS
- 2026-01-05 Price Changed $299,000 UNYREIS
- 2025-11-08 Price Changed $325,000 UNYREIS
- 2025-10-28 Listed $349,900 UNYREIS
Property tax history
-0.6%/yrLatest (2025): $3,967 · +0.4% YoY. Source: county tax records.
Cash-flow waterfall
monthlySold comps — $/sqft
last 12 mo · ≤1 miLoading sold comps…