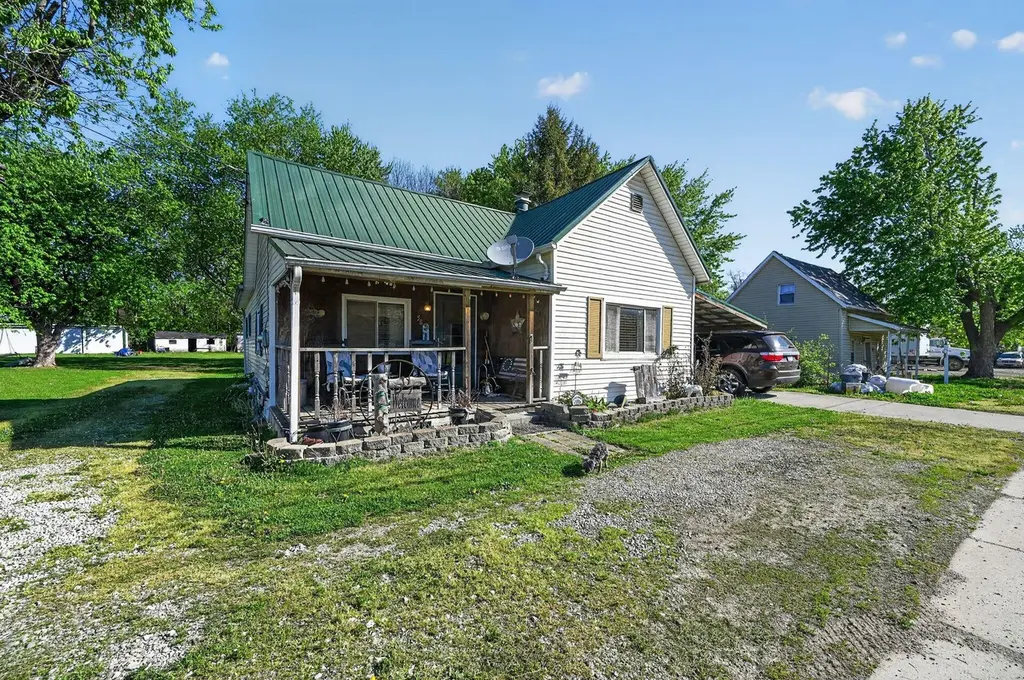
58 Biddle Blvd · Bloomingburg, OH
Flood risk 1/10 · Minimal
- FEMA flood zone
- —
- Chance of flooding over 30 yrs
- 0.0%
- Est. flood insurance / yr
- —
Fire risk 1/10 · Minimal
- Est. fire insurance / yr
- $713 – $1,323
Heat risk 3/10 · Minor
- Hot days now (above 99°F)
- 7 days/yr
- Hot days in 30 yrs
- 18 days/yr
Wind risk 2/10 · Minimal
- Chance of severe wind over 30 yrs
- 1.0%
Air-quality risk 2/10 · Minimal
- Unhealthy air days now
- 1 days/yr
- Unhealthy air days in 30 yrs
- 3 days/yr
Risk factors via First Street. Map © Google.
Why this score? — see what drove the C grade
The composite is a weighted blend of 9 inputs, each scored 0–100. Each bar is that input's sub-score; the figure is the points it added to the 100-point composite (weight × sub-score).
- ARV discount +15.0/15.0
- Cash flow +14.2/30.0
- Appreciation +10.0/10.0
- Schools +5.4/10.0
- DSCR +4.3/10.0
- Livability +3.0/5.0
- 1% rule +2.9/10.0
- Rent growth +2.5/5.0
- Condition / age +2.5/5.0
$155,000
🖨 Deal sheet (PDF) 📄 Offer letter ✓ Due diligence
Listing remarks
Quaint 3 bedroom 1 bath ranch with a carport in Bloomingurg. Fireplace in living room and first floor laundry area for your convenience. Property has a large flat lot with an exterior shed for your storage needs. Call today for your viewing.
Key facts
- Large flat lot
- Exterior shed
- 0.62 acre lot
Tags
Property features AI
Exterior
- Utilities: Public water; Public sewer
- Home design: Single-family residence; One level; Built in 1900; No common walls
- Construction: Block foundation
- Exterior features: Shed(s) on property; Lot approximately 0.62 acre
Interior
- Bedrooms: 3 bedrooms on the main level
- Bathrooms: 1 full bathroom
- Heating & cooling: Forced-air heating
- Interior features: One fireplace; Crawl space basement
Neighborhood map
What this means for you Summary
Snapshot
- This is a 3-bed/1.0-bath single-family listed at $155k.
Deal economics
- At list price, monthly cash flow is $24 ($293/yr) — positive.
- The deal already cash-flows at list — no discount required.
- To meet the 1% rule (rent ≥ 1% of price), the offer needs to be $123k (20.6% below list).
- Recommended offer: $123k (20.6% below list) — sets the bar for 1% rule.
Location & tenants
- Location reads 59/100 on livability (#1,032 in OH) — a working-class tenant base; expect higher turnover. Strengths: cost of living A+, housing A+; Watch: employment C-, crime D, schools F.
- Miami Trace Local (rural): math 61% / reading 67% proficiency, ranked #235 of 656 in OH (top 36%) — acceptable for families but not a draw, mixed tenant base, ~2y average lease.
- Market conditions: 7 active listings in the ZIP; 71 units permitted in Fayette County in 2024 (0 in 5+ unit buildings).
Forward outlook
- In year one you build about $17k of equity ($1k loan paydown + $16k appreciation (10.0% local appreciation)).
- Fayette County population projected at -18% by 2050 — secular population decline; favor cash flow + early exit over multi-decade hold.
- At projected returns (10.0% appreciation + 3.0% rent growth), your $43k cash investment doubles in ~3 years — after that, you're playing with house money.
- By year 3, paydown + projected appreciation supports a ~$42k cash-out refi (75% LTV) — recoverable capital for the next deal without selling this one.
Negotiation context
- It's been on market 43 days — a 3% lower offer ($150k) is reasonable based on typical stale-listing flexibility.
- 2 sale attempts; this cycle's ask has dropped $35k (18%) from the opening price — seller is motivated, your offer sets the floor, not the list.
Risks & watch-outs
- Watch-outs: built in 1900 — expect roof / HVAC / electrical / plumbing capex.
Questions for the listing agent
- It's been on market 43 days. Have you received any prior offers? Is the seller open to a 21% concession, seller financing, or rate buy-down credit?
- Built in 1900 — when were the roof, HVAC, electrical panel, plumbing, and water heater last replaced?
- Is there a deadline driving the sale (1031 exchange, divorce, estate, relocation)? That informs how much negotiation room exists.
- Schools are F-rated, which usually means shorter tenancies and higher turnover. Who's the typical renter profile here, and what's been the actual vacancy rate?
- Crime grade is D in this area — have there been break-ins, vandalism, or insurance claims at this property in the last 3 years? What carrier currently insures it and at what premium?
- What's the average days-on-market for RENTAL listings here right now (not sales)? A rising rental-DOM trend means longer vacancies and softer asking-rent achievability than the comps imply.
- What's the recent tenant-quality profile in this submarket — average credit score on applications, eviction rate, late-payment / NSF rate, and stable-employment percentage? A property-management company in the area should have these aggregated.
- How much new for-sale + rental construction is in the pipeline within 1–3 miles? Heavy new supply typically softens prices + rents 12–24 months out; constrained supply supports both.
Investment metrics
- 1% rule
- 0.79% ✗
- Cap rate
- 6.48%
- Cash-on-cash
- 0.68%
- DSCR
- 1.03
- GRM
- 10.5
CMA / ARV
- ARV (median comp)
- $230,846
- List price
- $155,000
- Delta
- -32.86%
- Verdict
- UNDERPRICED
- Comps
- 20 within 1.0 mi
Show comp detail 5 sales within ~0.75 mi
| Address | Dist | Beds/Ba | Sqft | Sold | Price | $/sf | Match |
|---|---|---|---|---|---|---|---|
| 52 West St | 0.34mi | 3/1.0 | 1,726 (-1%) | 1mo | $69,000 | $40 | 82 |
| 100 Main St | 0.20mi | 4/2.0 (+1) | 1,783 (+2%) | 22mo | $230,000 | $129 | 60 |
| 100 West St | 0.29mi | 3/2.0 | 1,872 (+7%) | 13mo | $465,000 | $248 | 60 |
| 6648 State Route 38 NE | 0.35mi | 3/2.0 | 1,816 (+4%) | 16mo | $275,000 | $151 | 60 |
| 41 Lincoln St | 0.20mi | 3/2.5 | 1,512 (-13%) | 19mo | $272,000 | $180 | 46 |
Match score weights: distance 35% · size 25% · config 20% · recency 20%. Top-matched comps best support the ARV.
Projected returns pro-forma
10.0% appreciation · 3.0% rent growth · sell at horizon
- IRR
- 24.7%
- Equity multiple
- 2.98×
- Total profit
- $85,917
- Equity at exit
- $139,636
- IRR
- 21.9%
- Equity multiple
- 6.80×
- Total profit
- $251,674
- Equity at exit
- $301,131
Cash invested: $43,400 (down + closing). Projections, not guarantees.
Landlord ↔ Tenant lean methodology
- Overall (STATE)
- 73 Landlord-Friendly
- State Ohio
- 73 Landlord-Friendly · R+6
- County
- — inherits STATE
- City
- — inherits STATE
ZIP-level market 43106
- Home prices YoY
- 8.9%
- Active inventory
- 7
- Price-to-rent
- 10.5×
Monthly cashflow live
- Estimated rent
- $1,231 medium interval (Pro) →
- Mortgage (P&I)
- −$813
- Tax from tax record
- −$71 /mo · $846/yr
- Insurance
- −$65
- HOA
- −$0
- Vacancy / Maint / Mgmt
- −$258
- Net cashflow
- $24
Break-even live
Sensitivity live
| Price | -10% $112 | -5% $68 | +0% $24 | +5% $-19 | +10% $-63 |
|---|---|---|---|---|---|
| Rent | -10% $-73 | -5% $-24 | +0% $24 | +5% $73 | +10% $122 |
| Rate | -1.0pp $103 | -0.5pp $64 | base $24 | +0.5pp $-16 | +1.0pp $-57 |
UW: 25.0% down · 7.5% · 30yr · 1.5% tax · 5.0% vac · 8.0% maint · 8.0% mgmt
Financing live
Cash to close
- Down payment
- $38,750
- Closing costs
- $4,650
- Reserves months
- —
- Total cash needed
- —
Loan-product check · same deal, 3 products live
Conventional
25% down · 7.5% · 30yr
- Down + closing
- —
- Monthly P&I
- —
- Monthly cashflow
- —
- DSCR
- —
- Eligible?
- —
Personal DTI + credit; lowest rate.
DSCR
20% down · 8.5% · 30yr
- Down + closing
- —
- Monthly P&I
- —
- Monthly cashflow
- —
- DSCR
- —
- Eligible?
- —
No personal income docs; deal must DSCR.
Hard money
10% down · 12.0% · 12mo
- Down + closing
- —
- Monthly P&I
- —
- Monthly cashflow
- —
- DSCR
- —
- Eligible?
- —
Short-term bridge; refi at stabilization.
Listing history 20 events
-
2026-06-21days on market $155,000 Active 43 DOM
-
2026-06-18days on market $155,000 Active 41 DOM
-
2026-06-17days on market $155,000 Active 40 DOM
-
2026-06-17price $155,000 Active 39 DOM
-
2026-06-16days on market $160,000 Active 39 DOM
-
2026-06-15days on market $160,000 Active 38 DOM
-
2026-06-13days on market $160,000 Active 36 DOM
-
2026-06-12pricedays on market $160,000 Active 35 DOM
-
2026-06-09days on market $165,000 Active 32 DOM
-
2026-06-08days on market $165,000 Active 31 DOM
-
2026-06-08days on market $165,000 Active 30 DOM
-
2026-06-07pricedays on market $165,000 Active 29 DOM
-
2026-06-04days on market $170,000 Active 26 DOM
-
2026-06-03price $170,000 Active 25 DOM
-
2026-06-02days on market $175,000 Active 25 DOM
-
2026-06-01days on market $175,000 Active 24 DOM
-
2026-05-31days on market $175,000 Active 23 DOM
-
2026-05-14price $185,000 241-char remark
-
2026-05-08$190,000 Active 241-char remark
-
2026-05-04$190,000 Active
ⓘ Source: listings_history table (triggers on properties + properties_extension) + one-shot
backfill from property_details.listing_events for pre-trigger history.
Tax reassessment forecast OH · Partial reset (capped growth)
- Current annual tax
- $846 · $71/mo
- Projected year-2 tax
- $1,632 · $136/mo
- Expected delta
- +$786/yr (+$65/mo · 92.9%)
ⓘ Screening estimate from a state-policy table — verify with the county assessor before closing.
Climate risk First Street
- Flood 1/10 Low 0% chance over 30 yrs
- Wildfire 1/10 Low
- Heat 3/10 Moderate 7 d/yr ≥99°F today · 18 d/yr by 30 yrs out
- Wind 2/10 Low 100% chance of damaging wind over 30 yrs
- Air quality 2/10 Low 1 unhealthy d/yr today · 3 by 30 yrs out
Nearby sold comps map
Loading sold comps map…
Walkable amenities ~0.75 mi
Loading nearby amenities…
Taxation est. · year 1
- Rental income
- $14,771
- − Mortgage interest
- −$8,682
- − Property taxes
- −$846
- − Insurance
- −$775
- − Repairs & maintenance
- −$1,182
- − Management
- −$1,182
- − Depreciation
- −$4,509
- Taxable loss
- −$2,406
- Est. tax savings @ 24.0%
- +$577
- After-tax cash flow
- $871/yr
For passive investors: Depreciation is non-cash, so a rental often shows a tax loss while cash-flowing — sheltering income. Rental losses are passive: they offset passive income freely, and up to $25,000/yr can offset ordinary (W-2) income if you actively participate and your MAGI is under $100k (phasing out to $0 by $150k); unused losses carry forward. On sale, claimed depreciation is recaptured at up to 25%, and gains may owe capital-gains tax (a 1031 exchange can defer both). Figures are a year-1 estimate at your 24.0% rate — not tax advice; consult a CPA.
Schools (NCES district)
- District
- Miami Trace Local
- NCES district ID
- 3910010
- Math proficiency
- 61% ▼ -15.00%
- Reading proficiency
- 67% ▼ -5.00%
- Median HH income
- $45,826
- Composite
- 53.98/100
- National rank
- #1398
- State rank
- #235 of 656 in OH
Livability — Bloomingburg
- Score
- 59/100
- State rank
- #1032
- US rank
- #20487
Category grades
Schools grade is shown separately in the Schools card above.
Census & demographics
- Census place
- Bloomingburg, OH
- County
- Fayette · 25,566 people
- Population (ZIP)
- 1,562
- Household income
- $62,853
- Rent vs Own
- Severe rent burden
- 5.8
Population outlook (Fayette County) Hauer SSP2
- Today (2025)
- 27,616 people
- By 2030
- 26,760 · -3.1%
- By 2040
- 24,789 · -10.2%
- By 2050
- 22,550 · -18.3%
- By 2075
- 16,893 · -38.8%
- By 2100
- 11,246 · -59.3%
Race, ethnicity, and origin ACS 2023
- Neighborhood character
- Predominantly White (90%)
- Race & ethnicity
- White 90% Hispanic / Latino 6% Two or more races 6% Black 1%
- Hispanic origin (detail)
- Mexican 3%
- Common ancestry
- Slovak 2% Iranian 2% Lithuanian 1%
- Foreign-born
- 4% · Canada
- Languages at home
- 96% English-only · Spanish 3% German/W. Germanic 1% Tagalog/Filipino 1%
Political lean MEDSL · Fayette
- 2024 margin
- Solid R (+55.1) · D 22.1% · R 77.2%
- 2008→2024 swing
- -32.0pp toward R · 2008: -23.1pp · 2024: -55.1pp
- All cycles
- 2024: R+55.1 2020: R+51.5 2016: R+47.1 2012: R+22.3 2008: R+23.1
Not yet ingested
- Civics
- —
Market trends
- HPI YoY
- ▲ 20.72%
- Current HPI
- 254.4499
- Rent YoY
- —
- Metro
- —
- State GDP YoY
- ▲ 1.98%
- F500 in state
- 48
Industry mix (Fortune 500 HQ in OH)
| Industry | F500 HQs | Revenue |
|---|---|---|
| Insurance | 3 | $145B |
|
||
| Industrial Machinery | 3 | $49B |
|
||
| Financial Services | 3 | $24B |
|
||
| Consumer Goods | 2 | $93B |
|
||
| Aerospace / Defense | 2 | $47B |
|
||
| Utilities | 2 | $33B |
|
||
Price history
-18.4% since first listed9 events — show timeline
- 2026-06-17 Price Changed $155,000 CBRMLS
- 2026-06-11 Price Changed $160,000 CBRMLS
- 2026-06-06 Price Changed $165,000 CBRMLS
- 2026-06-03 Price Changed $170,000 CBRMLS
- 2026-05-27 Price Changed $175,000 CBRMLS
- 2026-05-19 Price Changed $180,000 CBRMLS
- 2026-05-14 Price Changed $185,000 CBRMLS
- 2026-05-08 Listed $190,000 CBRMLS
- 2026-05-04 Listed $190,000 MARMLS
Property tax history
+12.6%/yrLatest (2025): $846 · -1.7% YoY. Source: county tax records.
Cash-flow waterfall
monthlySold comps — $/sqft
last 12 mo · ≤1 miLoading sold comps…