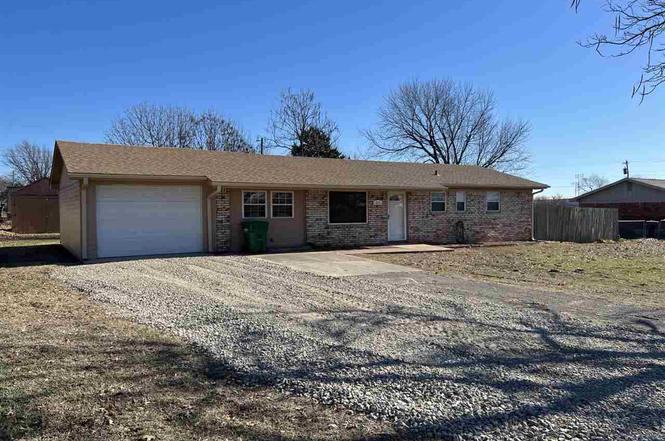
313 Osel Ave · Morrison, OK
Flood risk 1/10 · Minimal
- FEMA flood zone
- X (unshaded)
- Chance of flooding over 30 yrs
- 0.0%
- Est. flood insurance / yr
- $507 – $1,088
Fire risk 6/10 · Moderate
- Est. fire insurance / yr
- $2,463 – $4,575
Heat risk 6/10 · Moderate
- Hot days now (above 109°F)
- 7 days/yr
- Hot days in 30 yrs
- 19 days/yr
Wind risk 2/10 · Minimal
- Chance of severe wind over 30 yrs
- 2.0%
Air-quality risk 2/10 · Minimal
- Unhealthy air days now
- 0 days/yr
- Unhealthy air days in 30 yrs
- 1 days/yr
Risk factors via First Street. Map © Google.
Why this score? — see what drove the C- grade
The composite is a weighted blend of 9 inputs, each scored 0–100. Each bar is that input's sub-score; the figure is the points it added to the 100-point composite (weight × sub-score).
- ARV discount +15.0/15.0
- Cash flow +11.4/30.0
- Appreciation +8.2/10.0
- DSCR +3.3/10.0
- Livability +3.1/5.0
- Rent growth +2.5/5.0
- Schools +2.5/10.0
- Condition / age +2.5/5.0
- 1% rule +2.1/10.0
$173,000
🖨 Deal sheet (PDF) 📄 Offer letter ✓ Due diligence
Listing remarks
Welcome to 313 Osel Avenue in the charming town of Morrison, just 15 miles north of Stillwater. This 3-bedroom, 1.5-bath home with a 1-car garage is listed at $175,000 and offers a fresh, updated feel at a budget-friendly price. Recent updates include new flooring, fresh paint, updated fixtures, new appliances, and a new tub/shower combination. Located in the highly sought-after Morrison School District, this move-in ready home is ideal for first-time buyers, downsizers, or anyone looking to enjoy small-town living with convenient access to Stillwater. Don’t miss this opportunity to own an updated, affordable home in a great location.
Key facts
- Garage
- Built 1971
- Listed 98 days
Neighborhood map
What this means for you Summary
Snapshot
- This is a 3-bed/1.0-bath single-family listed at $173k.
Deal economics
- At list price, monthly cash flow is $-62 ($-740/yr) — negative.
- To cash-flow at today's rent, offer at most $162k (6.3% below list).
- To meet the 1% rule (rent ≥ 1% of price), the offer needs to be $122k (29.3% below list).
- Recommended offer: $122k (29.3% below list) — sets the bar for 1% rule.
Location & tenants
- Location reads 62/100 on livability (#267 in OK) — a middle-class / working-renter tenant base. Strengths: cost of living A+, housing A+; Watch: employment D+, crime D, amenities F.
- Morrison (rural): math 31% / reading 26% proficiency, ranked #65 of 270 in OK (top 24%) — low school quality limits family demand, transient renter base, plan for 1-2y turnover.
- Zoned schools: Morrison Es (math 42% / reading 32%, grade F, #132 of 845 statewide, top 19%, 339 students, 0% FRL); Morrison Ms (math 12% / reading 12%, grade F, #269 of 345 statewide, top 79%, 88 students, 0% FRL); Morrison Hs (math 24% / reading 44%, grade F, #48 of 447 statewide, top 14%, 176 students, 0% FRL) — zoned schools average 0% FRL vs 50% district-wide (50 pts lower); this property's tenant base skews higher-income than the district average.
- Market conditions: 24 active listings in the ZIP; 4 units permitted in Noble County in 2024 (0 in 5+ unit buildings).
Forward outlook
- In year one you build about $12k of equity ($1k loan paydown + $11k appreciation (6.3% local appreciation)).
- Noble County population projected to shrink 4% by 2050 — rents likely to lag national; underwrite the cash flow, not the appreciation.
- At projected returns (6.3% appreciation + 3.0% rent growth), your $48k cash investment doubles in ~4 years — after that, you're playing with house money.
- By year 3, paydown + projected appreciation supports a ~$30k cash-out refi (75% LTV) — recoverable capital for the next deal without selling this one.
Negotiation context
- It's been on market 98 days — a 9% lower offer ($157k) is reasonable based on typical stale-listing flexibility.
- 3 sale attempts with the ask held roughly flat each time — persistent listings suggest the price (not the market) is what's stuck; bring a comps-based counter.
- Current owner paid $112k; list at $173k implies a 54% gain — meaningful room to come down on a strong offer.
Risks & watch-outs
- Climate carrying-cost: major wildfire risk; extreme-heat days projected 7→19/yr by 2055 (HVAC capex compounding) — expect insurance premiums to compound above CPI over the hold.
Questions for the listing agent
- What do current leases actually rent for vs. the listed asking? Can we see a recent rent roll and the last 12 months of T-12 income?
- It's been on market 98 days. Have you received any prior offers? Is the seller open to a 29% concession, seller financing, or rate buy-down credit?
- Built in 1971 — when were the roof, HVAC, electrical panel, plumbing, and water heater last replaced?
- Why hasn't it sold? Are there any deal-killer items the seller is aware of (foundation, flood, title, zoning, code violations)?
- Is there a deadline driving the sale (1031 exchange, divorce, estate, relocation)? That informs how much negotiation room exists.
- Schools are F-rated, which usually means shorter tenancies and higher turnover. Who's the typical renter profile here, and what's been the actual vacancy rate?
- Crime grade is D in this area — have there been break-ins, vandalism, or insurance claims at this property in the last 3 years? What carrier currently insures it and at what premium?
- What's the average days-on-market for RENTAL listings here right now (not sales)? A rising rental-DOM trend means longer vacancies and softer asking-rent achievability than the comps imply.
- What's the recent tenant-quality profile in this submarket — average credit score on applications, eviction rate, late-payment / NSF rate, and stable-employment percentage? A property-management company in the area should have these aggregated.
- How much new for-sale + rental construction is in the pipeline within 1–3 miles? Heavy new supply typically softens prices + rents 12–24 months out; constrained supply supports both.
Investment metrics
- 1% rule
- 0.71% ✗
- Cap rate
- 5.87%
- Cash-on-cash
- -1.53%
- DSCR
- 0.93
- GRM
- 11.8
CMA / ARV
- ARV (on-the-fly)
- $210,375
- Comps found
- 2
Show comp detail 2 sales within ~0.75 mi
| Address | Dist | Beds/Ba | Sqft | Sold | Price | $/sf | Match |
|---|---|---|---|---|---|---|---|
| 308 Osel | 0.06mi | 4/2.0 (+1) | 1,270 (-0%) | 8mo | $209,511 | $165 | 81 |
| 906 W Highway 64 | 0.12mi | 3/2.0 | 1,096 (-14%) | 18mo | $120,000 | $109 | 52 |
Match score weights: distance 35% · size 25% · config 20% · recency 20%. Top-matched comps best support the ARV.
Projected returns pro-forma
6.35% appreciation · 3.0% rent growth · sell at horizon
- IRR
- 15.0%
- Equity multiple
- 2.02×
- Total profit
- $49,578
- Equity at exit
- $112,628
- IRR
- 15.0%
- Equity multiple
- 4.05×
- Total profit
- $147,848
- Equity at exit
- $207,674
Cash invested: $48,440 (down + closing). Projections, not guarantees.
Landlord ↔ Tenant lean methodology
- Overall (STATE)
- 83 Strongly Landlord-Friendly
- State Oklahoma
- 83 Strongly Landlord-Friendly · R+20
- County
- — inherits STATE
- City
- — inherits STATE
ZIP-level market 73061
- Home prices YoY
- 2.6%
- Active inventory
- 24
- Price-to-rent
- 11.8×
Monthly cashflow live
- Estimated rent
- $1,222 medium interval (Pro) →
- Mortgage (P&I)
- −$907
- Tax from tax record
- −$48 /mo · $576/yr
- Insurance
- −$72
- HOA
- −$0
- Vacancy / Maint / Mgmt
- −$257
- Net cashflow
- $-62
Break-even live
Sensitivity live
| Price | -10% $36 | -5% $-13 | +0% $-62 | +5% $-111 | +10% $-160 |
|---|---|---|---|---|---|
| Rent | -10% $-158 | -5% $-110 | +0% $-62 | +5% $-13 | +10% $35 |
| Rate | -1.0pp $25 | -0.5pp $-18 | base $-62 | +0.5pp $-106 | +1.0pp $-152 |
UW: 25.0% down · 7.5% · 30yr · 1.5% tax · 5.0% vac · 8.0% maint · 8.0% mgmt
Financing live
Cash to close
- Down payment
- $43,250
- Closing costs
- $5,190
- Reserves months
- —
- Total cash needed
- —
Loan-product check · same deal, 3 products live
Conventional
25% down · 7.5% · 30yr
- Down + closing
- —
- Monthly P&I
- —
- Monthly cashflow
- —
- DSCR
- —
- Eligible?
- —
Personal DTI + credit; lowest rate.
DSCR
20% down · 8.5% · 30yr
- Down + closing
- —
- Monthly P&I
- —
- Monthly cashflow
- —
- DSCR
- —
- Eligible?
- —
No personal income docs; deal must DSCR.
Hard money
10% down · 12.0% · 12mo
- Down + closing
- —
- Monthly P&I
- —
- Monthly cashflow
- —
- DSCR
- —
- Eligible?
- —
Short-term bridge; refi at stabilization.
Listing history 12 events
-
2026-04-23status Pending
-
2026-04-06status Active
-
2026-03-24status Pending
-
2026-02-27price $173,000
-
2026-01-02$175,000 Active
-
2025-10-12price $117,000
-
2025-09-24soldstatus $112,000 Closed
-
2025-09-14status Pending
-
2025-08-08price $137,500
-
2025-08-04$137,500,000 Active
-
2007-05-24soldstatus $76,000
-
2003-10-20soldstatus $63,000
ⓘ Source: listings_history table (triggers on properties + properties_extension) + one-shot
backfill from property_details.listing_events for pre-trigger history.
Tax reassessment forecast OK · Resets to sale price
- Current annual tax
- $576 · $48/mo
- Projected year-2 tax
- $1,557 · $130/mo
- Expected delta
- +$981/yr (+$82/mo · 170.3%)
ⓘ Screening estimate from a state-policy table — verify with the county assessor before closing.
Climate risk First Street
- Flood 1/10 Low FEMA zone X (unshaded) · 0% chance over 30 yrs
- Wildfire 6/10 Major
- Heat 6/10 Major 7 d/yr ≥109°F today · 19 d/yr by 30 yrs out
- Wind 2/10 Low 2% chance of damaging wind over 30 yrs
- Air quality 2/10 Low 0 unhealthy d/yr today · 1 by 30 yrs out
Nearby sold comps map
Loading sold comps map…
Walkable amenities ~0.75 mi
Loading nearby amenities…
Taxation est. · year 1
- Rental income
- $14,668
- − Mortgage interest
- −$9,691
- − Property taxes
- −$576
- − Insurance
- −$865
- − Repairs & maintenance
- −$1,173
- − Management
- −$1,173
- − Depreciation
- −$5,033
- Taxable loss
- −$3,843
- Est. tax savings @ 24.0%
- +$922
- After-tax cash flow
- $183/yr
For passive investors: Depreciation is non-cash, so a rental often shows a tax loss while cash-flowing — sheltering income. Rental losses are passive: they offset passive income freely, and up to $25,000/yr can offset ordinary (W-2) income if you actively participate and your MAGI is under $100k (phasing out to $0 by $150k); unused losses carry forward. On sale, claimed depreciation is recaptured at up to 25%, and gains may owe capital-gains tax (a 1031 exchange can defer both). Figures are a year-1 estimate at your 24.0% rate — not tax advice; consult a CPA.
Schools (NCES district)
- District
- Morrison
- NCES district ID
- 4020340
- Math proficiency
- 31% ▼ -9.00%
- Reading proficiency
- 26% ▼ -9.00%
- Median HH income
- $52,900
- Composite
- 25.27/100
- National rank
- #7495
- State rank
- #65 of 270 in OK
Livability — Morrison
- Score
- 62/100
- State rank
- #267
- US rank
- #17077
Category grades
Schools grade is shown separately in the Schools card above.
Census & demographics
- Census place
- Morrison, OK
- Population (ZIP)
- 1,693
Population outlook (Noble County) Hauer SSP2
- Today (2025)
- 11,554 people
- By 2030
- 11,506 · -0.4%
- By 2040
- 11,345 · -1.8%
- By 2050
- 11,128 · -3.7%
- By 2075
- 10,658 · -7.8%
- By 2100
- 9,623 · -16.7%
Race, ethnicity, and origin ACS 2023
- Neighborhood character
- Predominantly White (77%)
- Race & ethnicity
- White 77% Two or more races 17% Native American 4% Hispanic / Latino 2%
- Common ancestry
- Slovak 5% Serbian 3% Iranian 1%
- Foreign-born
- 0%
Political lean MEDSL · Noble
- 2024 margin
- Solid R (+57.4) · D 20.4% · R 77.7% · Other 1.9%
- 2008→2024 swing
- -3.8pp toward R · 2008: -53.6pp · 2024: -57.4pp
- All cycles
- 2024: R+57.4 2020: R+57.1 2016: R+57.6 2012: R+50.6 2008: R+53.6
Not yet ingested
- Civics
- —
Market trends
- HPI YoY
- ▲ 6.35%
- Current HPI
- 250.534
- Rent YoY
- —
- Metro
- —
- State GDP YoY
- ▲ 1.55%
- F500 in state
- 6
Industry mix (Fortune 500 HQ in OK)
| Industry | F500 HQs | Revenue |
|---|---|---|
| Energy | 3 | $48B |
|
||
Price history
+174.6% since first listed12 events — show timeline
- 2026-04-23 Pending — SBOR
- 2026-04-06 Relisted — SBOR
- 2026-03-24 Pending — SBOR
- 2026-02-27 Price Changed $173,000 SBOR
- 2026-01-02 Listed $175,000 SBOR
- 2025-10-12 Price Changed $117,000 SBOR
- 2025-09-24 Sold (MLS) $112,000 SBOR
- 2025-09-14 Pending — SBOR
- 2025-08-08 Price Changed $137,500 SBOR
- 2025-08-04 Listed $137,500,000 SBOR
- 2007-05-24 Sold (Public Records) $76,000 Public Records
- 2003-10-20 Sold (Public Records) $63,000 Public Records
Property tax history
+0.3%/yrLatest (2025): $576 · -2.2% YoY. Source: county tax records.
Cash-flow waterfall
monthlySold comps — $/sqft
last 12 mo · ≤1 miLoading sold comps…