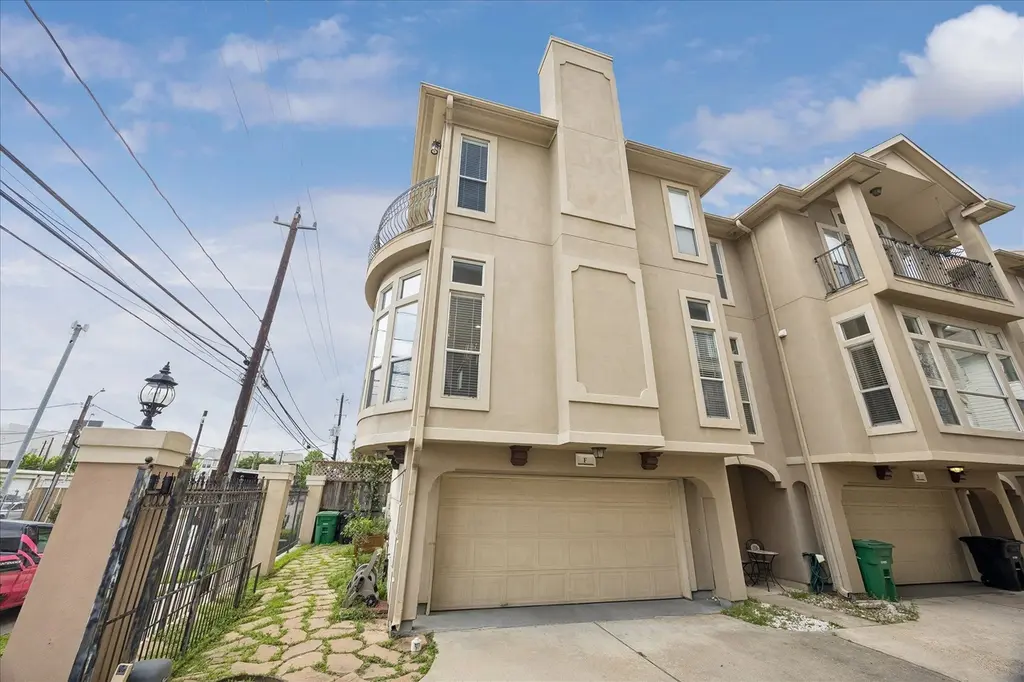
1304 Dart St Unit F · Houston, TX
Flood risk 1/10 · Minimal
- FEMA flood zone
- X (unshaded)
- Chance of flooding over 30 yrs
- 0.0%
- Est. flood insurance / yr
- $507 – $1,088
Fire risk 1/10 · Minimal
- Est. fire insurance / yr
- $1,222 – $2,270
Heat risk 9/10 · Severe
- Hot days now (above 109°F)
- 7 days/yr
- Hot days in 30 yrs
- 24 days/yr
Wind risk 9/10 · Severe
- Chance of severe wind over 30 yrs
- 99.0%
Air-quality risk 3/10 · Minor
- Unhealthy air days now
- 2 days/yr
- Unhealthy air days in 30 yrs
- 3 days/yr
Risk factors via First Street. Map © Google.
Why this score? — see what drove the C- grade
The composite is a weighted blend of 9 inputs, each scored 0–100. Each bar is that input's sub-score; the figure is the points it added to the 100-point composite (weight × sub-score).
- Cash flow +18.7/30.0
- ARV discount +12.1/15.0
- DSCR +5.9/10.0
- 1% rule +5.8/10.0
- Livability +3.7/5.0
- Schools +2.7/10.0
- Condition / age +2.5/5.0
- Rent growth +2.3/5.0
- Appreciation +0.0/10.0
$380,000
🖨 Deal sheet 📄 Offer letter ✓ Due diligence
Listing remarks MLS
Welcome home to 1304 Dart St. F! Currently tenant occupied until 2027, perfect for an investor or someone looking to move in the future. In the heart of one of Houston's most popular neighborhoods, this classic 3 story with outdoor space and views of downtown is a true beauty. The stunning property features 3 bedrooms and 3.5 bathrooms with a fantastic open concept living area, stainless steel appliances, and timeless finishes. Conveniently located near Houston's best dining and entertainment, the home provides easy access to the Heights, Montrose, and Downtown while just minutes from major highways i10, 610, 45 and 59. Schedule a tour today!
Key facts
- Timeless finishes
- Outdoor space
- Views of downtown
Tags
Neighborhood map
What this means for you Summary
Snapshot
- This is a 3-bed/3.0-bath townhouse listed at $380k.
Deal economics
- At list price, monthly cash flow is $379 ($5k/yr) — positive.
- The deal already cash-flows at list — no discount required.
- Meets the 1% rule at list price ($4k rent vs $380k).
- Recommended offer: $369k (3.0% below list) — sets the bar for market timing.
- Cap rate 7.5% vs local median 3.2% in Houston — top-decile yield for the area; either an underpriced asset or a hidden risk that comps aren't pricing in. Stress-test before assuming the spread holds.
Location & tenants
- Location reads 74/100 on livability (#184 in TX, #4,771 nationally) — a middle-class / working-renter tenant base. Strengths: amenities A+, cost of living A+, housing A+; Watch: schools D, crime F.
- Houston ISD (urban): math 27% / reading 35% proficiency, ranked #593 of 826 in TX (top 72%) — families likely to look elsewhere, expect single-tenant / working-renter base with shorter leases; 71% free/reduced lunch — lower-income household profile, screen leases tightly.
- Market conditions: Rents soft (-0.8%/yr); 646 active listings in the ZIP; 40 comparable units currently listed for rent nearby; rentals at typical pace (median 16d on market — plan ~3-4 weeks tenant-placement turnaround); 40% of comp listings sitting > 30 days — soft ceiling on asking rent; high-income renter base; 29,883 units permitted in Harris County in 2024 (8,621 in 5+ unit buildings).
- This rent runs 34% of the median local income ($145k/yr) — at the standard rent-burdened threshold; future hikes will face affordability resistance.
Forward outlook
- Local home prices are declining (-3.0%/yr); year-one equity from $3k of loan paydown is wiped out by about $11k of value loss. Plan a longer hold.
- Harris County population projected at +47% by 2050 — long-run rental-demand tailwind backs the buy-and-hold thesis.
Negotiation context
- It's been on market 58 days — a 3% lower offer ($369k) is reasonable based on typical stale-listing flexibility.
- 13 sale attempts since 18y ago with the ask held roughly flat each time — persistent listings suggest the price (not the market) is what's stuck; bring a comps-based counter.
Risks & watch-outs
- Climate carrying-cost: severe wind risk, 99% chance of damaging wind over 30y; extreme-heat days projected 7→24/yr by 2055 (HVAC capex compounding) — expect insurance premiums to compound above CPI over the hold.
Questions for the listing agent
- It's been on market 58 days. Have you received any prior offers? Is the seller open to a 3% concession, seller financing, or rate buy-down credit?
- Is there a deadline driving the sale (1031 exchange, divorce, estate, relocation)? That informs how much negotiation room exists.
- Schools are D-rated, which usually means shorter tenancies and higher turnover. Who's the typical renter profile here, and what's been the actual vacancy rate?
- Crime grade is F in this area — have there been break-ins, vandalism, or insurance claims at this property in the last 3 years? What carrier currently insures it and at what premium?
- What's the average days-on-market for RENTAL listings here right now (not sales)? A rising rental-DOM trend means longer vacancies and softer asking-rent achievability than the comps imply.
- What's the recent tenant-quality profile in this submarket — average credit score on applications, eviction rate, late-payment / NSF rate, and stable-employment percentage? A property-management company in the area should have these aggregated.
- How much new for-sale + rental construction is in the pipeline within 1–3 miles? Heavy new supply typically softens prices + rents 12–24 months out; constrained supply supports both.
Investment metrics
- 1% rule
- 1.08% ✓
- Cap rate
- 7.49%
- Cash-on-cash
- 4.27%
- DSCR
- 1.19
- GRM
- 7.7
CMA / ARV
- ARV (median comp)
- $423,424
- List price
- $380,000
- Delta
- -10.26%
- Verdict
- UNDERPRICED
- Comps
- 20 within 1.0 mi
Show comp detail 12 sales within ~0.75 mi
| Address | Dist | Beds/Ba | Sqft | Sold | Price | $/sf | Match |
|---|---|---|---|---|---|---|---|
| 1304 Dart St Unit E | 0.00mi | 3/3.0 | 2,088 (+7%) | 3mo | $400,000 | $192 | 86 |
| 939 Colorado St #20 | 0.36mi | 3/3.0 | 2,000 (+2%) | 1mo | $365,000 | $183 | 79 |
| 1205 Summer St Unit C | 0.19mi | 3/3.5 | 2,088 (+7%) | 7mo | $420,000 | $201 | 72 |
| 1205 Summer St Unit A | 0.19mi | 3/3.5 | 2,088 (+7%) | 8mo | $399,990 | $192 | 71 |
| 939 Colorado St #13 | 0.34mi | 3/3.0 | 2,088 (+7%) | 3mo | $424,900 | $203 | 70 |
| 1823 Dart St | 0.36mi | 3/3.5 | 1,888 (-3%) | 11mo | $379,900 | $201 | 66 |
| 1923 Shearn St | 0.52mi | 3/3.5 | 1,964 (+0%) | 8mo | $425,000 | $216 | 66 |
| 1404 Spring St | 0.36mi | 3/3.5 | 2,024 (+4%) | 13mo | $450,000 | $222 | 65 |
| 1901 Summer St | 0.44mi | 3/3.5 | 1,874 (-4%) | 12mo | $455,000 | $243 | 60 |
| 1917 Summer St | 0.47mi | 3/3.0 | 1,768 (-10%) | 5mo | $465,000 | $263 | 58 |
| 1704 Alamo St Unit A | 0.53mi | 3/3.5 | 2,084 (+7%) | 8mo | $464,000 | $223 | 56 |
| 102 Quitman St #201 | 0.67mi | 2/2.0 (-1) | 1,696 (-13%) | 2mo | $364,900 | $215 | 36 |
Match score weights: distance 35% · size 25% · config 20% · recency 20%. Top-matched comps best support the ARV.
Projected returns pro-forma
-3.0% appreciation · 0.0% rent growth · sell at horizon
- IRR
- -13.3%
- Equity multiple
- 0.54×
- Total profit
- $-49,330
- Equity at exit
- $56,659
- IRR
- -10.5%
- Equity multiple
- 0.46×
- Total profit
- $-57,712
- Equity at exit
- $32,855
Cash invested: $106,400 (down + closing). Projections, not guarantees.
Landlord ↔ Tenant lean methodology
- Overall (STATE)
- 87 Strongly Landlord-Friendly
- State Texas
- 87 Strongly Landlord-Friendly · R+5
- County
- — inherits STATE
- City
- — inherits STATE
ZIP-level market 77007
- Rents YoY
- -0.8%
- Active inventory
- 646
- Price-to-rent
- 7.7×
Monthly cashflow live
- Estimated rent
- $4,122 high interval (Pro) →
- Mortgage (P&I)
- −$1,993
- Tax from tax record
- −$727 /mo · $8,719/yr
- Insurance
- −$158
- HOA
- −$0
- Vacancy / Maint / Mgmt
- −$866
- Net cashflow
- $379
Break-even live
UW: 25.0% down · 7.5% · 30yr · 1.5% tax · 5.0% vac · 8.0% maint · 8.0% mgmt
Financing live
Cash to close
- Down payment
- $95,000
- Closing costs
- $11,400
- Reserves months
- —
- Total cash needed
- —
Loan-product check · same deal, 3 products live
Conventional
25% down · 7.5% · 30yr
- Down + closing
- —
- Monthly P&I
- —
- Monthly cashflow
- —
- DSCR
- —
- Eligible?
- —
Personal DTI + credit; lowest rate.
DSCR
20% down · 8.5% · 30yr
- Down + closing
- —
- Monthly P&I
- —
- Monthly cashflow
- —
- DSCR
- —
- Eligible?
- —
No personal income docs; deal must DSCR.
Hard money
10% down · 12.0% · 12mo
- Down + closing
- —
- Monthly P&I
- —
- Monthly cashflow
- —
- DSCR
- —
- Eligible?
- —
Short-term bridge; refi at stabilization.
Rent comps 40 comps
| Address | Beds | Baths | Sqft | Rent | $/sqft | DOM | Units | Dist |
|---|---|---|---|---|---|---|---|---|
| 1510 Crockett St Houston, TX | 2.0 | 3.0 | 1912 | $2,800 | $1.46 | 43d | 1 | 0.33mi |
| 1512 Crockett St Unit A Houston, TX | 2.0 | 2.5 | 1808 | $2,800 | $1.55 | 43d | 1 | 0.33mi |
| 2114 Sabine St Houston, TX | 3.0 | 4.0 | 2020 | $3,200 | $1.58 | 43d | 1 | 0.55mi |
| 2114 Sabine St Unit 1257735P Houston, TX | 3.0 | 3.5 | 2594 | $6,588 | $2.54 | 43d | 1 | 0.55mi |
| 2121 Edwards St Houston, TX | 2.0 | 1.0–2.0 | 879 | $2,880 | $3.27 | 3d | 25 | 0.58mi |
| 2018 Crockett St Unit 1029793P Houston, TX | 3.0 | 3.5 | 2507 | $6,482 | $2.59 | 5d | 1 | 0.60mi |
| 2018 Crockett St Unit 2018 Houston, TX | 3.0 | 3.5 | 2514 | $8,000 | $3.18 | 43d | 1 | 0.60mi |
| 410 James St Unit 1031793P Houston, TX | 3.0 | 2.0 | 1593 | $7,554 | $4.74 | 16d | 1 | 0.61mi |
| 410 James St Houston, TX | 3.0 | 2.0 | 1602 | $6,750 | $4.21 | 43d | 1 | 0.61mi |
| 1625 N Main St Houston, TX | 3.0 | 1.0–3.0 | 994 | $2,354 | $2.37 | 3d | 42 | 0.61mi |
| 150 Sabine St Houston, TX | 1.0–2.0 | 1.0–2.0 | 1187 | $2,882 | $2.43 | 3d | 15 | 0.62mi |
| 414 Milam St Unit 2187 Houston, TX | 2.0 | 2.0 | 1585 | $3,857 | $2.43 | 2d | 1 | 0.65mi |
| 414 Milam St Unit 3165 Houston, TX | 3.0 | 2.0 | 2421 | $8,959 | $3.70 | 2d | 1 | 0.65mi |
| 414 Milam St Unit 422 Houston, TX | 2.0 | 2.0 | 1585 | $3,833 | $2.42 | 7d | 1 | 0.65mi |
| 414 Milam St Unit 437 Houston, TX | 2.0 | 2.0 | 1585 | $3,857 | $2.43 | 11d | 1 | 0.65mi |
| 414 Milam St Unit 447 Houston, TX | 3.0 | 2.0 | 2421 | $8,991 | $3.71 | 10d | 1 | 0.65mi |
| 414 Milam St Unit 2162 Houston, TX | 2.0 | 2.0 | 1585 | $3,833 | $2.42 | 5d | 1 | 0.65mi |
| 414 Milam St Unit 2165 Houston, TX | 2.0 | 2.0 | 1585 | $3,868 | $2.44 | 4d | 1 | 0.65mi |
| 414 Milam St Unit 2148 Houston, TX | 2.0 | 2.0 | 1585 | $3,825 | $2.41 | 2d | 1 | 0.65mi |
| 414 Milam St Unit 447 Houston, TX | 3.0 | 2.0 | 2421 | $8,973 | $3.71 | 43d | 1 | 0.65mi |
| 414 Milam St Unit 510 Houston, TX | 3.0 | 2.0 | 2421 | $9,230 | $3.81 | 13d | 1 | 0.65mi |
| 414 Milam St Unit B1-2003 Houston, TX | 2.0 | 2.0 | 1585 | $4,513 | $2.85 | 43d | 1 | 0.66mi |
| 414 Milam St Houston, TX | 2.0 | 2.5 | 1585 | $3,845 | $2.43 | 22d | 1 | 0.66mi |
| 414 Milam St Ph 2-4602 Houston, TX | 2.0 | 2.0 | 2158 | $8,990 | $4.17 | 43d | 1 | 0.66mi |
| 2305 Summer St Houston, TX | 2.0 | 1.0–2.0 | 842 | $3,046 | $3.62 | 1d | 11 | 0.68mi |
| 915 Franklin St Unit 312202 Houston, TX | 2.0 | 2.0 | 1398 | $1,987 | $1.42 | 43d | 1 | 0.72mi |
| 915 Franklin St Unit ID51118 Houston, TX | 2.0 | 2.0 | 1342 | $2,000 | $1.49 | 43d | 1 | 0.72mi |
| 2000 Taylor St Houston, TX | 2.0 | 1.0–2.0 | 916 | $3,082 | $3.36 | 1d | 33 | 0.73mi |
| 6 N Main St Houston, TX | 2.0 | 2.0 | 1248 | $2,453 | $1.97 | 43d | 1 | 0.73mi |
| 6 N Main St Houston, TX | 2.0 | 2.0 | 1248 | $2,453 | $1.97 | 20d | 1 | 0.73mi |
| 409 Travis St Unit 425 Houston, TX | 2.0 | 2.0 | 1495 | $3,284 | $2.20 | 2d | 1 | 0.74mi |
| 409 Travis St Unit 432 Houston, TX | 2.0 | 2.0 | 1495 | $3,316 | $2.22 | 10d | 1 | 0.74mi |
| 409 Travis St Unit 424 Houston, TX | 2.0 | 2.0 | 1495 | $3,292 | $2.20 | 7d | 1 | 0.74mi |
| 201 Main St Unit 12258 Houston, TX | 2.0 | 2.0 | 1308 | $2,250 | $1.72 | 43d | 1 | 0.75mi |
| 413 Travis St Houston, TX | 2.0 | 2.0 | 1495 | $4,000 | $2.68 | 43d | 1 | 0.75mi |
| 909 Texas Ave Houston, TX | 2.0 | 1.0–2.0 | 1262 | $3,129 | $2.48 | 1d | 36 | 0.76mi |
| 915 Texas Ave Unit 420 Houston, TX | 3.0 | 2.0 | 2366 | $4,655 | $1.97 | 43d | 1 | 0.80mi |
| 915 Texas Ave Unit 420 Houston, TX | 3.0 | 2.0 | 2366 | $4,655 | $1.97 | 18d | 1 | 0.80mi |
| 207 Carl St Houston, TX | 2.0 | 2.0 | 1230 | $2,250 | $1.83 | 43d | 1 | 0.82mi |
| 1111 Rusk St Houston, TX | 1.0–2.0 | 1.0–2.5 | 1230 | $2,835 | $2.30 | 1d | 29 | 0.94mi |
Listing history 45 events
-
2026-06-18days on market $380,000 Active 58 DOM
-
2026-06-17days on market $380,000 Active 57 DOM
-
2026-06-16days on market $380,000 Active 56 DOM
-
2026-06-15days on market $380,000 Active 55 DOM
-
2026-06-13days on market $380,000 Active 53 DOM
-
2026-06-10days on market $380,000 Active 49 DOM
-
2026-06-08days on market $380,000 Active 48 DOM
-
2026-06-07days on market $380,000 Active 47 DOM
-
2026-06-04days on market $380,000 Active 44 DOM
-
2026-06-01days on market $380,000 Active 41 DOM
-
2026-05-31days on market $380,000 Active 40 DOM
-
2026-04-21$380,000 Active 656-char remark
Show marketing remark (656 chars)
Welcome home to 1304 Dart St. F! Currently tenant occupied until 2027, perfect for an investor or someone looking to move in the future. In the heart of one of Houston's most popular neighborhoods, this classic 3 story with outdoor space and views of downtown is a true beauty. The stunning property features 3 bedrooms and 3.5 bathrooms with a fantastic open concept living area, stainless steel appliances, and timeless finishes. Conveniently located near Houston's best dining and entertainment, the home provides easy access to the Heights, Montrose, and Downtown while just minutes from major highways i10, 610, 45 and 59. Schedule a tour today!
-
2025-11-14historical $2,575
-
2025-10-24$2,575
-
2025-10-23historical $2,650
-
2025-10-01price $2,650
-
2025-09-12$2,750
-
2025-09-11historical $2,750
-
2025-08-26price $2,750
-
2025-08-02$2,900
-
2023-03-26historical
-
2023-03-16$427,500 Active
-
2018-03-06historical
-
2018-03-03status Active
-
2018-02-28status Option Pending
-
2018-02-28status Active
-
2018-02-25status Option Pending
-
2018-02-20$355,000 Active
-
2018-02-19historical
-
2018-02-15status Active
-
2018-02-06status Pending, Continue to Show
-
2017-11-24status Pending
-
2017-11-12status Option Pending
-
2017-10-09price $349,000
-
2017-09-06$359,000 Active
-
2011-03-25soldstatus
-
2011-01-24historical
-
2010-11-23$226,000
-
2010-09-19historical
-
2010-04-27$260,000
-
2009-07-29soldstatus
-
2009-06-06historical
-
2008-12-11soldstatus
-
2008-08-29$279,000
-
2001-01-01soldstatus
ⓘ Source: listings_history table (triggers on properties + properties_extension) + one-shot
backfill from property_details.listing_events for pre-trigger history.
Tax reassessment forecast TX · Resets to sale price
- Current annual tax
- $8,719 · $727/mo
- Projected year-2 tax
- $8,719 · $727/mo
- Expected delta
- $0/yr ($0/mo · 0.0%)
ⓘ Screening estimate from a state-policy table — verify with the county assessor before closing.
Climate risk First Street
- Flood 1/10 Low FEMA zone X (unshaded) · 0% chance over 30 yrs
- Wildfire 1/10 Low
- Heat 9/10 Extreme 7 d/yr ≥109°F today · 24 d/yr by 30 yrs out
- Wind 9/10 Extreme 99% chance of damaging wind over 30 yrs
- Air quality 3/10 Moderate 2 unhealthy d/yr today · 3 by 30 yrs out
Nearby sold comps map
Loading sold comps map…
Walkable amenities ~0.75 mi
Loading nearby amenities…
Taxation est. · year 1
- Rental income
- $49,462
- − Mortgage interest
- −$21,286
- − Property taxes
- −$8,719
- − Insurance
- −$1,900
- − Repairs & maintenance
- −$3,957
- − Management
- −$3,957
- − Depreciation
- −$11,055
- Taxable loss
- −$1,412
- Est. tax savings @ 24.0%
- +$339
- After-tax cash flow
- $4,881/yr
For passive investors: Depreciation is non-cash, so a rental often shows a tax loss while cash-flowing — sheltering income. Rental losses are passive: they offset passive income freely, and up to $25,000/yr can offset ordinary (W-2) income if you actively participate and your MAGI is under $100k (phasing out to $0 by $150k); unused losses carry forward. On sale, claimed depreciation is recaptured at up to 25%, and gains may owe capital-gains tax (a 1031 exchange can defer both). Figures are a year-1 estimate at your 24.0% rate — not tax advice; consult a CPA.
Schools (NCES district)
- District
- Houston ISD
- NCES district ID
- 4823640
- Math proficiency
- 27% ▼ -18.00%
- Reading proficiency
- 35% ▼ -6.00%
- Median HH income
- $46,054
- Composite
- 26.63/100
- National rank
- #7173
- State rank
- #593 of 826 in TX
Livability — Houston
- Score
- 74/100
- State rank
- #184
- US rank
- #4771
Category grades
Schools grade is shown separately in the Schools card above.
Census & demographics
- Census place
- Houston, TX
- County
- Harris County · 4,702,590 people
- City population
- 3,226,434
- Metro
- Houston-The Woodlands-Sugar Land, TX
- Population (ZIP)
- 47,808
- Household income
- $144,911
- Rent vs Own
- Severe rent burden
- 1812.0
Population outlook (Harris County) Hauer SSP2
- Today (2025)
- 5,571,493 people
- By 2030
- 6,089,821 · +9.3%
- By 2040
- 7,142,806 · +28.2%
- By 2050
- 8,185,864 · +46.9%
- By 2075
- 10,574,329 · +89.8%
- By 2100
- 12,109,958 · +117.4%
Race, ethnicity, and origin ACS 2023
- Neighborhood character
- Diverse neighborhood (Simpson 0.63)
- Race & ethnicity
- White 57% Hispanic / Latino 17% Two or more races 13% Asian 11% Black 9%
- Hispanic origin (detail)
- Mexican 12%
- Common ancestry
- Slovak 3% Romanian 3% Italian 3%
- Foreign-born
- 19% · Canada, China, South Korea
- Languages at home
- 75% English-only · Spanish 12% Other Indo-European 4% Chinese 2%
Political lean MEDSL · Harris
- 2024 margin
- Lean D (+5.5) · D 52.0% · R 46.4% · Other 1.6%
- 2008→2024 swing
- +3.9pp toward D · 2008: 1.6pp · 2024: 5.5pp
- All cycles
- 2024: D+5.5 2020: D+13.3 2016: D+12.4 2012: D+0.1 2008: D+1.6
Not yet ingested
- Civics
- —
Market trends
- HPI YoY
- ▼ -219.42%
- Current HPI
- 159.8157
- Rent YoY
- ▼ -0.83%
- Metro
- Houston-The Woodlands-Sugar Land, TX
- State GDP YoY
- ▲ 3.95%
- F500 in state
- 110
Industry mix (Fortune 500 HQ in TX)
| Industry | F500 HQs | Revenue |
|---|---|---|
| Energy | 16 | $1,198B |
|
||
| Technology | 5 | $198B |
|
||
| Engineering / Construction | 4 | $72B |
|
||
| Energy Services | 3 | $60B |
|
||
| Utilities | 3 | $41B |
|
||
| Healthcare | 2 | $330B |
|
||
Price history
+36.2% since first listed34 events — show timeline
- 2026-04-21 Listed $380,000 HARMLS
- 2025-11-14 Rental Removed $2,575 HARMLS
- 2025-10-24 Listed for Rent $2,575 HARMLS
- 2025-10-23 Rental Removed $2,650 HARMLS
- 2025-10-01 Price Changed $2,650 HARMLS
- 2025-09-12 Listed for Rent $2,750 HARMLS
- 2025-09-11 Rental Removed $2,750 HARMLS
- 2025-08-26 Price Changed $2,750 HARMLS
- 2025-08-02 Listed for Rent $2,900 HARMLS
- 2023-03-26 Listing Removed — HARMLS
- 2023-03-16 Listed $427,500 HARMLS
- 2018-03-06 Listing Removed — HARMLS
- 2018-03-03 Relisted — HARMLS
- 2018-02-28 Pending — HARMLS
- 2018-02-28 Relisted — HARMLS
- 2018-02-25 Pending — HARMLS
- 2018-02-20 Listed $355,000 HARMLS
- 2018-02-19 Listing Removed — HARMLS
- 2018-02-15 Relisted — HARMLS
- 2018-02-06 Pending — HARMLS
- 2017-11-24 Pending — HARMLS
- 2017-11-12 Pending — HARMLS
- 2017-10-09 Price Changed $349,000 HARMLS
- 2017-09-06 Listed $359,000 HARMLS
- 2011-03-25 Sold (MLS) — HARMLS
- 2011-01-24 Listing Removed — HARMLS
- 2010-11-23 Listed $226,000 HARMLS
- 2010-09-19 Listing Removed — HARMLS
- 2010-04-27 Listed $260,000 HARMLS
- 2009-07-29 Sold (MLS) — HARMLS
- 2009-06-06 Listing Removed — HARMLS
- 2008-12-11 Sold (Public Records) — Public Records
- 2008-08-29 Listed $279,000 HARMLS
- 2001-01-01 Sold (Public Records) — Public Records
Property tax history
+5.1%/yrLatest (2025): $8,719 · +4.0% YoY. Source: county tax records.
Cash-flow waterfall
monthlySold comps — $/sqft
last 12 mo · ≤1 miLoading sold comps…