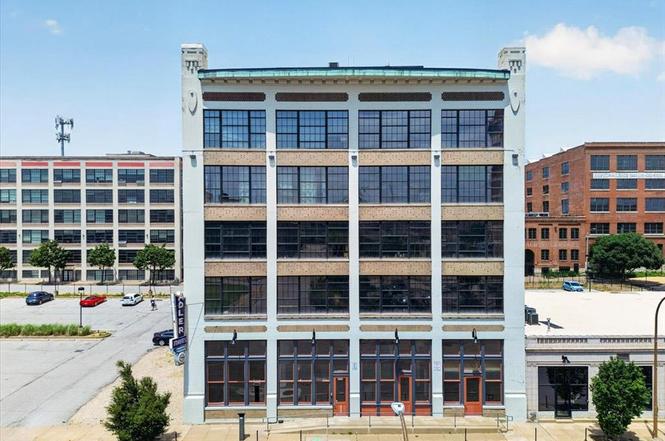
2035 Washington Ave #202 · St. Louis, MO
Flood risk 1/10 · Minimal
- FEMA flood zone
- X (unshaded)
- Chance of flooding over 30 yrs
- 0.0%
- Est. flood insurance / yr
- $507 – $1,088
Fire risk 1/10 · Minimal
- Est. fire insurance / yr
- $1,054 – $1,958
Heat risk 6/10 · Moderate
- Hot days now (above 109°F)
- 7 days/yr
- Hot days in 30 yrs
- 21 days/yr
Wind risk 2/10 · Minimal
- Chance of severe wind over 30 yrs
- 1.0%
Air-quality risk 3/10 · Minor
- Unhealthy air days now
- 3 days/yr
- Unhealthy air days in 30 yrs
- 4 days/yr
Risk factors via First Street. Map © Google.
Why this score? — see what drove the C- grade
The composite is a weighted blend of 9 inputs, each scored 0–100. Each bar is that input's sub-score; the figure is the points it added to the 100-point composite (weight × sub-score).
- Cash flow +19.4/30.0
- ARV discount +7.5/15.0
- DSCR +6.1/10.0
- Appreciation +5.3/10.0
- Rent growth +4.8/5.0
- 1% rule +4.6/10.0
- Livability +2.5/5.0
- Condition / age +2.5/5.0
- Schools +1.2/10.0
$130,000
🖨 Deal sheet 📄 Offer letter ✓ Due diligence
Listing remarks
Discover urban living at its best in this stylish 1-bedroom loft at 2035 Washington Ave, Unit 202, located in the sought-after Adler Frame Lofts. This unit features the character and charm loft buyers love, with an open floor plan, high ceilings, and large windows that fill the space with natural light. The layout offers flexibility for both comfortable living and entertaining, while maintaining a modern industrial feel. Step outside and enjoy everything Downtown St. Louis has to offer. Just a short walk to Washington Avenue’s vibrant nightlife, popular restaurants, and entertainment venues, plus easy access to CITY PARK soccer stadium and Highway 40 for convenient commuting. Whether
Key facts
- Large windows
- Open floor plan
- High ceilings
Tags
Property features AI
Finance
- HOA & community: Monthly association with management; Fitness center; Storage; Association covers grounds maintenance, parking/road maintenance, roof, and security
Exterior
- Parking: Secured parking; One-car garage
- Security: Key card entry; Association-provided security (see HOA)
- Utilities: Public water; Public sewer; Electricity connected (220 volts)
- Home design: Attached condominium; One story
- Construction: Brick construction
- Exterior features: Subdivided lot
Interior
- Bedrooms: One bedroom on the main level
- Bathrooms: One full bathroom (main level)
- Interior features: Key card entry; Central air conditioning; Electric forced-air heating
Neighborhood map
What this means for you Summary
Snapshot
- This is a 1-bed/1.0-bath condo listed at $130k.
Deal economics
- At list price, monthly cash flow is $144 ($2k/yr) — positive.
- The deal already cash-flows at list — no discount required.
- To meet the 1% rule (rent ≥ 1% of price), the offer needs to be $125k (3.7% below list).
- Recommended offer: $125k (3.7% below list) — sets the bar for 1% rule.
- Cap rate 7.6% vs local median 5.0% in St. Louis — top-decile yield for the area; either an underpriced asset or a hidden risk that comps aren't pricing in. Stress-test before assuming the spread holds.
Location & tenants
- Location reads: area grade C — affects rentability + tenant quality, not the cash-flow math above.
- St. Louis City (urban): math 10% / reading 18% proficiency, ranked #312 of 324 in MO (top 96%) — low school quality limits family demand, transient renter base, plan for 1-2y turnover; 80% free/reduced lunch — lower-income household profile, screen leases tightly.
- Zoned schools: Jefferson Elem. (math 5% / reading 5%, grade F, #1,072 of 1,115 statewide, top 98%, 127 students, 98% FRL); Vashon High (math 2% / reading 2%, grade F, #520 of 521 statewide, top 100%, 568 students, 100% FRL) — zoned schools average 99% FRL vs 80% district-wide (18 pts higher); higher-poverty schools than district average — tighter screening recommended.
- Market conditions: Rents rising fast (+9.2%/yr); 70 active listings in the ZIP; 40 comparable units currently listed for rent nearby; rentals leasing fast (median 8d on market — plan ~1-2 weeks tenant-placement turnaround); lower-income renter base — watch delinquency; 294 units permitted in St. Louis city in 2024 (227 in 5+ unit buildings).
- This rent runs 37% of the median local income ($41k/yr) — at the standard rent-burdened threshold; future hikes will face affordability resistance.
Forward outlook
- In year one you build about $2k of equity ($899 loan paydown + $864 appreciation (0.7% local appreciation)).
- St. Louis County population projected to shrink 6% by 2050 — rents likely to lag national; underwrite the cash flow, not the appreciation.
- At projected returns (0.7% appreciation + 8.0% rent growth), your $36k cash investment doubles in ~6 years — after that, you're playing with house money.
Negotiation context
- Only 3 days on market — expect competitive offers; lowballing is unlikely to land.
Risks & watch-outs
- Watch-outs: built in 1919 — expect roof / HVAC / electrical / plumbing capex.
- Climate carrying-cost: extreme-heat days projected 7→21/yr by 2055 (HVAC capex compounding) — expect insurance premiums to compound above CPI over the hold.
Questions for the listing agent
- Built in 1919 — when were the roof, HVAC, electrical panel, plumbing, and water heater last replaced?
- Any open or pending special assessments — roof, HVAC, plumbing, elevator, façade? What's the per-unit balance and payoff schedule, and is the seller paying it off at close or rolling it to the buyer?
- Is there a deadline driving the sale (1031 exchange, divorce, estate, relocation)? That informs how much negotiation room exists.
- What's the average days-on-market for RENTAL listings here right now (not sales)? A rising rental-DOM trend means longer vacancies and softer asking-rent achievability than the comps imply.
- What's the recent tenant-quality profile in this submarket — average credit score on applications, eviction rate, late-payment / NSF rate, and stable-employment percentage? A property-management company in the area should have these aggregated.
- How much new apartment / multifamily construction is in the pipeline within 1–3 miles? Heavy new supply (>2% of stock underway) typically softens rents 12–24 months out; light construction supports rent growth.
Investment metrics
- 1% rule
- 0.96% ✗
- Cap rate
- 7.63%
- Cash-on-cash
- 4.76%
- DSCR
- 1.21
- GRM
- 8.7
CMA / ARV
No comps found within radius.
Projected returns pro-forma
0.66% appreciation · 8.0% rent growth · sell at horizon
- IRR
- 8.6%
- Equity multiple
- 1.44×
- Total profit
- $16,109
- Equity at exit
- $42,124
- IRR
- 16.0%
- Equity multiple
- 3.14×
- Total profit
- $77,765
- Equity at exit
- $54,275
Cash invested: $36,400 (down + closing). Projections, not guarantees.
Landlord ↔ Tenant lean methodology
- Overall (STATE)
- 81 Strongly Landlord-Friendly
- State Missouri
- 81 Strongly Landlord-Friendly · R+10
- County
- — inherits STATE
- City
- — inherits STATE
ZIP-level market 63103
- Home prices YoY
- 0.6%
- Rents YoY
- 9.2%
- Active inventory
- 70
- Price-to-rent
- 8.7×
Monthly cashflow live
- Estimated rent
- $1,252 high interval (Pro) →
- Mortgage (P&I)
- −$682
- Tax from tax record
- −$109 /mo · $1,307/yr
- Insurance
- −$54
- HOA
- −$0
- Vacancy / Maint / Mgmt
- −$263
- Net cashflow
- $144
Break-even live
UW: 25.0% down · 7.5% · 30yr · 1.5% tax · 5.0% vac · 8.0% maint · 8.0% mgmt
Financing live
Cash to close
- Down payment
- $32,500
- Closing costs
- $3,900
- Reserves months
- —
- Total cash needed
- —
Loan-product check · same deal, 3 products live
Conventional
25% down · 7.5% · 30yr
- Down + closing
- —
- Monthly P&I
- —
- Monthly cashflow
- —
- DSCR
- —
- Eligible?
- —
Personal DTI + credit; lowest rate.
DSCR
20% down · 8.5% · 30yr
- Down + closing
- —
- Monthly P&I
- —
- Monthly cashflow
- —
- DSCR
- —
- Eligible?
- —
No personal income docs; deal must DSCR.
Hard money
10% down · 12.0% · 12mo
- Down + closing
- —
- Monthly P&I
- —
- Monthly cashflow
- —
- DSCR
- —
- Eligible?
- —
Short-term bridge; refi at stabilization.
Rent comps 40 comps
| Address | Beds | Baths | Sqft | Rent | $/sqft | DOM | Units | Dist |
|---|---|---|---|---|---|---|---|---|
| 715 N 21st St St. Louis, MO | 1.0–2.0 | 1.0–2.0 | 900 | $1,125 | $1.25 | 23d | 1 | 0.02mi |
| 2034 Lucas Ave St. Louis, MO | 1.0–2.0 | 1.0 | 1080 | $1,365 | $1.26 | 43d | 1 | 0.03mi |
| 2206 Lucas Ave St. Louis, MO | 1.0–2.0 | 1.0–2.0 | 1047 | $1,250 | $1.19 | 1d | 20 | 0.09mi |
| 2217 Locust St Saint Louis, MO | 2.0 | 2.0 | 830 | $1,475 | $1.78 | 43d | 1 | 0.15mi |
| 1900 Washington Ave Saint Louis, MO | 1.0–2.0 | 1.0–2.0 | 960 | $1,295 | $1.35 | 1d | 12 | 0.15mi |
| 1901 Washington Ave Saint Louis, MO | 1.0–2.0 | 1.0–2.0 | 1076 | $1,250 | $1.16 | 4d | 38 | 0.16mi |
| 416 N 23rd St St. Louis, MO | 1.0–2.0 | 1.0 | 780 | $1,275 | $1.63 | 4d | 23 | 0.16mi |
| 2200 Locust St Saint Louis, MO | 1.0–2.0 | 1.0–1.5 | 862 | $1,395 | $1.62 | 3d | 6 | 0.17mi |
| 1815 Locust St Saint Louis, MO | 1.0–2.0 | 1.0–2.0 | 983 | $1,235 | $1.26 | 43d | 7 | 0.21mi |
| 1800 Washington Ave Saint Louis, MO | 1.0–2.0 | 1.0–2.0 | 927 | $1,115 | $1.20 | 43d | 13 | 0.23mi |
| 2323 Locust St Saint Louis, MO | 1.0–2.0 | 1.0 | 1239 | $1,250 | $1.01 | 43d | 2 | 0.23mi |
| 2605-2637 Washington Ave St. Louis, MO | 1.0–2.0 | 1.0–2.0 | 775 | $1,350 | $1.74 | 11d | 7 | 0.27mi |
| 1706 Washington Ave St. Louis, MO | 1.0–2.0 | 1.0–2.0 | 997 | $1,241 | $1.24 | 1d | 10 | 0.30mi |
| 1717 Olive St Saint Louis, MO | 2.0 | 1.0–2.0 | 957 | $2,200 | $2.30 | 1d | 64 | 0.31mi |
| 1635 Washington Ave Saint Louis, MO | 1.0–2.0 | 1.0 | 1135 | $1,395 | $1.23 | 2d | 4 | 0.34mi |
| 210 N 17th St Saint Louis, MO | 1.0 | 1.0 | 648 | $950 | $1.47 | 43d | 1 | 0.37mi |
| 2650 Locust St St. Louis, MO | 1.0 | 1.0 | 780 | $1,375 | $1.76 | 2d | 2 | 0.37mi |
| 110 N 17th St Saint Louis, MO | 2.0 | 1.0 | 653 | $805 | $1.23 | 7d | 1 | 0.42mi |
| 1531 Washington Ave St. Louis, MO | 1.0–2.0 | 1.0 | 656 | $1,020 | $1.55 | 1d | 5 | 0.44mi |
| 1501 Locust St Saint Louis, MO | 1.0 | 1.0 | 1002 | $1,200 | $1.20 | 43d | 1 | 0.46mi |
| 1405 Pine St St. Louis, MO | 2.0 | 2.0 | 1020 | $1,240 | $1.22 | 3d | 1 | 0.58mi |
| 1307 Washington Ave St. Louis, MO | 1.0–2.0 | 1.0 | 1261 | $1,125 | $0.89 | 7d | 17 | 0.59mi |
| 1300 Convention Plz Saint Louis, MO | 2.0 | 1.0 | 877 | $1,188 | $1.35 | 43d | 1 | 0.64mi |
| 1226 Olive St St. Louis, MO | 1.0–2.0 | 1.0–2.0 | 1157 | $1,449 | $1.25 | 1d | 2 | 0.66mi |
| 1133 Washington Ave St. Louis, MO | 2.0 | 1.0–2.0 | 637 | $1,034 | $1.62 | 43d | 1 | 0.72mi |
| 300 N Tucker Blvd St. Louis, MO | 1.0–2.0 | 1.0–2.0 | 1013 | $1,200 | $1.18 | 1d | 10 | 0.74mi |
| 300 N Tucker Blvd Apt 406 St. Louis, MO | 1.0 | 1.0 | 834 | $1,250 | $1.50 | 14d | 1 | 0.74mi |
| 1110 Washington Ave Saint Louis, MO | 1.0–2.0 | 1.0–2.0 | 1006 | $995 | $0.99 | 2d | 19 | 0.77mi |
| 1115 Carr St St. Louis, MO | 1.0–2.0 | 1.0 | 747 | $975 | $1.30 | 4d | 13 | 0.82mi |
| 1014 Locust St Saint Louis, MO | 1.0–2.0 | 1.0–2.0 | 1110 | $1,430 | $1.29 | 1d | 2 | 0.83mi |
| 1000 Washington Ave Saint Louis, MO | 1.0–2.0 | 1.0–2.0 | 959 | $1,200 | $1.25 | 1d | 24 | 0.83mi |
| 917 Locust St St. Louis, MO | 1.0 | 1.0 | 683 | $1,305 | $1.91 | 16d | 3 | 0.89mi |
| 206 N 9th St Unit 502 St. Louis, MO | 1.0 | 1.0 | 626 | $895 | $1.43 | 43d | 1 | 0.95mi |
| 206 N 9th St Unit 307 St. Louis, MO | 2.0 | 1.0 | 897 | $1,100 | $1.23 | 4d | 1 | 0.95mi |
| 206 N 9th St Unit 514 St. Louis, MO | 1.0 | 1.0 | 675 | $975 | $1.44 | 43d | 1 | 0.95mi |
| 206 N 9th St Unit 1306 St. Louis, MO | 2.0 | 2.0 | 897 | $1,250 | $1.39 | 43d | 1 | 0.95mi |
| 206 N 9th St Unit 1207 St. Louis, MO | 2.0 | 1.0 | 843 | $1,100 | $1.30 | 43d | 1 | 0.95mi |
| 206 N 9th St Unit 509 St. Louis, MO | 1.0 | 1.0 | 701 | $925 | $1.32 | 43d | 1 | 0.95mi |
| 206 N 9th St Unit 916 St. Louis, MO | 2.0 | 2.0 | 914 | $1,250 | $1.37 | 23d | 1 | 0.95mi |
| 206 N 9th St Unit 712 St. Louis, MO | 1.0 | 1.0 | 783 | $925 | $1.18 | 7d | 1 | 0.95mi |
HOA detail condo
- Monthly dues
- $0 · $0/yr
- Assessments
- None detected in remarks — confirm with the listing agent.
Listing history 4 events
-
2026-06-18days on market $130,000 Coming Soon 3 DOM
-
2026-06-17days on market $130,000 Coming Soon 2 DOM
-
2026-06-16remarks 693-char remark
-
2026-06-16$130,000 Coming Soon 1 DOM
ⓘ Source: listings_history table (triggers on properties + properties_extension) + one-shot
backfill from property_details.listing_events for pre-trigger history.
Tax reassessment forecast MO · Resets to sale price
- Current annual tax
- $1,307 · $109/mo
- Projected year-2 tax
- $1,307 · $109/mo
- Expected delta
- $0/yr ($0/mo · 0.0%)
ⓘ Screening estimate from a state-policy table — verify with the county assessor before closing.
Climate risk First Street
- Flood 1/10 Low FEMA zone X (unshaded) · 0% chance over 30 yrs
- Wildfire 1/10 Low
- Heat 6/10 Major 7 d/yr ≥109°F today · 21 d/yr by 30 yrs out
- Wind 2/10 Low 100% chance of damaging wind over 30 yrs
- Air quality 3/10 Moderate 3 unhealthy d/yr today · 4 by 30 yrs out
Nearby sold comps map
Loading sold comps map…
Walkable amenities ~0.75 mi
Loading nearby amenities…
Taxation est. · year 1
- Rental income
- $15,025
- − Mortgage interest
- −$7,282
- − Property taxes
- −$1,307
- − Insurance
- −$650
- − Repairs & maintenance
- −$1,202
- − Management
- −$1,202
- − Depreciation
- −$3,782
- Taxable loss
- −$399
- Est. tax savings @ 24.0%
- +$96
- After-tax cash flow
- $1,828/yr
For passive investors: Depreciation is non-cash, so a rental often shows a tax loss while cash-flowing — sheltering income. Rental losses are passive: they offset passive income freely, and up to $25,000/yr can offset ordinary (W-2) income if you actively participate and your MAGI is under $100k (phasing out to $0 by $150k); unused losses carry forward. On sale, claimed depreciation is recaptured at up to 25%, and gains may owe capital-gains tax (a 1031 exchange can defer both). Figures are a year-1 estimate at your 24.0% rate — not tax advice; consult a CPA.
Schools (NCES district)
- District
- St. Louis City
- NCES district ID
- 2929280
- Math proficiency
- 10% ▼ -6.00%
- Reading proficiency
- 18% ▼ -3.00%
- Median HH income
- $35,685
- Composite
- 11.54/100
- National rank
- #9699
- State rank
- #312 of 324 in MO
Livability — St. Louis
No livability data for this city. (Only ~50 U.S. cities are tracked.)
Census & demographics
- Census place
- St. Louis, MO
- County
- Saint Louis City · 254,015 people
- City population
- 283,259
- Metro
- St. Louis, MO-IL
- Population (ZIP)
- 8,778
- Household income
- $40,943
- Rent vs Own
- Severe rent burden
- 960.0
Population outlook (St. Louis County) Hauer SSP2
- Today (2025)
- 315,737 people
- By 2030
- 313,865 · -0.6%
- By 2040
- 305,439 · -3.3%
- By 2050
- 296,529 · -6.1%
- By 2075
- 271,028 · -14.2%
- By 2100
- 255,359 · -19.1%
Race, ethnicity, and origin ACS 2023
- Neighborhood character
- Diverse neighborhood (Simpson 0.65)
- Race & ethnicity
- White 43% Black 40% Asian 8% Two or more races 6% Hispanic / Latino 3%
- Common ancestry
- Romanian 3% Lithuanian 2% Italian 2%
- Foreign-born
- 8% · Canada, China
- Languages at home
- 87% English-only · Other Indo-European 4% Spanish 3% Arabic 1%
Political lean MEDSL · St. Louis
- 2024 margin
- Solid D (+64.7) · D 81.4% · R 16.7% · Other 2.0%
- 2008→2024 swing
- -3.5pp toward R · 2008: 68.2pp · 2024: 64.7pp
- All cycles
- 2024: D+64.7 2020: D+66.2 2016: D+63.7 2012: D+66.6 2008: D+68.2
Not yet ingested
- Civics
- —
Market trends
- HPI YoY
- ▲ 0.66%
- Current HPI
- 116.4477
- Rent YoY
- ▲ 9.20%
- Metro
- St. Louis, MO-IL
- State GDP YoY
- ▲ 1.84%
- F500 in state
- 20
Industry mix (Fortune 500 HQ in MO)
| Industry | F500 HQs | Revenue |
|---|---|---|
| Healthcare | 1 | $163B |
|
||
| Insurance | 1 | $21B |
|
||
| Industrial Technology | 1 | $17B |
|
||
| Retail | 1 | $16B |
|
||
| Industrial Distribution | 1 | $10B |
|
||
| Utilities | 1 | $9B |
|
||
Price history
1 event — show timeline
- 2026-06-15 Coming Soon $130,000 MARIS as Distributed by MLS Grid
Property tax history
+2.0%/yrLatest (2024): $1,307 · +4.7% YoY. Source: county tax records.
Cash-flow waterfall
monthlySold comps — $/sqft
last 12 mo · ≤1 miLoading sold comps…