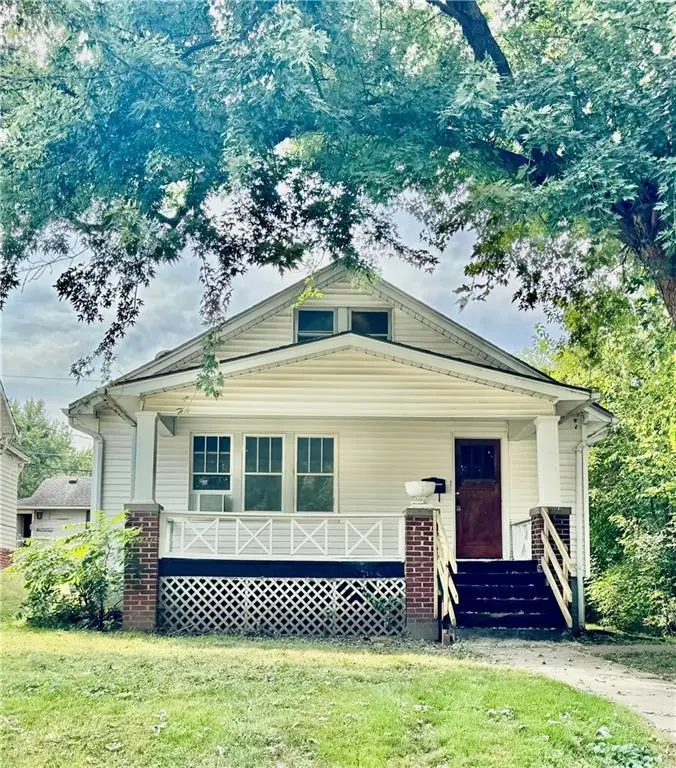
3006 Messanie St · St. Joseph, MO
Flood risk 1/10 · Minimal
- FEMA flood zone
- X
- Chance of flooding over 30 yrs
- 0.0%
- Est. flood insurance / yr
- $473 – $860
Fire risk 1/10 · Minimal
- Est. fire insurance / yr
- $1,054 – $1,958
Heat risk 4/10 · Minor
- Hot days now (above 106°F)
- 7 days/yr
- Hot days in 30 yrs
- 16 days/yr
Wind risk 2/10 · Minimal
- Chance of severe wind over 30 yrs
- —
Air-quality risk 2/10 · Minimal
- Unhealthy air days now
- 1 days/yr
- Unhealthy air days in 30 yrs
- 1 days/yr
Risk factors via First Street. Map © Google.
Why this score? — see what drove the D grade
The composite is a weighted blend of 9 inputs, each scored 0–100. Each bar is that input's sub-score; the figure is the points it added to the 100-point composite (weight × sub-score).
- Cash flow +15.6/30.0
- ARV discount +8.2/15.0
- DSCR +4.8/10.0
- 1% rule +3.3/10.0
- Schools +2.8/10.0
- Rent growth +2.5/5.0
- Livability +2.5/5.0
- Condition / age +2.5/5.0
- Appreciation +0.0/10.0
$139,000
🖨 Deal sheet (PDF) 📄 Offer letter ✓ Due diligence
Listing remarks MLS
Charming 1.5 story home with beautiful hardwood floors!
Key facts
- 6,250 sq ft lot
- Built 1917
- Listed 239 days
Neighborhood map
What this means for you Summary
Snapshot
- This is a 4-bed/2.0-bath single-family listed at $139k.
Deal economics
- At list price, monthly cash flow is $57 ($689/yr) — positive.
- The deal already cash-flows at list — no discount required.
- To meet the 1% rule (rent ≥ 1% of price), the offer needs to be $115k (17.0% below list).
- Recommended offer: $115k (17.0% below list) — sets the bar for 1% rule.
- Cap rate 6.8% vs local median 4.7% in St. Joseph — top-decile yield for the area; either an underpriced asset or a hidden risk that comps aren't pricing in. Stress-test before assuming the spread holds.
Location & tenants
- Location reads: area grade D — affects rentability + tenant quality, not the cash-flow math above.
- St. Joseph (urban): math 28% / reading 38% proficiency, ranked #241 of 324 in MO (top 74%) — families likely to look elsewhere, expect single-tenant / working-renter base with shorter leases.
- Market conditions: 97 active listings in the ZIP; 3 comparable units currently listed for rent nearby; rentals lingering (median 45d on market — plan ~5-8 weeks vacancy on turnover, expect pricing pressure); 100% of comp listings sitting > 30 days — soft ceiling on asking rent; 70 units permitted in Buchanan County in 2024 (0 in 5+ unit buildings).
Forward outlook
- Local home prices are declining (-3.0%/yr); year-one equity from $961 of loan paydown is wiped out by about $4k of value loss. Plan a longer hold.
- Buchanan County population projected to shrink 6% by 2050 — rents likely to lag national; underwrite the cash flow, not the appreciation.
Negotiation context
- It's been on market 240 days — a 12% lower offer ($122k) is reasonable based on typical stale-listing flexibility.
- 5 sale attempts since 13y ago; this cycle's ask has dropped $11k (7%) from the opening price — seller is motivated, your offer sets the floor, not the list.
Risks & watch-outs
- Watch-outs: built in 1917 — expect roof / HVAC / electrical / plumbing capex.
Questions for the listing agent
- It's been on market 240 days. Have you received any prior offers? Is the seller open to a 17% concession, seller financing, or rate buy-down credit?
- Built in 1917 — when were the roof, HVAC, electrical panel, plumbing, and water heater last replaced?
- Why hasn't it sold? Are there any deal-killer items the seller is aware of (foundation, flood, title, zoning, code violations)?
- Is there a deadline driving the sale (1031 exchange, divorce, estate, relocation)? That informs how much negotiation room exists.
- The area grade is low — what's the realistic commute time and amenity access for the typical tenant pool here? Any planned neighborhood developments (good or bad) we should know about?
- What's the average days-on-market for RENTAL listings here right now (not sales)? A rising rental-DOM trend means longer vacancies and softer asking-rent achievability than the comps imply.
- What's the recent tenant-quality profile in this submarket — average credit score on applications, eviction rate, late-payment / NSF rate, and stable-employment percentage? A property-management company in the area should have these aggregated.
- How much new for-sale + rental construction is in the pipeline within 1–3 miles? Heavy new supply typically softens prices + rents 12–24 months out; constrained supply supports both.
Investment metrics
- 1% rule
- 0.83% ✗
- Cap rate
- 6.79%
- Cash-on-cash
- 1.77%
- DSCR
- 1.08
- GRM
- 10.0
CMA / ARV
- ARV (median comp)
- $141,118
- List price
- $139,000
- Delta
- -1.50%
- Verdict
- FAIR
- Comps
- 20 within 1.0 mi
Show comp detail 12 sales within ~0.75 mi
| Address | Dist | Beds/Ba | Sqft | Sold | Price | $/sf | Match |
|---|---|---|---|---|---|---|---|
| 3117 Sylvanie St | 0.21mi | 3/2.0 (-1) | 1,120 (-3%) | 3mo | $189,900 | $170 | 78 |
| 2906 Lafayette St | 0.32mi | 3/2.0 (-1) | 1,165 (+1%) | 2mo | $145,000 | $124 | 76 |
| 3223 Penn St | 0.51mi | 3/1.0 (-1) | 1,140 (-1%) | 1mo | $156,000 | $137 | 65 |
| 2821 Edmond St | 0.32mi | 3/2.0 (-1) | 1,045 (-9%) | 6mo | $154,900 | $148 | 60 |
| 2828 Francis St | 0.39mi | 3/2.0 (-1) | 1,020 (-12%) | 3mo | $127,900 | $125 | 55 |
| 2627 Renick St | 0.68mi | 5/1.0 (+1) | 1,152 (0%) | 7mo | $99,000 | $86 | 53 |
| 3019 Edmond St | 0.27mi | 3/1.0 (-1) | 1,300 (+13%) | 5mo | $155,000 | $119 | 53 |
| 1308 S 32nd St | 0.57mi | 3/1.0 (-1) | 1,063 (-8%) | 4mo | $149,900 | $141 | 48 |
| 2918 Penn St | 0.43mi | 3/1.5 (-1) | 1,286 (+12%) | 7mo | $149,900 | $117 | 48 |
| 1514 S 30th St | 0.65mi | 3/1.5 (-1) | 1,300 (+13%) | 4mo | $219,900 | $169 | 38 |
| 3518 Lafayette St | 0.71mi | 3/1.5 (-1) | 1,307 (+14%) | 2mo | $140,000 | $107 | 36 |
| 2517 Faraon St | 0.72mi | 3/1.0 (-1) | 1,286 (+12%) | 6mo | $85,000 | $66 | 33 |
Match score weights: distance 35% · size 25% · config 20% · recency 20%. Top-matched comps best support the ARV.
Projected returns pro-forma
-3.0% appreciation · 3.0% rent growth · sell at horizon
- IRR
- -13.5%
- Equity multiple
- 0.51×
- Total profit
- $-18,913
- Equity at exit
- $20,725
- IRR
- -4.7%
- Equity multiple
- 0.69×
- Total profit
- $-11,953
- Equity at exit
- $12,018
Cash invested: $38,920 (down + closing). Projections, not guarantees.
Landlord ↔ Tenant lean methodology
- Overall (STATE)
- 81 Strongly Landlord-Friendly
- State Missouri
- 81 Strongly Landlord-Friendly · R+10
- County
- — inherits STATE
- City
- — inherits STATE
ZIP-level market 64501
- Active inventory
- 97
- Price-to-rent
- 10.0×
Monthly cashflow live
- Estimated rent
- $1,154 medium interval (Pro) →
- Mortgage (P&I)
- −$729
- Tax from tax record
- −$67 /mo · $804/yr
- Insurance
- −$58
- HOA
- −$0
- Vacancy / Maint / Mgmt
- −$242
- Net cashflow
- $57
Break-even live
Sensitivity live
| Price | -10% $136 | -5% $97 | +0% $57 | +5% $18 | +10% $-21 |
|---|---|---|---|---|---|
| Rent | -10% $-34 | -5% $12 | +0% $57 | +5% $103 | +10% $149 |
| Rate | -1.0pp $127 | -0.5pp $93 | base $57 | +0.5pp $21 | +1.0pp $-15 |
UW: 25.0% down · 7.5% · 30yr · 1.5% tax · 5.0% vac · 8.0% maint · 8.0% mgmt
Financing live
Cash to close
- Down payment
- $34,750
- Closing costs
- $4,170
- Reserves months
- —
- Total cash needed
- —
Loan-product check · same deal, 3 products live
Conventional
25% down · 7.5% · 30yr
- Down + closing
- —
- Monthly P&I
- —
- Monthly cashflow
- —
- DSCR
- —
- Eligible?
- —
Personal DTI + credit; lowest rate.
DSCR
20% down · 8.5% · 30yr
- Down + closing
- —
- Monthly P&I
- —
- Monthly cashflow
- —
- DSCR
- —
- Eligible?
- —
No personal income docs; deal must DSCR.
Hard money
10% down · 12.0% · 12mo
- Down + closing
- —
- Monthly P&I
- —
- Monthly cashflow
- —
- DSCR
- —
- Eligible?
- —
Short-term bridge; refi at stabilization.
Rent comps 3 comps
| Address | Beds | Baths | Sqft | Rent | $/sqft | DOM | Units | Dist |
|---|---|---|---|---|---|---|---|---|
| 1616 S 25th St Saint Joseph, MO | 3.0 | 1.0 | 1500 | $1,300 | $0.87 | 45d | 1 | 0.93mi |
| 2901 Frederick Ave Saint Joseph, MO | 2.0–3.0 | 1.0 | 900 | $1,000 | $1.11 | 45d | 1 | 1.14mi |
| 303 S 13th St St Joseph, MO | 3.0 | 1.5 | 1000 | $950 | $0.95 | 45d | 1 | 1.34mi |
Listing history 29 events
-
2026-06-19days on market $139,000 Active 240 DOM
-
2026-06-18days on market $139,000 Active 239 DOM
-
2026-06-17days on market $139,000 Active 238 DOM
-
2026-06-16days on market $139,000 Active 237 DOM
-
2026-06-15days on market $139,000 Active 236 DOM
-
2026-06-14days on market $139,000 Active 234 DOM
-
2026-06-12days on market $139,000 Active 233 DOM
-
2026-06-09days on market $139,000 Active 230 DOM
-
2026-06-08days on market $139,000 Active 229 DOM
-
2026-06-07days on market $139,000 Active 228 DOM
-
2026-06-03days on market $139,000 Active 224 DOM
-
2026-06-02days on market $139,000 Active 223 DOM
-
2026-06-01days on market $139,000 Active 222 DOM
-
2026-05-31days on market $139,000 Active 221 DOM
-
2026-05-30days on market $139,000 Active 220 DOM
-
2026-05-04status Active 55-char remark
Show marketing remark (55 chars)
Charming 1.5 story home with beautiful hardwood floors!
-
2026-04-26status Pending 55-char remark
Show marketing remark (55 chars)
Charming 1.5 story home with beautiful hardwood floors!
-
2026-04-03status Active 55-char remark
Show marketing remark (55 chars)
Charming 1.5 story home with beautiful hardwood floors!
-
2026-03-12status Pending 55-char remark
Show marketing remark (55 chars)
Charming 1.5 story home with beautiful hardwood floors!
-
2026-03-06price $139,000 55-char remark
Show marketing remark (55 chars)
Charming 1.5 story home with beautiful hardwood floors!
-
2026-02-05price $144,000 55-char remark
Show marketing remark (55 chars)
Charming 1.5 story home with beautiful hardwood floors!
-
2025-10-15price $145,000 55-char remark
Show marketing remark (55 chars)
Charming 1.5 story home with beautiful hardwood floors!
-
2025-09-23$150,000 Active 55-char remark
Show marketing remark (55 chars)
Charming 1.5 story home with beautiful hardwood floors!
-
2015-01-06soldstatus
-
2015-01-05soldstatus 275-char remark
Show marketing remark (275 chars)
All new and updated 4 bedroom, 2 baths, home with main floor laundry, beautiful wood floors, huge kitchen and full basement for storage. Off street parking with garage. Includes Refrigerator, dishwasher, large stove, washer, & dryer. Upstairs has a large bonus playroom.
-
2014-06-17$84,000 275-char remark
Show marketing remark (275 chars)
All new and updated 4 bedroom, 2 baths, home with main floor laundry, beautiful wood floors, huge kitchen and full basement for storage. Off street parking with garage. Includes Refrigerator, dishwasher, large stove, washer, & dryer. Upstairs has a large bonus playroom.
-
2013-09-12soldstatus
-
2013-04-29$44,900
-
1994-07-15soldstatus
ⓘ Source: listings_history table (triggers on properties + properties_extension) + one-shot
backfill from property_details.listing_events for pre-trigger history.
Tax reassessment forecast MO · Resets to sale price
- Current annual tax
- $804 · $67/mo
- Projected year-2 tax
- $1,348 · $112/mo
- Expected delta
- +$544/yr (+$45/mo · 67.7%)
ⓘ Screening estimate from a state-policy table — verify with the county assessor before closing.
Climate risk First Street
- Flood 1/10 Low FEMA zone X · 0% chance over 30 yrs
- Wildfire 1/10 Low
- Heat 4/10 Moderate 7 d/yr ≥106°F today · 16 d/yr by 30 yrs out
- Wind 2/10 Low
- Air quality 2/10 Low 1 unhealthy d/yr today · 1 by 30 yrs out
Nearby sold comps map
Loading sold comps map…
Walkable amenities ~0.75 mi
Loading nearby amenities…
Taxation est. · year 1
- Rental income
- $13,842
- − Mortgage interest
- −$7,786
- − Property taxes
- −$804
- − Insurance
- −$695
- − Repairs & maintenance
- −$1,107
- − Management
- −$1,107
- − Depreciation
- −$4,044
- Taxable loss
- −$1,701
- Est. tax savings @ 24.0%
- +$408
- After-tax cash flow
- $1,098/yr
For passive investors: Depreciation is non-cash, so a rental often shows a tax loss while cash-flowing — sheltering income. Rental losses are passive: they offset passive income freely, and up to $25,000/yr can offset ordinary (W-2) income if you actively participate and your MAGI is under $100k (phasing out to $0 by $150k); unused losses carry forward. On sale, claimed depreciation is recaptured at up to 25%, and gains may owe capital-gains tax (a 1031 exchange can defer both). Figures are a year-1 estimate at your 24.0% rate — not tax advice; consult a CPA.
Schools (NCES district)
- District
- St. Joseph
- NCES district ID
- 2927060
- Math proficiency
- 28% ▼ -6.00%
- Reading proficiency
- 38% ▼ -1.00%
- Median HH income
- $43,007
- Composite
- 27.99/100
- National rank
- #6853
- State rank
- #241 of 324 in MO
Livability — St. Joseph
No livability data for this city. (Only ~50 U.S. cities are tracked.)
Census & demographics
- Census place
- St. Joseph, MO
- County
- Buchanan County · 32,150 people
- City population
- 44,382
- Metro
- St. Joseph, MO-KS
- Population (ZIP)
- 10,689
- Household income
- $46,731
- Rent vs Own
- Severe rent burden
- 721.0
Population outlook (Buchanan County) Hauer SSP2
- Today (2025)
- 89,041 people
- By 2030
- 88,401 · -0.7%
- By 2040
- 86,220 · -3.2%
- By 2050
- 83,603 · -6.1%
- By 2075
- 76,750 · -13.8%
- By 2100
- 67,623 · -24.1%
Race, ethnicity, and origin ACS 2023
- Neighborhood character
- Predominantly White (69%)
- Race & ethnicity
- White 69% Black 12% Hispanic / Latino 11% Two or more races 9%
- Hispanic origin (detail)
- Mexican 6% Puerto Rican 1%
- Common ancestry
- Italian 3% Romanian 1% Slovak 1%
- Foreign-born
- 7% · Canada, China
- Languages at home
- 89% English-only · Spanish 7% Arabic 1%
Political lean MEDSL · Buchanan
- 2024 margin
- Strong R (+28.0) · D 35.2% · R 63.3% · Other 1.5%
- 2008→2024 swing
- -28.2pp toward R · 2008: 0.1pp · 2024: -28.0pp
- All cycles
- 2024: R+28.0 2020: R+24.6 2016: R+26.2 2012: R+8.7 2008: D+0.1
Not yet ingested
- Civics
- —
Market trends
- HPI YoY
- ▼ -150.20%
- Current HPI
- 157.8706
- Rent YoY
- —
- Metro
- St. Joseph, MO-KS
- State GDP YoY
- ▲ 1.84%
- F500 in state
- 20
Industry mix (Fortune 500 HQ in MO)
| Industry | F500 HQs | Revenue |
|---|---|---|
| Healthcare | 1 | $163B |
|
||
| Insurance | 1 | $21B |
|
||
| Industrial Technology | 1 | $17B |
|
||
| Retail | 1 | $16B |
|
||
| Industrial Distribution | 1 | $10B |
|
||
| Utilities | 1 | $9B |
|
||
Price history
+209.6% since first listed14 events — show timeline
- 2026-05-04 Relisted — Heartland MLS as Distributed by MLS Grid
- 2026-04-26 Pending — Heartland MLS as Distributed by MLS Grid
- 2026-04-03 Relisted — Heartland MLS as Distributed by MLS Grid
- 2026-03-12 Pending — Heartland MLS as Distributed by MLS Grid
- 2026-03-06 Price Changed $139,000 Heartland MLS as Distributed by MLS Grid
- 2026-02-05 Price Changed $144,000 Heartland MLS as Distributed by MLS Grid
- 2025-10-15 Price Changed $145,000 Heartland MLS as Distributed by MLS Grid
- 2025-09-23 Listed $150,000 Heartland MLS as Distributed by MLS Grid
- 2015-01-06 Sold (Public Records) — Public Records
- 2015-01-05 Sold (MLS) — Heartland MLS as Distributed by MLS Grid
- 2014-06-17 Listed $84,000 Heartland MLS as Distributed by MLS Grid
- 2013-09-12 Sold (MLS) — Heartland MLS as Distributed by MLS Grid
- 2013-04-29 Listed $44,900 Heartland MLS as Distributed by MLS Grid
- 1994-07-15 Sold (Public Records) — Public Records
Property tax history
+1.6%/yrLatest (2025): $804 · +8.0% YoY. Source: county tax records.
Cash-flow waterfall
monthlySold comps — $/sqft
last 12 mo · ≤1 miLoading sold comps…