 10-Plex
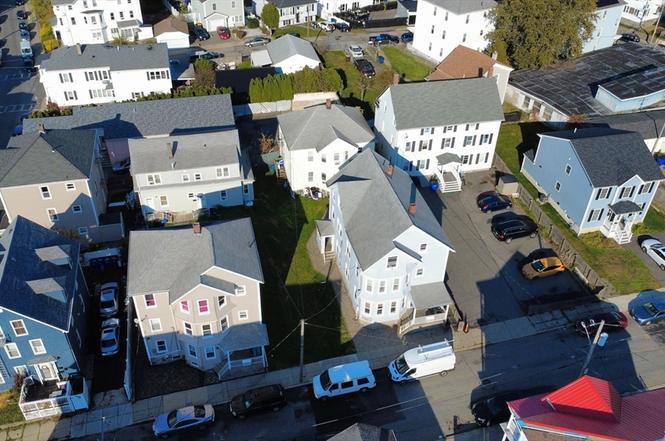
14-28 Downing St · Fall River, MA
Flood risk 1/10 · Minimal
- FEMA flood zone
- X (unshaded)
- Chance of flooding over 30 yrs
- 0.0%
- Est. flood insurance / yr
- $473 – $860
Fire risk 1/10 · Minimal
- Est. fire insurance / yr
- $915 – $1,699
Heat risk 5/10 · Moderate
- Hot days now (above 97°F)
- 7 days/yr
- Hot days in 30 yrs
- 15 days/yr
Wind risk 8/10 · Major
- Chance of severe wind over 30 yrs
- 80.0%
Air-quality risk 3/10 · Minor
- Unhealthy air days now
- 3 days/yr
- Unhealthy air days in 30 yrs
- 3 days/yr
Risk factors via First Street. Map © Google.
Why this score? — see what drove the F grade
The composite is a weighted blend of 9 inputs, each scored 0–100. Each bar is that input's sub-score; the figure is the points it added to the 100-point composite (weight × sub-score).
- Cash flow +10.6/30.0
- ARV discount +7.5/15.0
- DSCR +3.1/10.0
- Livability +3.1/5.0
- Rent growth +2.5/5.0
- Condition / age +2.5/5.0
- Schools +1.9/10.0
- 1% rule +1.8/10.0
- Appreciation +0.0/10.0
$2,000,000
🖨 Deal sheet (PDF) 📄 Offer letter ✓ Due diligence
Multi-family units
County records classify this as Multi-Family (2-4 Unit). Listing-text estimate: 10 units. estimate disagrees with records
Listing remarks MLS
Turnkey 3 family income property, priced to sell. Located close to stores, parks and highways. Nothing to do but move in and collect rent. Portfolio sale also available with 14, 18 and 26 Downing. First showings are Saturday 3/6//21 between 12-1 and Sunday 3/7/21 between 12-1.
Key facts
- Vinyl siding
- Granite countertops
- Vinyl plank floors
Tags
Property features AI
Exterior
- Parking: On-street parking
- Utilities: Public sewer; Public water; 110-volt electric service
- Home design: 5–9 family multiunit property; 6 stories
- Construction: Stone construction; Stone foundation; Built (year per public records)
- Exterior features: Corner lot; Public transportation and park nearby
Interior
- Bathrooms: 10 full bathrooms
- Interior features: Total of 52 rooms; Unfinished basement
Neighborhood map
What this means for you Summary
Snapshot
- This is a 10 × 1-bed/?-bath units multifamily listed at $2.00M.
Deal economics
- At list price, monthly cash flow is $-970 ($-12k/yr) — negative. Per door: $-97/mo.
- To cash-flow at today's rent, offer at most $1.83M (8.6% below list).
- To meet the 1% rule (rent ≥ 1% of price), the offer needs to be $1.36M (32.2% below list).
- Recommended offer: $1.36M (32.2% below list) — sets the bar for 1% rule.
- Cap rate 5.7% vs local median 3.5% in Fall River — top-decile yield for the area; either an underpriced asset or a hidden risk that comps aren't pricing in. Stress-test before assuming the spread holds.
Location & tenants
- Location reads 61/100 on livability (#221 in MA) — a middle-class / working-renter tenant base. Strengths: health & safety A+; Watch: cost of living D+, crime F, commute F.
- Fall River (suburban): math 17% / reading 28% proficiency, ranked #288 of 302 in MA (top 95%) — low school quality limits family demand, transient renter base, plan for 1-2y turnover; 68% free/reduced lunch — lower-income household profile, screen leases tightly.
- Zoned schools: Henry Lord Community School (math 14% / reading 21%, grade F, #811 of 938 statewide, top 87%, 815 students, 0% FRL); Talbot Innovation School (math 7% / reading 13%, grade F, #291 of 305 statewide, top 97%, 533 students, 0% FRL); B M C Durfee High (math 19% / reading 34%, grade F, #280 of 343 statewide, top 82%, 2,460 students, 0% FRL) — zoned schools average 0% FRL vs 68% district-wide (68 pts lower); this property's tenant base skews higher-income than the district average.
- Market conditions: 38 active listings in the ZIP; 760 units permitted in Bristol County in 2024 (142 in 5+ unit buildings).
- At $13,561/mo this rent would consume 342% of the median local household income ($48k/yr) (locally 1335% of renters already pay >50% of income on rent) — very limited rent-growth headroom before tenants either downsize or default.
Forward outlook
- Local home prices are declining (-3.0%/yr); year-one equity from $14k of loan paydown is wiped out by about $60k of value loss. Plan a longer hold.
- Bristol County population projected to shrink 3% by 2050 — rents likely to lag national; underwrite the cash flow, not the appreciation.
Negotiation context
- It's been on market 108 days — a 9% lower offer ($1.82M) is reasonable based on typical stale-listing flexibility.
- 5 sale attempts since 20y ago with the ask held roughly flat each time — persistent listings suggest the price (not the market) is what's stuck; bring a comps-based counter.
- Current owner paid $275k; list at $2.00M implies a 627% gain — meaningful room to come down on a strong offer.
Risks & watch-outs
- Watch-outs: built in 1900 — expect roof / HVAC / electrical / plumbing capex.
- Climate carrying-cost: severe wind risk, 80% chance of damaging wind over 30y; extreme-heat days projected 7→15/yr by 2055 (HVAC capex compounding) — expect insurance premiums to compound above CPI over the hold.
Questions for the listing agent
- What do current leases actually rent for vs. the listed asking? Can we see a recent rent roll and the last 12 months of T-12 income?
- It's been on market 108 days. Have you received any prior offers? Is the seller open to a 32% concession, seller financing, or rate buy-down credit?
- Can we see the unit-by-unit rent roll, current vacancy, and any below-market leases? What's the average tenancy length?
- What capital expenditures (roof, boiler, parking lot, exteriors) have been made in the last 5 years, and what's planned in the next 2?
- Built in 1900 — when were the roof, HVAC, electrical panel, plumbing, and water heater last replaced?
- Why hasn't it sold? Are there any deal-killer items the seller is aware of (foundation, flood, title, zoning, code violations)?
- Is there a deadline driving the sale (1031 exchange, divorce, estate, relocation)? That informs how much negotiation room exists.
- Schools are D-rated, which usually means shorter tenancies and higher turnover. Who's the typical renter profile here, and what's been the actual vacancy rate?
- Crime grade is F in this area — have there been break-ins, vandalism, or insurance claims at this property in the last 3 years? What carrier currently insures it and at what premium?
- The area grade is low — what's the realistic commute time and amenity access for the typical tenant pool here? Any planned neighborhood developments (good or bad) we should know about?
- What's the average days-on-market for RENTAL listings here right now (not sales)? A rising rental-DOM trend means longer vacancies and softer asking-rent achievability than the comps imply.
- What's the recent tenant-quality profile in this submarket — average credit score on applications, eviction rate, late-payment / NSF rate, and stable-employment percentage? A property-management company in the area should have these aggregated.
- How much new apartment / multifamily construction is in the pipeline within 1–3 miles? Heavy new supply (>2% of stock underway) typically softens rents 12–24 months out; light construction supports rent growth.
Investment metrics
- 1% rule
- 0.68% ✗
- Cap rate
- 5.71%
- Cash-on-cash
- -2.08%
- DSCR
- 0.91
- GRM
- 12.3
CMA / ARV
- ARV (on-the-fly)
- $649,047
- Comps found
- 12
Show comp detail 12 sales within ~0.75 mi
| Address | Dist | Beds/Ba | Sqft | Sold | Price | $/sf | Match |
|---|---|---|---|---|---|---|---|
| 90 Hargraves St | 0.35mi | 5/3.0 (-1) | 2,991 (0%) | 7mo | $635,000 | $212 | 73 |
| 37 Eaton St | 0.66mi | 6/3.0 | 2,955 (-1%) | 6mo | $625,000 | $212 | 63 |
| 10 Choate St | 0.47mi | 6/4.0 | 2,865 (-4%) | 6mo | $636,500 | $222 | 62 |
| 68 Goss | 0.15mi | 6/2.0 | 2,689 (-10%) | 12mo | $610,000 | $227 | 62 |
| 157 Earle St | 0.56mi | 6/3.0 | 3,198 (+7%) | 3mo | $714,900 | $224 | 60 |
| 682 Eastern Ave | 0.58mi | 6/3.0 | 2,923 (-2%) | 15mo | $635,000 | $217 | 57 |
| 232 Harrison St | 0.34mi | 7/4.0 (+1) | 3,150 (+5%) | 16mo | $645,000 | $205 | 54 |
| 146 18th St | 0.40mi | 7/3.0 (+1) | 3,271 (+9%) | 12mo | $703,500 | $215 | 51 |
| 770 Bedford St | 0.46mi | 6/2.0 | 3,309 (+11%) | 12mo | $560,000 | $169 | 47 |
| 528 Eastern Ave | 0.44mi | 5/2.0 (-1) | 2,714 (-9%) | 13mo | $625,000 | $230 | 44 |
| 49 Plain St | 0.48mi | 6/3.0 | 2,567 (-14%) | 12mo | $510,000 | $199 | 44 |
| 310 Alden St | 0.55mi | 6/3.0 | 2,598 (-13%) | 11mo | $630,000 | $242 | 43 |
Match score weights: distance 35% · size 25% · config 20% · recency 20%. Top-matched comps best support the ARV.
Projected returns pro-forma
-3.0% appreciation · 3.0% rent growth · sell at horizon
- IRR
- -19.8%
- Equity multiple
- 0.31×
- Total profit
- $-386,988
- Equity at exit
- $298,207
- IRR
- -12.8%
- Equity multiple
- 0.25×
- Total profit
- $-421,056
- Equity at exit
- $172,923
Cash invested: $560,000 (down + closing). Projections, not guarantees.
Landlord ↔ Tenant lean methodology
- Overall (STATE)
- 20 Strongly Tenant-Friendly
- State Massachusetts
- 20 Strongly Tenant-Friendly · D+15
- County
- — inherits STATE
- City
- — inherits STATE
ZIP-level market 02723
- Home prices YoY
- -16.9%
- Active inventory
- 38
- Price-to-rent
- 122.9×
Monthly cashflow live
- Estimated rent
- $13,561 medium interval (Pro) →
- Mortgage (P&I)
- −$10,488
- Tax from tax record
- −$362 /mo · $4,342/yr
- Insurance
- −$833
- HOA
- −$0
- Vacancy / Maint / Mgmt
- −$2,848
- Net cashflow
- $-970
Break-even live
Sensitivity live
| Price | -10% $162 | -5% $-404 | +0% $-970 | +5% $-1,536 | +10% $-4,491 |
|---|---|---|---|---|---|
| Rent | -10% $-2,042 | -5% $-1,506 | +0% $-970 | +5% $-435 | +10% $101 |
| Rate | -1.0pp $37 | -0.5pp $-462 | base $-970 | +0.5pp $-1,488 | +1.0pp $-2,016 |
10-unit breakdown (identical units grouped — click to expand)
| Units | Beds | Baths | Est. rent |
|---|---|---|---|
| 10× units | 1 | — | $13,560 |
| #1 | 1 | — | $1,356 |
| #2 | 1 | — | $1,356 |
| #3 | 1 | — | $1,356 |
| #4 | 1 | — | $1,356 |
| #5 | 1 | — | $1,356 |
| #6 | 1 | — | $1,356 |
| #7 | 1 | — | $1,356 |
| #8 | 1 | — | $1,356 |
| #9 | 1 | — | $1,356 |
| #10 | 1 | — | $1,356 |
| Total (10 units) | $13,561 | ||
UW: 25.0% down · 7.5% · 30yr · 1.5% tax · 5.0% vac · 8.0% maint · 8.0% mgmt
Financing live
Cash to close
- Down payment
- $500,000
- Closing costs
- $60,000
- Reserves months
- —
- Total cash needed
- —
Loan-product check · same deal, 3 products live
Conventional
25% down · 7.5% · 30yr
- Down + closing
- —
- Monthly P&I
- —
- Monthly cashflow
- —
- DSCR
- —
- Eligible?
- —
Personal DTI + credit; lowest rate.
DSCR
20% down · 8.5% · 30yr
- Down + closing
- —
- Monthly P&I
- —
- Monthly cashflow
- —
- DSCR
- —
- Eligible?
- —
No personal income docs; deal must DSCR.
Hard money
10% down · 12.0% · 12mo
- Down + closing
- —
- Monthly P&I
- —
- Monthly cashflow
- —
- DSCR
- —
- Eligible?
- —
Short-term bridge; refi at stabilization.
Listing history 26 events
-
2026-06-21days on market $2,000,000 Active 108 DOM
-
2026-06-18days on market $2,000,000 Active 105 DOM
-
2026-06-17days on market $2,000,000 Active 104 DOM
-
2026-06-16days on market $2,000,000 Active 103 DOM
-
2026-06-15days on market $2,000,000 Active 102 DOM
-
2026-06-13days on market $2,000,000 Active 100 DOM
-
2026-06-09days on market $2,000,000 Active 96 DOM
-
2026-06-08days on market $2,000,000 Active 95 DOM
-
2026-06-07days on market $2,000,000 Active 94 DOM
-
2026-06-05days on market $2,000,000 Active 91 DOM
-
2026-06-03days on market $2,000,000 Active 90 DOM
-
2026-06-02days on market $2,000,000 Active 89 DOM
-
2026-06-01days on market $2,000,000 Active 88 DOM
-
2026-05-31days on market $2,000,000 Active 87 DOM
-
2026-05-21status Back On Market
-
2026-02-04historical
-
2025-11-19$2,000,000 New
-
2021-12-22soldstatus $275,000 Sold 277-char remark
Show marketing remark (277 chars)
Turnkey 3 family income property, priced to sell. Located close to stores, parks and highways. Nothing to do but move in and collect rent. Portfolio sale also available with 14, 18 and 26 Downing. First showings are Saturday 3/6//21 between 12-1 and Sunday 3/7/21 between 12-1.
-
2021-09-09status Under Agreement 277-char remark
Show marketing remark (277 chars)
Turnkey 3 family income property, priced to sell. Located close to stores, parks and highways. Nothing to do but move in and collect rent. Portfolio sale also available with 14, 18 and 26 Downing. First showings are Saturday 3/6//21 between 12-1 and Sunday 3/7/21 between 12-1.
-
2021-09-09status Reactivated 277-char remark
Show marketing remark (277 chars)
Turnkey 3 family income property, priced to sell. Located close to stores, parks and highways. Nothing to do but move in and collect rent. Portfolio sale also available with 14, 18 and 26 Downing. First showings are Saturday 3/6//21 between 12-1 and Sunday 3/7/21 between 12-1.
-
2021-09-03historical 277-char remark
Show marketing remark (277 chars)
Turnkey 3 family income property, priced to sell. Located close to stores, parks and highways. Nothing to do but move in and collect rent. Portfolio sale also available with 14, 18 and 26 Downing. First showings are Saturday 3/6//21 between 12-1 and Sunday 3/7/21 between 12-1.
-
2021-03-04$349,900 New 277-char remark
Show marketing remark (277 chars)
Turnkey 3 family income property, priced to sell. Located close to stores, parks and highways. Nothing to do but move in and collect rent. Portfolio sale also available with 14, 18 and 26 Downing. First showings are Saturday 3/6//21 between 12-1 and Sunday 3/7/21 between 12-1.
-
2007-08-22soldstatus $255,000 244-char remark
Show marketing remark (244 chars)
Excellent three family with turnkey apartments, hardwood floors, updated kitchens and baths, updated electric and plumbing, builtins in dining room, separate utilities, laundry hookups in the basement, nice clean property. Exterior needs paint.
-
2007-08-22soldstatus $255,000
Show marketing remark (244 chars)
Excellent three family with turnkey apartments, hardwood floors, updated kitchens and baths, updated electric and plumbing, builtins in dining room, separate utilities, laundry hookups in the basement, nice clean property. Exterior needs paint.
-
2007-06-28historical 244-char remark
Show marketing remark (244 chars)
Excellent three family with turnkey apartments, hardwood floors, updated kitchens and baths, updated electric and plumbing, builtins in dining room, separate utilities, laundry hookups in the basement, nice clean property. Exterior needs paint.
-
2006-12-11$275,000 244-char remark
Show marketing remark (244 chars)
Excellent three family with turnkey apartments, hardwood floors, updated kitchens and baths, updated electric and plumbing, builtins in dining room, separate utilities, laundry hookups in the basement, nice clean property. Exterior needs paint.
ⓘ Source: listings_history table (triggers on properties + properties_extension) + one-shot
backfill from property_details.listing_events for pre-trigger history.
Tax reassessment forecast MA · Partial reset (capped growth)
- Current annual tax
- $4,342 · $362/mo
- Projected year-2 tax
- $14,471 · $1,206/mo
- Expected delta
- +$10,129/yr (+$844/mo · 233.3%)
ⓘ Screening estimate from a state-policy table — verify with the county assessor before closing.
Climate risk First Street
- Flood 1/10 Low FEMA zone X (unshaded) · 0% chance over 30 yrs
- Wildfire 1/10 Low
- Heat 5/10 Major 7 d/yr ≥97°F today · 15 d/yr by 30 yrs out
- Wind 8/10 Severe 80% chance of damaging wind over 30 yrs
- Air quality 3/10 Moderate 3 unhealthy d/yr today · 3 by 30 yrs out
Nearby sold comps map
Loading sold comps map…
Walkable amenities ~0.75 mi
Loading nearby amenities…
Taxation est. · year 1
- Rental income
- $162,732
- − Mortgage interest
- −$112,031
- − Property taxes
- −$4,342
- − Insurance
- −$10,000
- − Repairs & maintenance
- −$13,019
- − Management
- −$13,019
- − Depreciation
- −$58,182
- Taxable loss
- −$47,860
- Est. tax savings @ 24.0%
- +$11,486
- After-tax cash flow
- $-156/yr
For passive investors: Depreciation is non-cash, so a rental often shows a tax loss while cash-flowing — sheltering income. Rental losses are passive: they offset passive income freely, and up to $25,000/yr can offset ordinary (W-2) income if you actively participate and your MAGI is under $100k (phasing out to $0 by $150k); unused losses carry forward. On sale, claimed depreciation is recaptured at up to 25%, and gains may owe capital-gains tax (a 1031 exchange can defer both). Figures are a year-1 estimate at your 24.0% rate — not tax advice; consult a CPA.
Schools (NCES district)
- District
- Fall River
- NCES district ID
- 2504830
- Math proficiency
- 17% ▼ -15.00%
- Reading proficiency
- 28% ▼ -6.00%
- Median HH income
- $35,773
- Composite
- 18.59/100
- National rank
- #8905
- State rank
- #288 of 302 in MA
Livability — Fall River
- Score
- 61/100
- State rank
- #221
- US rank
- #18220
Category grades
Schools grade is shown separately in the Schools card above.
Census & demographics
- Census place
- Fall River, MA
- County
- Bristol County · 342,083 people
- City population
- 93,033
- Metro
- Providence-Warwick, RI-MA
- Population (ZIP)
- 17,067
- Household income
- $47,633
- Rent vs Own
- Severe rent burden
- 1335.0
Population outlook (Bristol County) Hauer SSP2
- Today (2025)
- 570,212 people
- By 2030
- 571,181 · +0.2%
- By 2040
- 565,389 · -0.8%
- By 2050
- 552,141 · -3.2%
- By 2075
- 520,923 · -8.6%
- By 2100
- 474,363 · -16.8%
Race, ethnicity, and origin ACS 2023
- Neighborhood character
- Predominantly White (65%)
- Race & ethnicity
- White 65% Hispanic / Latino 16% Two or more races 14% Black 4% Asian 2%
- Hispanic origin (detail)
- Puerto Rican 8%
- Common ancestry
- Russian 34% Lithuanian 6% Estonian 3%
- Foreign-born
- 24% · Canada, Vietnam, China
- Languages at home
- 58% English-only · Other Indo-European 26% Spanish 13% French/Haitian/Cajun 1%
Political lean MEDSL · Bristol
- 2024 margin
- Toss-up / Even · D 49.8% · R 48.5% · Other 1.8%
- 2008→2024 swing
- -21.9pp toward R · 2008: 23.2pp · 2024: 1.3pp
- All cycles
- 2024: D+1.3 2020: D+12.0 2016: D+9.3 2012: D+20.5 2008: D+23.2
Not yet ingested
- Civics
- —
Market trends
- HPI YoY
- ▼ -70.57%
- Current HPI
- 347.6737
- Rent YoY
- —
- Metro
- Providence-Warwick, RI-MA
- State GDP YoY
- ▲ 2.28%
- F500 in state
- 38
Industry mix (Fortune 500 HQ in MA)
| Industry | F500 HQs | Revenue |
|---|---|---|
| Technology | 3 | $17B |
|
||
| Insurance | 2 | $84B |
|
||
| Retail | 2 | $76B |
|
||
| Life Sciences | 1 | $43B |
|
||
| Energy Technology | 1 | $31B |
|
||
| Aerospace / Defense | 1 | $18B |
|
||
Price history
+627.3% since first listed12 events — show timeline
- 2026-05-21 Relisted — MLS PIN
- 2026-02-04 Listing Removed — MLS PIN
- 2025-11-19 Listed $2,000,000 MLS PIN
- 2021-12-22 Sold (MLS) $275,000 MLS PIN
- 2021-09-09 Pending — MLS PIN
- 2021-09-09 Relisted — MLS PIN
- 2021-09-03 Listing Removed — MLS PIN
- 2021-03-04 Listed $349,900 MLS PIN
- 2007-08-22 Sold (Public Records) $255,000 Public Records
- 2007-08-22 Sold (MLS) $255,000 MLS PIN
- 2007-06-28 Listing Removed — MLS PIN
- 2006-12-11 Listed $275,000 MLS PIN
Property tax history
+5.3%/yrLatest (2023): $4,342 · +18.6% YoY. Source: county tax records.
Cash-flow waterfall
monthlySold comps — $/sqft
last 12 mo · ≤1 miLoading sold comps…