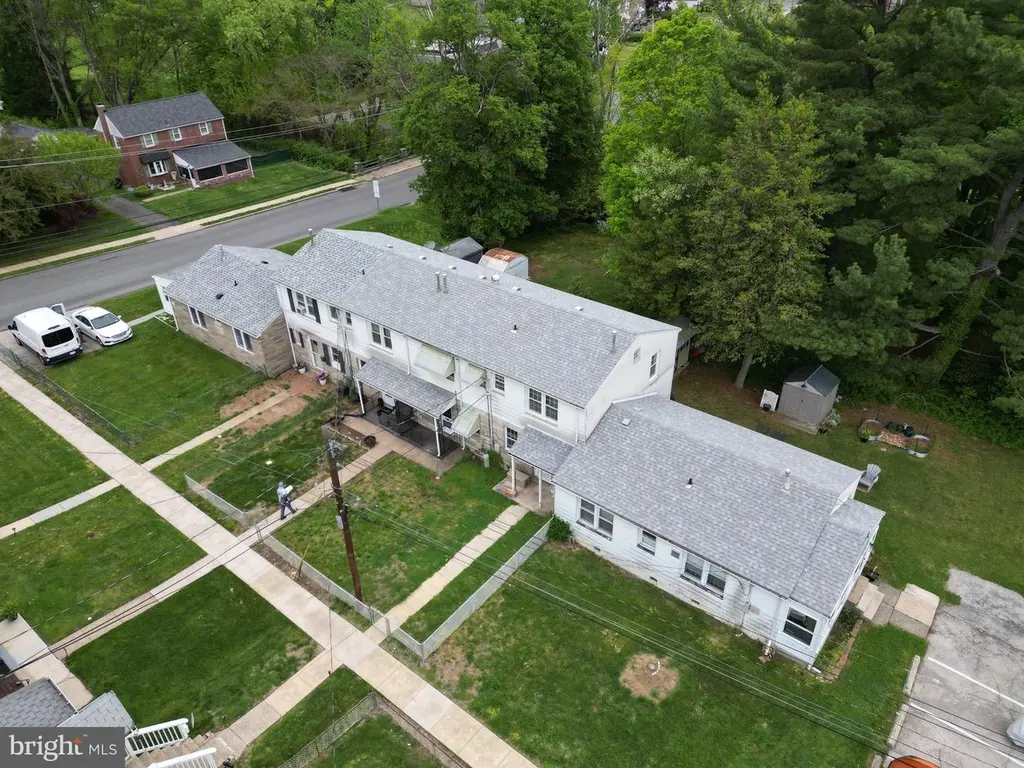
317 Hibbs Ave · Glenolden, PA
Flood risk No data
- FEMA flood zone
- —
- Chance of flooding over 30 yrs
- —
- Est. flood insurance / yr
- —
Fire risk No data
- Est. fire insurance / yr
- —
Heat risk No data
- Hot days now (above threshold)
- —
- Hot days in 30 yrs
- —
Wind risk No data
- Chance of severe wind over 30 yrs
- —
Air-quality risk No data
- Unhealthy air days now
- —
- Unhealthy air days in 30 yrs
- —
Risk factors via First Street. Map © Google.
Why this score? — see what drove the B- grade
The composite is a weighted blend of 9 inputs, each scored 0–100. Each bar is that input's sub-score; the figure is the points it added to the 100-point composite (weight × sub-score).
- Cash flow +30.0/30.0
- 1% rule +10.0/10.0
- DSCR +10.0/10.0
- ARV discount +7.5/15.0
- Livability +4.2/5.0
- Schools +3.3/10.0
- Rent growth +2.5/5.0
- Condition / age +2.2/5.0
- Appreciation +0.0/10.0
$64,999
🖨 Deal sheet 📄 Offer letter ✓ Due diligence
Listing remarks
Definitely need to read this description. .. this is not your normal house!! Pricewise, it absolutely cannot be matched. Location-wise, its an absolute dream. .. .as its in a "park-like" atmosphere and has everything you need within walking distance. You just need to know that you do pay a $574 monthly fee, and it pays for all your utilities (even heat and electric). All you have to do is pay for cable/internet. Mortgages won't be allowed (as far I know). There is also a video online that gives you the full walkthrough, you should definitely watch that before booking an appointment with your realtor. It will help :).
Key facts
- Parking
- Built 1942
- Listed 33 days
Property features AI
Finance
- HOA & community: Monthly coop fee of $574; Fee includes electricity, gas, snow removal, and trash
Exterior
- Parking: One assigned parking space; On-street parking available
- Utilities: Public water; Public sewer
- Home design: Detached property; Cooperative ownership
- Construction: Stone construction; Slab foundation; Estimated year built
- Exterior features: Above-grade other structures
Interior
- Kitchen: Eat-in kitchen
- Bedrooms: Two bedrooms on the upper level; Master bedroom
- Bathrooms: One full bathroom (upper level)
- Heating & cooling: Hot water heating; Natural gas heating fuel; Electric cooling fuel
- Interior features: Eat-in kitchen; Living room; Family room
- Laundry & utility: Laundry on main floor
Neighborhood map
What this means for you Summary
Snapshot
- This is a 2-bed/1.0-bath single-family listed at $65k. Condition is rated fair.
Deal economics
- At list price, monthly cash flow is $438 ($5k/yr) — positive.
- The deal already cash-flows at list — no discount required.
- Meets the 1% rule at list price ($2k rent vs $65k).
- Recommended offer: $63k (3.0% below list) — sets the bar for market timing.
- Cap rate 14.4% vs local median 3.8% in Glenolden — top-decile yield for the area; either an underpriced asset or a hidden risk that comps aren't pricing in. Stress-test before assuming the spread holds.
Location & tenants
- Location reads 85/100 on livability (#69 in PA, #481 nationally) — a professional / high-income tenant draw. Strengths: commute A+, cost of living A+, housing A+; Watch: amenities D.
- Interboro SD (suburban): math 25% / reading 50% proficiency, ranked #369 of 539 in PA (top 68%) — families likely to look elsewhere, expect single-tenant / working-renter base with shorter leases.
- Market conditions: 46 active listings in the ZIP; 28 comparable units currently listed for rent nearby; rentals at typical pace (median 24d on market — plan ~3-4 weeks tenant-placement turnaround); solid renter incomes; 299 units permitted in Delaware County in 2024 (5 in 5+ unit buildings).
Forward outlook
- Local home prices are declining (-3.0%/yr); year-one equity from $449 of loan paydown is wiped out by about $2k of value loss. Plan a longer hold.
- At projected returns (-3.0% appreciation + 3.0% rent growth), your $18k cash investment doubles in ~5 years — after that, you're playing with house money.
Negotiation context
- It's been on market 33 days — a 3% lower offer ($63k) is reasonable based on typical stale-listing flexibility.
Risks & watch-outs
- Watch-outs: HOA is 31% of rent; built in 1942 — expect roof / HVAC / electrical / plumbing capex.
Questions for the listing agent
- It's been on market 33 days. Have you received any prior offers? Is the seller open to a 3% concession, seller financing, or rate buy-down credit?
- Have any recent inspections been done? Can we get a copy of the seller's disclosures and any deferred-maintenance estimates?
- Built in 1942 — when were the roof, HVAC, electrical panel, plumbing, and water heater last replaced?
- What does the HOA fee cover, when was the last increase, and are there any pending special assessments or reserve-fund shortfalls?
- Is there a deadline driving the sale (1031 exchange, divorce, estate, relocation)? That informs how much negotiation room exists.
- Schools are B-rated — typically a magnet for longer-tenancy family renters. What's the average tenant stay here, and is there a school-zone premium baked into asking?
- What's the average days-on-market for RENTAL listings here right now (not sales)? A rising rental-DOM trend means longer vacancies and softer asking-rent achievability than the comps imply.
- What's the recent tenant-quality profile in this submarket — average credit score on applications, eviction rate, late-payment / NSF rate, and stable-employment percentage? A property-management company in the area should have these aggregated.
- How much new for-sale + rental construction is in the pipeline within 1–3 miles? Heavy new supply typically softens prices + rents 12–24 months out; constrained supply supports both.
Investment metrics
- 1% rule
- 2.85% ✓
- Cap rate
- 14.38%
- Cash-on-cash
- 28.89%
- DSCR
- 2.29
- GRM
- 2.9
CMA / ARV
- ARV (median comp)
- $332,908
- List price
- $64,999
- Delta
- -80.48%
- Verdict
- UNDERPRICED
- Comps
- 20 within 1.0 mi
Show comp detail 12 sales within ~0.75 mi
| Address | Dist | Beds/Ba | Sqft | Sold | Price | $/sf | Match |
|---|---|---|---|---|---|---|---|
| 419 W Grays Ave | 0.23mi | 3/1.0 (+1) | 1,344 (-1%) | 3mo | $330,000 | $246 | 80 |
| 409 W Grays Ave | 0.27mi | 3/1.0 (+1) | 1,344 (-1%) | 1mo | $335,000 | $249 | 80 |
| 618 W South Ave | 0.26mi | 3/1.5 (+1) | 1,288 (-5%) | 5mo | $345,000 | $268 | 68 |
| 619 Glenfield Ave | 0.29mi | 3/2.0 (+1) | 1,288 (-5%) | 4mo | $375,000 | $291 | 66 |
| 2815 Armstrong Ave | 0.51mi | 2/1.5 | 1,165 (-14%) | 1mo | $275,000 | $236 | 50 |
| 424 Holmes Rd | 0.64mi | 3/1.0 (+1) | 1,496 (+10%) | 1mo | $370,000 | $247 | 48 |
| 20 N Llanwellyn Ave | 0.57mi | 3/1.5 (+1) | 1,498 (+10%) | 3mo | $350,000 | $234 | 47 |
| 821 Lawnton Ter | 0.75mi | 3/1.0 (+1) | 1,277 (-6%) | 6mo | $225,000 | $176 | 45 |
| 2502 Grand Ave | 0.54mi | 3/1.5 (+1) | 1,159 (-15%) | 6mo | $325,000 | $280 | 38 |
| 2920 Larkspur Ln | 0.71mi | 3/1.5 (+1) | 1,536 (+13%) | 1mo | $355,000 | $231 | 37 |
| 2704 Quaint St | 0.68mi | 3/1.5 (+1) | 1,165 (-14%) | 2mo | $299,999 | $258 | 36 |
| 2329 Armstrong Ave | 0.71mi | 2/2.0 | 1,165 (-14%) | 7mo | $333,000 | $286 | 33 |
Match score weights: distance 35% · size 25% · config 20% · recency 20%. Top-matched comps best support the ARV.
Projected returns pro-forma
-3.0% appreciation · 3.0% rent growth · sell at horizon
- IRR
- 23.6%
- Equity multiple
- 1.98×
- Total profit
- $17,752
- Equity at exit
- $9,692
- IRR
- 31.7%
- Equity multiple
- 3.91×
- Total profit
- $52,935
- Equity at exit
- $5,620
Cash invested: $18,200 (down + closing). Projections, not guarantees.
Landlord ↔ Tenant lean methodology
- Overall (STATE)
- 62 Landlord-Friendly
- State Pennsylvania
- 62 Landlord-Friendly · EVEN
- County
- — inherits STATE
- City
- — inherits STATE
ZIP-level market 19036
- Active inventory
- 46
- Price-to-rent
- 2.9×
Monthly cashflow live
- Estimated rent
- $1,850 high interval (Pro) →
- Mortgage (P&I)
- −$341
- Tax est. 1.5%
- −$81 /mo · $975/yr
- Insurance
- −$27
- HOA
- −$574
- Vacancy / Maint / Mgmt
- −$388
- Net cashflow
- $438
Break-even live
UW: 25.0% down · 7.5% · 30yr · 1.5% tax · 5.0% vac · 8.0% maint · 8.0% mgmt
Financing live
Cash to close
- Down payment
- $16,250
- Closing costs
- $1,950
- Reserves months
- —
- Total cash needed
- —
Loan-product check · same deal, 3 products live
Conventional
25% down · 7.5% · 30yr
- Down + closing
- —
- Monthly P&I
- —
- Monthly cashflow
- —
- DSCR
- —
- Eligible?
- —
Personal DTI + credit; lowest rate.
DSCR
20% down · 8.5% · 30yr
- Down + closing
- —
- Monthly P&I
- —
- Monthly cashflow
- —
- DSCR
- —
- Eligible?
- —
No personal income docs; deal must DSCR.
Hard money
10% down · 12.0% · 12mo
- Down + closing
- —
- Monthly P&I
- —
- Monthly cashflow
- —
- DSCR
- —
- Eligible?
- —
Short-term bridge; refi at stabilization.
Rent comps 28 comps
| Address | Beds | Baths | Sqft | Rent | $/sqft | DOM | Units | Dist |
|---|---|---|---|---|---|---|---|---|
| 201 Westbridge Rd Glenolden, PA | 3.0 | 1.5 | 1224 | $2,350 | $1.92 | 24d | 1 | 0.36mi |
| 640 South Ave Secane, PA | 1.0–2.0 | 1.0–1.5 | 742 | $1,600 | $2.16 | 12d | 5 | 0.41mi |
| 1074 N Academy Ave Glenolden, PA | 3.0 | 1.0 | 1152 | $1,850 | $1.61 | 5d | 1 | 0.42mi |
| 209 Glenside Ave Unit 1ST FLOOR Holmes, PA | 2.0 | 1.0 | 1872 | $1,600 | $0.85 | 43d | 1 | 0.50mi |
| 2350 Baldwin Ave Unit 1B Holmes, PA | 1.0 | 1.0 | 900 | $1,400 | $1.56 | 43d | 1 | 0.52mi |
| 202 Green St Holmes, PA | 2.0 | 1.0 | 1560 | $1,700 | $1.09 | 18d | 1 | 0.56mi |
| 925 Maple Ave Glenolden, PA | 3.0 | 2.0 | 1152 | $2,800 | $2.43 | 21d | 1 | 0.59mi |
| 902 Maple Ave Glenolden, PA | 3.0 | 1.0 | 1152 | $1,745 | $1.51 | 43d | 1 | 0.65mi |
| 100 E Glenolden Ave Glenolden, PA | 1.0–4.0 | 1.0–2.0 | 920 | $1,683 | $1.83 | 1d | 4 | 0.78mi |
| 100 S Oak Ave Glenolden, PA | 1.0–2.0 | 1.0–2.0 | 830 | $1,500 | $1.81 | 23d | 3 | 0.89mi |
| 306 Pine St Glenolden, PA | 3.0 | 2.0 | 1120 | $2,400 | $2.14 | 4d | 1 | 0.96mi |
| 304 Pine St Glenolden, PA | 3.0 | 2.0 | 1120 | $2,400 | $2.14 | 43d | 1 | 0.97mi |
| 145 Isabel Ave Unit 145B Glenolden, PA | 2.0 | 1.0 | 890 | $1,525 | $1.71 | 43d | 1 | 0.98mi |
| 132 Folcroft Ave Folcroft, PA | 2.0 | 1.0 | 725 | $1,679 | $2.32 | 2d | 3 | 1.01mi |
| 66 Folcroft Ave Folcroft, PA | 3.0 | 1.0 | 1224 | $1,895 | $1.55 | 3d | 1 | 1.03mi |
| 1513 Elmwood Ave Unit 4 Folcroft, PA | 3.0 | 1.0 | 1025 | $1,699 | $1.66 | 24d | 1 | 1.24mi |
| 1503 Elmwood Ave Folcroft, PA | 3.0 | 1.0 | 1025 | $1,699 | $1.66 | 24d | 1 | 1.25mi |
| 304 Christopher Pl Primos, PA | 2.0 | 1.0 | 1600 | $1,400 | $0.88 | 5d | 1 | 1.28mi |
| 304 Christopher Pl Unit 1st Floor Primos, PA | 2.0 | 1.0 | 875 | $1,400 | $1.60 | 3d | 1 | 1.28mi |
| 819 11th Ave Unit C Prospect Park, PA | 2.0 | 2.0 | 916 | $2,250 | $2.46 | 43d | 1 | 1.29mi |
| 804 Grant Rd Folcroft, PA | 3.0 | 1.0 | 1088 | $2,050 | $1.88 | 43d | 1 | 1.34mi |
| 151 S Bishop Ave Clifton Heights, PA | 1.0–2.0 | 1.0–2.0 | 875 | $1,989 | $2.27 | 1d | 3 | 1.40mi |
| 112 Juliana Ter Darby, PA | 3.0 | 1.0 | 1020 | $2,450 | $2.40 | 24d | 1 | 1.43mi |
| 112 Juliana Ter Darby, PA | 3.0 | 1.0 | 1020 | $2,350 | $2.30 | 44d | 1 | 1.43mi |
| 701 Lincoln Ave Prospect Park, PA | 1.0–2.0 | 1.0 | 762 | $1,425 | $1.87 | 21d | 3 | 1.45mi |
| 2001 Carter Rd Folcroft, PA | 3.0 | 1.0 | 1224 | $2,150 | $1.76 | 43d | 1 | 1.47mi |
| 118 Felton Ave Darby, PA | 3.0 | 1.0 | 1152 | $1,750 | $1.52 | 21d | 1 | 1.47mi |
| 319 S Church St Clifton Heights, PA | 3.0 | 1.0 | 1152 | $1,900 | $1.65 | 43d | 1 | 1.48mi |
HOA detail
- Monthly dues
- $574 · $6,888/yr
- Likely covers
- electricinternetcable
Listing history 11 events
-
2026-06-13statusdays on market $64,999 Pending 33 DOM
-
2026-06-09days on market $64,999 Active 32 DOM
-
2026-06-08days on market $64,999 Active 31 DOM
-
2026-06-07days on market $64,999 Active 30 DOM
-
2026-06-04days on market $64,999 Active 27 DOM
-
2026-06-03days on market $64,999 Active 26 DOM
-
2026-06-02days on market $64,999 Active 25 DOM
-
2026-06-01days on market $64,999 Active 24 DOM
-
2026-05-31days on market $64,999 Active 23 DOM
-
2026-05-09$64,999 Active 635-char remark
-
2026-05-08historical $64,999 635-char remark
ⓘ Source: listings_history table (triggers on properties + properties_extension) + one-shot
backfill from property_details.listing_events for pre-trigger history.
Nearby sold comps map
Loading sold comps map…
Walkable amenities ~0.75 mi
Loading nearby amenities…
Taxation est. · year 1
- Rental income
- $22,197
- − Mortgage interest
- −$3,641
- − Property taxes
- −$975
- − Insurance
- −$325
- − Repairs & maintenance
- −$1,776
- − Management
- −$1,776
- − HOA
- −$6,888
- − Depreciation
- −$1,891
- Taxable income
- $4,926
- Est. tax owed @ 24.0%
- −$1,182
- After-tax cash flow
- $4,075/yr
For passive investors: Depreciation is non-cash, so a rental often shows a tax loss while cash-flowing — sheltering income. Rental losses are passive: they offset passive income freely, and up to $25,000/yr can offset ordinary (W-2) income if you actively participate and your MAGI is under $100k (phasing out to $0 by $150k); unused losses carry forward. On sale, claimed depreciation is recaptured at up to 25%, and gains may owe capital-gains tax (a 1031 exchange can defer both). Figures are a year-1 estimate at your 24.0% rate — not tax advice; consult a CPA.
Condition & rehab AI · 30 photos
This property requires moderate renovations to improve its condition and increase its value. Key areas for improvement include the kitchen, exterior, and interior walls.
Repairs flagged
- Major Exposed brick wall in kitchen — Structural issue
- Major Appliances in kitchen — Outdated and in poor condition
- Major Exposed electrical panel — Safety hazard
Value-add opportunities
- Both Paint interior walls — Enhances curb appeal and interior aesthetics
- Both Replace carpeted flooring — Improves comfort and reduces maintenance
- Both Repair siding — Enhances curb appeal and structural integrity
- Both Replace appliances — Improves functionality and aesthetics
- Both Upgrade electrical panel — Ensures safety and meets current standards
Renovation cost estimate screening
| Repair item | Severity | Est. cost |
|---|---|---|
| Exposed brick wall in kitchen · Structural issue | Major | $15,000–50,000 |
| Appliances in kitchen · Outdated and in poor condition | Major | $15,000–50,000 |
| Exposed electrical panel · Safety hazard | Major | $15,000–50,000 |
| Total estimated repair cost · 3 items | $45,000–150,000 |
Value-add ROI direction
- Both Paint interior walls — Enhances curb appeal and interior aesthetics ↑
- Both Replace carpeted flooring — Improves comfort and reduces maintenance ↑
- Both Repair siding — Enhances curb appeal and structural integrity ↑
- Both Replace appliances — Improves functionality and aesthetics ↑
- Both Upgrade electrical panel — Ensures safety and meets current standards ↑
ⓘ Cost ranges are severity-bucket heuristics (US national rule-of-thumb). Get contractor quotes + a written scope before underwriting a rehab budget.
Schools (NCES district)
- District
- Interboro SD
- NCES district ID
- 4212170
- Math proficiency
- 25% ▼ -17.00%
- Reading proficiency
- 50% ▼ -16.00%
- Median HH income
- $56,802
- Composite
- 32.97/100
- National rank
- #5587
- State rank
- #369 of 539 in PA
Livability — Glenolden
- Score
- 85/100
- State rank
- #69
- US rank
- #481
Category grades
Schools grade is shown separately in the Schools card above.
Census & demographics
- Census place
- Glenolden, PA
- County
- Delaware County · 399,863 people
- City population
- 13,668
- Metro
- Philadelphia-Camden-Wilmington, PA-NJ-DE-MD
- Population (ZIP)
- 13,668
- Household income
- $79,144
- Rent vs Own
- Severe rent burden
- 383.0
Population outlook (Delaware County) Hauer SSP2
- Today (2025)
- 577,490 people
- By 2030
- 581,243 · +0.6%
- By 2040
- 584,700 · +1.2%
- By 2050
- 586,581 · +1.6%
- By 2075
- 598,706 · +3.7%
- By 2100
- 590,823 · +2.3%
Race, ethnicity, and origin ACS 2023
- Neighborhood character
- Predominantly White (71%)
- Race & ethnicity
- White 71% Black 18% Two or more races 6% Hispanic / Latino 4% Asian 1%
- Common ancestry
- Romanian 5% Lithuanian 2% Hispanic 1%
- Foreign-born
- 5% · Canada, China
- Languages at home
- 92% English-only · Other Indo-European 1% French/Haitian/Cajun 1% Spanish 1%
Political lean MEDSL · Delaware
- 2024 margin
- Strong D (+23.7) · D 61.4% · R 37.6% · Other 1.0%
- 2008→2024 swing
- +2.3pp toward D · 2008: 21.4pp · 2024: 23.7pp
- All cycles
- 2024: D+23.7 2020: D+26.7 2016: D+22.0 2012: D+21.8 2008: D+21.4
Not yet ingested
- Civics
- —
Market trends
- HPI YoY
- ▼ -218.04%
- Current HPI
- 267.7452
- Rent YoY
- —
- Metro
- Philadelphia-Camden-Wilmington, PA-NJ-DE-MD
- State GDP YoY
- ▲ 1.68%
- F500 in state
- 34
Industry mix (Fortune 500 HQ in PA)
| Industry | F500 HQs | Revenue |
|---|---|---|
| Healthcare | 2 | $309B |
|
||
| Insurance | 2 | $27B |
|
||
| Telecommunications / Media | 1 | $124B |
|
||
| Industrial Distribution | 1 | $22B |
|
||
| Financial Services | 1 | $20B |
|
||
| Chemicals / Materials | 1 | $18B |
|
||
Price history
+0.0% since first listed3 events — show timeline
- 2026-06-11 Pending — BRIGHT MLS
- 2026-05-09 Listed $64,999 BRIGHT MLS
- 2026-05-08 Coming Soon $64,999 BRIGHT MLS
Cash-flow waterfall
monthlySold comps — $/sqft
last 12 mo · ≤1 miLoading sold comps…