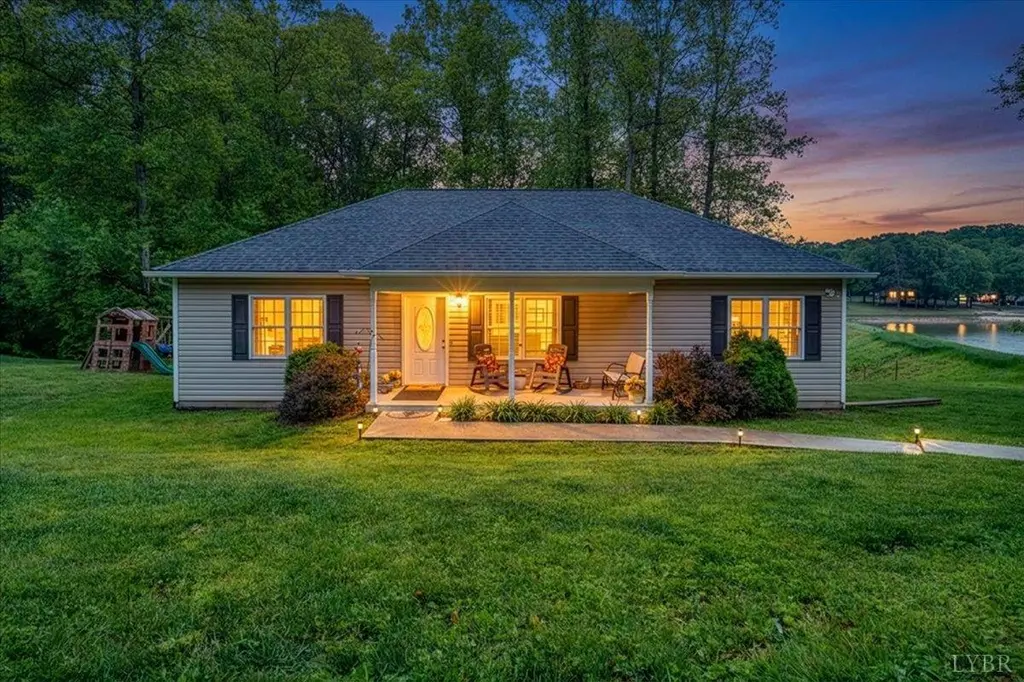
 🌊 Lakefront
1508 Brookville Circle Cir · Lynchburg, VA
Flood risk 1/10 · Minimal
- FEMA flood zone
- X (unshaded)
- Chance of flooding over 30 yrs
- 0.0%
- Est. flood insurance / yr
- $507 – $1,088
Fire risk 3/10 · Minor
- Est. fire insurance / yr
- $666 – $1,236
Heat risk 5/10 · Moderate
- Hot days now (above 101°F)
- 7 days/yr
- Hot days in 30 yrs
- 18 days/yr
Wind risk 2/10 · Minimal
- Chance of severe wind over 30 yrs
- 3.0%
Air-quality risk 2/10 · Minimal
- Unhealthy air days now
- 1 days/yr
- Unhealthy air days in 30 yrs
- 1 days/yr
Risk factors via First Street. Map © Google.
Why this score? — see what drove the D- grade
The composite is a weighted blend of 9 inputs, each scored 0–100. Each bar is that input's sub-score; the figure is the points it added to the 100-point composite (weight × sub-score).
- ARV discount +15.0/15.0
- Cash flow +5.2/30.0
- Livability +4.5/5.0
- Schools +4.0/10.0
- Rent growth +3.8/5.0
- Condition / age +2.5/5.0
- 1% rule +0.1/10.0
- DSCR +0.0/10.0
- Appreciation +0.0/10.0
$339,000
🖨 Deal sheet (PDF) 📄 Offer letter ✓ Due diligence
Listing remarks
Lake life in town! This spacious one level home was originally built in 2011 with a 2024 addition that added 2 bedrooms, a full bath, and a basement rec-room/mother-in-law suite with its own full bath and exterior entrance, perfect for guest, in-laws, or rental potential. Offering 5 bedrooms and 4 full baths! This home features main level living, a primary suite with private bath, walk in closet, main level laundry, elec. fireplace w/ built-in bookcases, and all appliances convey. The heat Pump is less than 3 years old. Home is Situated on . 45 acres, backing up to Lakeland Lake. Enjoy peaceful water views from the large rear concrete patio and pergola perfect for grilling and entertainin
Key facts
- One level home
- 2024 addition
- Mother-in-law suite
Tags
Property features AI
Finance
- Other: Lot is approximately 0.459 acres
Exterior
- Parking: Paved off-street parking
- Security: Smoke detectors
- Utilities: Public water; Public sewer; Cable available
- Home design: Single-family residence; One story
- Construction: Vinyl siding; Shingle roof; Built with a foundation and partial below-grade finished area
- Exterior features: Patio; Porch; Waterfront access
Interior
- Kitchen: Dishwasher; Electric range; Refrigerator; Microwave
- Flooring: Carpet; Vinyl
- Bathrooms: Four full bathrooms
- Heating & cooling: Heat pump (heating); Has heating
- Interior features: Skylights; Fireplace (1); Basement with partial finish, sump pump, and walk-out access; Storage
- Laundry & utility: Main level laundry closet with washer hookup; Electric water heater
Neighborhood map
What this means for you Summary
Snapshot
- This is a 3-bed/2.0-bath single-family listed at $339k.
Deal economics
- At list price, monthly cash flow is $-763 ($-9k/yr) — negative.
- To cash-flow at today's rent, offer at most $204k (39.8% below list).
- To meet the 1% rule (rent ≥ 1% of price), the offer needs to be $174k (48.8% below list).
- Recommended offer: $174k (48.8% below list) — sets the bar for 1% rule.
Location & tenants
- Location reads 91/100 on livability (#1 in VA, #58 nationally) — a professional / high-income tenant draw. Strengths: amenities A+, commute A+, cost of living A+; Watch: crime C-, employment D+.
- Lynchburg City Public School District (urban): math 36% / reading 61% proficiency, ranked #104 of 131 in VA (top 79%) — families likely to look elsewhere, expect single-tenant / working-renter base with shorter leases; 61% free/reduced lunch — lower-income household profile, screen leases tightly.
- Zoned schools: Heritage Elementary (math 22% / reading 47%, grade F, #966 of 1,108 statewide, top 89%, 475 students, 90% FRL); Sandusky Middle (math 29% / reading 52%, grade F, #303 of 342 statewide, top 89%, 568 students, 96% FRL); Heritage High (math 32% / reading 77%, grade C-, #281 of 319 statewide, top 90%, 1,073 students, 94% FRL) — zoned schools average 93% FRL vs 61% district-wide (32 pts higher); higher-poverty schools than district average — tighter screening recommended.
- Market conditions: Rents rising fast (+5.1%/yr); 324 active listings in the ZIP; 25 comparable units currently listed for rent nearby; rentals at typical pace (median 23d on market — plan ~3-4 weeks tenant-placement turnaround); 48% of comp listings sitting > 30 days — soft ceiling on asking rent; 472 units permitted in Lynchburg city in 2024 (240 in 5+ unit buildings).
- This rent runs 30% of the median local income ($69k/yr) — at the standard rent-burdened threshold; future hikes will face affordability resistance.
Forward outlook
- Local home prices are declining (-3.0%/yr); year-one equity from $2k of loan paydown is wiped out by about $10k of value loss. Plan a longer hold.
- Lynchburg County population projected at +37% by 2050 — long-run rental-demand tailwind backs the buy-and-hold thesis.
Negotiation context
- Only 9 days on market — expect competitive offers; lowballing is unlikely to land.
- Current owner paid $32k; list at $339k implies a 976% gain — meaningful room to come down on a strong offer.
Risks & watch-outs
- Climate carrying-cost: extreme-heat days projected 7→18/yr by 2055 (HVAC capex compounding) — expect insurance premiums to compound above CPI over the hold.
Questions for the listing agent
- What do current leases actually rent for vs. the listed asking? Can we see a recent rent roll and the last 12 months of T-12 income?
- Is there a deadline driving the sale (1031 exchange, divorce, estate, relocation)? That informs how much negotiation room exists.
- Schools are A-rated — typically a magnet for longer-tenancy family renters. What's the average tenant stay here, and is there a school-zone premium baked into asking?
- The area grade is low — what's the realistic commute time and amenity access for the typical tenant pool here? Any planned neighborhood developments (good or bad) we should know about?
- This sits on a lake — are riparian / water-frontage rights deeded with the parcel? Any dock permits, shoreline easements, or HOA water-use restrictions?
- What's the documented flood / surge / shoreline-erosion history here (FEMA AND non-FEMA — e.g., storm surge, creek backup, septic-field saturation)?
- Any water-quality or seasonal algae-bloom issues that affect tenant satisfaction or short-term-rental demand?
- What's the average days-on-market for RENTAL listings here right now (not sales)? A rising rental-DOM trend means longer vacancies and softer asking-rent achievability than the comps imply.
- What's the recent tenant-quality profile in this submarket — average credit score on applications, eviction rate, late-payment / NSF rate, and stable-employment percentage? A property-management company in the area should have these aggregated.
- How much new for-sale + rental construction is in the pipeline within 1–3 miles? Heavy new supply typically softens prices + rents 12–24 months out; constrained supply supports both.
Investment metrics
- 1% rule
- 0.51% ✗
- Cap rate
- 3.59%
- Cash-on-cash
- -9.65%
- DSCR
- 0.57
- GRM
- 16.3
CMA / ARV
- ARV (median comp)
- $446,060
- List price
- $339,000
- Delta
- -24.00%
- Verdict
- UNDERPRICED
- Comps
- 20 within 1.0 mi
Show comp detail 10 sales within ~0.75 mi
| Address | Dist | Beds/Ba | Sqft | Sold | Price | $/sf | Match |
|---|---|---|---|---|---|---|---|
| 109 Farley Branch Dr | 0.52mi | 3/2.0 | 1,408 (+0%) | 3mo | $325,000 | $231 | 73 |
| 1231 Lakeview Dr | 0.10mi | 3/2.0 | 1,540 (+10%) | 11mo | $290,000 | $188 | 70 |
| 1201 Lakeview Dr | 0.26mi | 3/2.0 | 1,419 (+1%) | 20mo | $271,900 | $192 | 69 |
| 1202 Lakeview Dr | 0.25mi | 3/2.0 | 1,430 (+2%) | 20mo | $287,900 | $201 | 69 |
| 136 Yorkshire Cir | 0.29mi | 3/2.0 | 1,447 (+3%) | 16mo | $228,900 | $158 | 68 |
| 1034 Oakmont Circle Cir | 0.50mi | 3/1.5 | 1,298 (-8%) | 8mo | $225,000 | $173 | 56 |
| 1028 Oakmont Cir | 0.45mi | 3/1.0 | 1,299 (-8%) | 17mo | $220,000 | $169 | 48 |
| 101 Ridgeline Ln | 0.63mi | 3/2.0 | 1,216 (-14%) | 11mo | $320,000 | $263 | 39 |
| 1007 Grand View Cir | 0.71mi | 3/2.0 | 1,600 (+14%) | 6mo | $269,000 | $168 | 39 |
| 310 Cornerstone St | 0.59mi | 2/2.0 (-1) | 1,607 (+14%) | 16mo | $370,000 | $230 | 30 |
Match score weights: distance 35% · size 25% · config 20% · recency 20%. Top-matched comps best support the ARV.
Projected returns pro-forma
-3.0% appreciation · 5.11% rent growth · sell at horizon
- IRR
- -31.6%
- Equity multiple
- -0.05×
- Total profit
- $-99,895
- Equity at exit
- $50,546
- IRR
- -28.1%
- Equity multiple
- -0.41×
- Total profit
- $-133,892
- Equity at exit
- $29,311
Cash invested: $94,920 (down + closing). Projections, not guarantees.
Landlord ↔ Tenant lean methodology
- Overall (STATE)
- 55 Moderately Landlord-Leaning
- State Virginia
- 55 Moderately Landlord-Leaning · D+2
- County
- — inherits STATE
- City
- — inherits STATE
ZIP-level market 24502
- Rents YoY
- 5.1%
- Active inventory
- 324
- Price-to-rent
- 16.3×
Monthly cashflow live
- Estimated rent
- $1,735 high interval (Pro) →
- Mortgage (P&I)
- −$1,778
- Tax from tax record
- −$215 /mo · $2,585/yr
- Insurance
- −$141
- HOA
- −$0
- Vacancy / Maint / Mgmt
- −$364
- Net cashflow
- $-763
Break-even live
Sensitivity live
| Price | -10% $-572 | -5% $-667 | +0% $-763 | +5% $-859 | +10% $-955 |
|---|---|---|---|---|---|
| Rent | -10% $-901 | -5% $-832 | +0% $-763 | +5% $-695 | +10% $-626 |
| Rate | -1.0pp $-593 | -0.5pp $-677 | base $-763 | +0.5pp $-851 | +1.0pp $-941 |
UW: 25.0% down · 7.5% · 30yr · 1.5% tax · 5.0% vac · 8.0% maint · 8.0% mgmt
Financing live
Cash to close
- Down payment
- $84,750
- Closing costs
- $10,170
- Reserves months
- —
- Total cash needed
- —
Loan-product check · same deal, 3 products live
Conventional
25% down · 7.5% · 30yr
- Down + closing
- —
- Monthly P&I
- —
- Monthly cashflow
- —
- DSCR
- —
- Eligible?
- —
Personal DTI + credit; lowest rate.
DSCR
20% down · 8.5% · 30yr
- Down + closing
- —
- Monthly P&I
- —
- Monthly cashflow
- —
- DSCR
- —
- Eligible?
- —
No personal income docs; deal must DSCR.
Hard money
10% down · 12.0% · 12mo
- Down + closing
- —
- Monthly P&I
- —
- Monthly cashflow
- —
- DSCR
- —
- Eligible?
- —
Short-term bridge; refi at stabilization.
Rent comps 25 comps
| Address | Beds | Baths | Sqft | Rent | $/sqft | DOM | Units | Dist |
|---|---|---|---|---|---|---|---|---|
| 503 Barrington Way Lynchburg, VA | 3.0 | 3.5 | 1545 | $1,795 | $1.16 | 15d | 1 | 0.56mi |
| 419 Rotunda St Lynchburg, VA | 3.0 | 2.0 | 1402 | $1,875 | $1.34 | 23d | 1 | 0.69mi |
| 419 Rotunda St #2001 Lynchburg, VA | 3.0 | 2.0 | 1444 | $1,875 | $1.30 | 45d | 1 | 0.69mi |
| 302 Capstone Dr Lynchburg, VA | 2.0 | 2.0 | 900 | $1,225 | $1.36 | 45d | 1 | 0.70mi |
| 318 Meridian St Lynchburg, VA | 3.0 | 2.5 | 1600 | $1,995 | $1.25 | 45d | 1 | 0.70mi |
| 556 Leesville Rd #306 Lynchburg, VA | 3.0 | 3.0 | 1520 | $2,100 | $1.38 | 45d | 1 | 0.71mi |
| 556 Leesville Rd Lynchburg, VA | 3.0 | 2.5 | 1600 | $1,695 | $1.06 | 15d | 1 | 0.71mi |
| 211 Meridian St Lynchburg, VA | 3.0 | 3.0 | 1815 | $2,300 | $1.27 | 15d | 1 | 0.71mi |
| 121 Colonnade St Lynchburg, VA | 2.0–3.0 | 2.0 | 1000 | $1,395 | $1.40 | 45d | 1 | 0.73mi |
| 119 Cornerstone St Lynchburg, VA | 3.0 | 2.0 | 1350 | $1,595 | $1.18 | 23d | 1 | 0.76mi |
| 120 Portico St Lynchburg, VA | 3.0 | 2.0 | 1150 | $1,395 | $1.21 | 45d | 1 | 0.78mi |
| 203 Capital St Lynchburg, VA | 2.0–3.0 | 2.0 | 1143 | $1,585 | $1.39 | 15d | 20 | 0.79mi |
| 105 Capital St Lynchburg, VA | 2.0–3.0 | 2.0 | 1000 | $1,449 | $1.45 | 15d | 14 | 0.82mi |
| 100 Capstone Dr #303 Lynchburg, VA | 2.0 | 2.0 | 1027 | $2,250 | $2.19 | 45d | 1 | 0.89mi |
| 209 Old Graves Mill Rd Lynchburg, VA | 2.0–3.0 | 2.0 | 1313 | $1,430 | $1.09 | 15d | 7 | 0.93mi |
| 151 Kitty Hawk Sq Lynchburg, VA | 3.0 | 2.5 | 1800 | $1,450 | $0.81 | 23d | 1 | 1.04mi |
| 240 Beverly Hills Cir Lynchburg, VA | 2.0–3.0 | 2.0–2.5 | 1402 | $1,756 | $1.25 | 23d | 10 | 1.06mi |
| 110 Aaron Pl #605 Lynchburg, VA | 3.0 | 2.0 | 1517 | $1,795 | $1.18 | 15d | 1 | 1.11mi |
| 110 Aaron Pl #611 Lynchburg, VA | 3.0 | 2.5 | 1490 | $1,925 | $1.29 | 23d | 1 | 1.11mi |
| 48 Walton Dr Unit 48 Lynchburg, VA | 2.0 | 1.0 | 887 | $875 | $0.99 | 45d | 1 | 1.15mi |
| 501 Bent Oak Ct Lynchburg, VA | 3.0 | 2.0 | 1250 | $1,900 | $1.52 | 45d | 1 | 1.28mi |
| 142 Mesena Dr Lynchburg, VA | 2.0 | 2.0 | 1173 | $1,275 | $1.09 | 45d | 1 | 1.28mi |
| 1229 Wood Rd Unit C Lynchburg, VA | 2.0 | 1.0 | 900 | $1,200 | $1.33 | 45d | 1 | 1.34mi |
| 120 Clubhouse Dr Lynchburg, VA | 1.0–3.0 | 1.0–2.0 | 1100 | $1,325 | $1.20 | 15d | 1 | 1.36mi |
| 1816 Wards Ferry Rd Lynchburg, VA | 3.0 | 3.5 | 1432 | $825 | $0.58 | 45d | 1 | 1.45mi |
Listing history 3 events
-
2026-05-12$339,000 Active 999-char remark
-
2010-10-08soldstatus $31,500
-
2009-08-28soldstatus $51,300
ⓘ Source: listings_history table (triggers on properties + properties_extension) + one-shot
backfill from property_details.listing_events for pre-trigger history.
Tax reassessment forecast VA · Resets to sale price
- Current annual tax
- $2,585 · $215/mo
- Projected year-2 tax
- $2,780 · $232/mo
- Expected delta
- +$195/yr (+$16/mo · 7.5%)
ⓘ Screening estimate from a state-policy table — verify with the county assessor before closing.
Climate risk First Street
- Flood 1/10 Low FEMA zone X (unshaded) · 0% chance over 30 yrs
- Wildfire 3/10 Moderate
- Heat 5/10 Major 7 d/yr ≥101°F today · 18 d/yr by 30 yrs out
- Wind 2/10 Low 3% chance of damaging wind over 30 yrs
- Air quality 2/10 Low 1 unhealthy d/yr today · 1 by 30 yrs out
Nearby sold comps map
Loading sold comps map…
Walkable amenities ~0.75 mi
Loading nearby amenities…
Taxation est. · year 1
- Rental income
- $20,825
- − Mortgage interest
- −$18,989
- − Property taxes
- −$2,585
- − Insurance
- −$1,695
- − Repairs & maintenance
- −$1,666
- − Management
- −$1,666
- − Depreciation
- −$9,862
- Taxable loss
- −$15,638
- Est. tax savings @ 24.0%
- +$3,753
- After-tax cash flow
- $-5,408/yr
For passive investors: Depreciation is non-cash, so a rental often shows a tax loss while cash-flowing — sheltering income. Rental losses are passive: they offset passive income freely, and up to $25,000/yr can offset ordinary (W-2) income if you actively participate and your MAGI is under $100k (phasing out to $0 by $150k); unused losses carry forward. On sale, claimed depreciation is recaptured at up to 25%, and gains may owe capital-gains tax (a 1031 exchange can defer both). Figures are a year-1 estimate at your 24.0% rate — not tax advice; consult a CPA.
Schools (NCES district)
- District
- Lynchburg City Public School District
- NCES district ID
- 5102340
- Math proficiency
- 36% ▼ -38.00%
- Reading proficiency
- 61% ▼ -8.00%
- Median HH income
- $39,097
- Composite
- 40.4/100
- National rank
- #3730
- State rank
- #104 of 131 in VA
Livability — Lynchburg
- Score
- 91/100
- State rank
- #1
- US rank
- #58
Category grades
Schools grade is shown separately in the Schools card above.
Census & demographics
- Census place
- Lynchburg, VA
- County
- Lynchburg City · 97,036 people
- City population
- 97,036
- Metro
- Lynchburg, VA
- Population (ZIP)
- 41,979
- Household income
- $68,872
- Rent vs Own
- Severe rent burden
- 1774.0
Population outlook (Lynchburg County) Hauer SSP2
- Today (2025)
- 87,977 people
- By 2030
- 93,626 · +6.4%
- By 2040
- 106,145 · +20.7%
- By 2050
- 120,783 · +37.3%
- By 2075
- 162,249 · +84.4%
- By 2100
- 191,358 · +117.5%
Race, ethnicity, and origin ACS 2023
- Neighborhood character
- Predominantly White (68%)
- Race & ethnicity
- White 68% Black 19% Two or more races 6% Hispanic / Latino 6% Asian 2%
- Hispanic origin (detail)
- Mexican 2%
- Common ancestry
- Slovak 3% Italian 2% Lithuanian 2%
- Foreign-born
- 6% · Canada, South Korea, United Kingdom
- Languages at home
- 91% English-only · Spanish 4% Other Indo-European 1% Other Asian/Pacific 1%
Political lean MEDSL · Lynchburg
- 2024 margin
- Lean R (+7.9) · D 45.4% · R 53.3% · Other 1.3%
- 2008→2024 swing
- -3.9pp toward R · 2008: -4.0pp · 2024: -7.9pp
- All cycles
- 2024: R+7.9 2020: D+2.6 2016: R+9.0 2012: R+10.6 2008: R+4.0
Not yet ingested
- Civics
- —
Market trends
- HPI YoY
- ▼ -222.79%
- Current HPI
- 241.9041
- Rent YoY
- ▲ 5.11%
- Metro
- Lynchburg, VA
- State GDP YoY
- ▲ 2.40%
- F500 in state
- 50
Industry mix (Fortune 500 HQ in VA)
| Industry | F500 HQs | Revenue |
|---|---|---|
| Aerospace / Defense | 4 | $236B |
|
||
| Technology / Defense | 3 | $32B |
|
||
| Financial Services | 2 | $176B |
|
||
| Utilities | 2 | $27B |
|
||
| Insurance | 2 | $25B |
|
||
| Technology | 2 | $15B |
|
||
Price history
+560.8% since first listed4 events — show timeline
- 2026-05-21 Pending — LMLS
- 2026-05-12 Listed $339,000 LMLS
- 2010-10-08 Sold (Public Records) $31,500 Public Records
- 2009-08-28 Sold (Public Records) $51,300 Public Records
Property tax history
+5.1%/yrLatest (2025): $2,585 · -1.4% YoY. Source: county tax records.
Cash-flow waterfall
monthlySold comps — $/sqft
last 12 mo · ≤1 miLoading sold comps…