21760 Ives · California City, CA
Flood risk 1/10 · Minimal
- FEMA flood zone
- X (unshaded)
- Chance of flooding over 30 yrs
- 0.0%
- Est. flood insurance / yr
- $507 – $1,088
Fire risk 1/10 · Minimal
- Est. fire insurance / yr
- $659 – $1,223
Heat risk 8/10 · Major
- Hot days now (above 101°F)
- 6 days/yr
- Hot days in 30 yrs
- 15 days/yr
Wind risk 1/10 · Minimal
- Chance of severe wind over 30 yrs
- —
Air-quality risk 7/10 · Major
- Unhealthy air days now
- 13 days/yr
- Unhealthy air days in 30 yrs
- 15 days/yr
Risk factors via First Street. Map © Google.
Why this score? — see what drove the D- grade
The composite is a weighted blend of 9 inputs, each scored 0–100. Each bar is that input's sub-score; the figure is the points it added to the 100-point composite (weight × sub-score).
- Appreciation +10.0/10.0
- ARV discount +7.5/15.0
- Cash flow +6.0/30.0
- Rent growth +3.9/5.0
- Condition / age +2.5/5.0
- Livability +2.2/5.0
- Schools +2.1/10.0
- 1% rule +1.3/10.0
- DSCR +0.3/10.0
$375,000
🖨 Deal sheet (PDF) 📄 Offer letter ✓ Due diligence
Listing remarks MLS
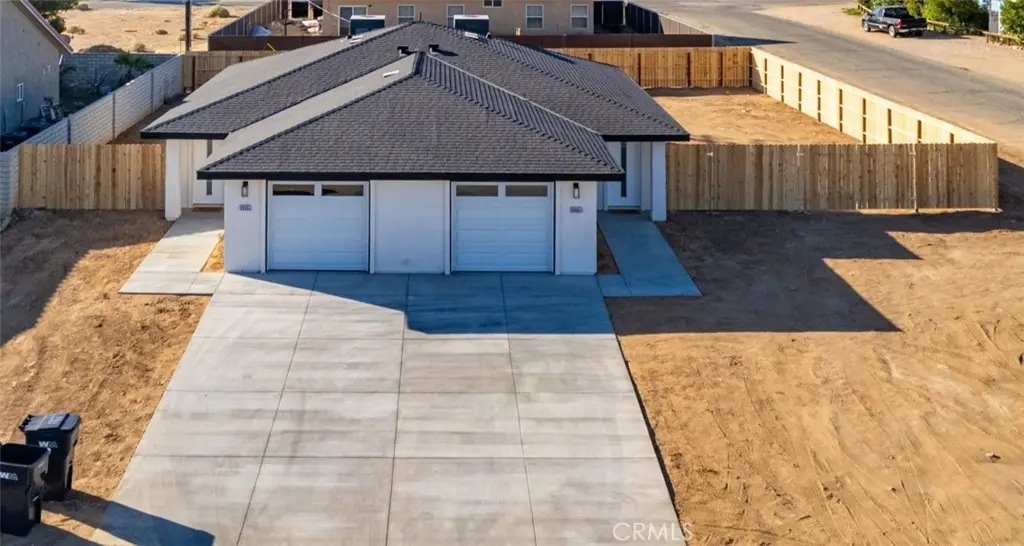
Welcome to Your Next Investment with Paid Solar panels! Enjoy Modern Living with this Brand-New Duplex! . Offering modern upgrades, desirable features, and the potential for excellent rental income, this property is a smart choice for savvy investors! Enjoy the benefits of new construction with stylish finishes, updated appliances, and contemporary design throughout both units. Quartz countertops, laminate flooring, modern cabinetry and fixtures throughout! The open floor plans create a spacious and inviting atmosphere, appealing to today's renters. Each unit features 2 bedrooms and 1 bath, one car garage. (850 sq. ft. per unit) Imagine retaining tenants with the desirable features and modern upgrades, generating consistent rental income and building long-term wealth while owning a low-maintenance property with the benefits of new construction. Let's start expanding your business portfolio today!
Key facts
- Stylish finishes
- Updated appliances
- Paid solar panels
Tags
Neighborhood map
What this means for you Summary
Snapshot
- This is a 6-bed/2.0-bath land listed at $375k.
Deal economics
- At list price, monthly cash flow is $-721 ($-9k/yr) — negative.
- To cash-flow at today's rent, offer at most $271k (27.8% below list).
- To meet the 1% rule (rent ≥ 1% of price), the offer needs to be $237k (36.9% below list).
- Recommended offer: $237k (36.9% below list) — sets the bar for 1% rule.
- Cap rate 4.0% vs local median 5.3% in California City — below-typical yield; the buyer is paying a premium for something (appreciation thesis, condition, location) that the cap rate doesn't capture.
Location & tenants
- Location reads 44/100 on livability (#1,329 in CA) — a working-class tenant base; expect higher turnover. Strengths: housing A+; Watch: crime F, amenities F, commute F.
- Mojave Unified (town): math 25% / reading 25% proficiency, ranked #411 of 517 in CA (top 80%) — low school quality limits family demand, transient renter base, plan for 1-2y turnover; 76% free/reduced lunch — lower-income household profile, screen leases tightly.
- Zoned schools: Hacienda Elementary (528 students, 92% FRL); California City Middle (501 students, 87% FRL); California City High (655 students, 85% FRL).
- Market conditions: Rents rising fast (+5.5%/yr); 704 active listings in the ZIP; 3,244 units permitted in Kern County in 2024 (73 in 5+ unit buildings).
- At $2,367/mo this rent would consume 47% of the median local household income ($60k/yr) (locally 883% of renters already pay >50% of income on rent) — very limited rent-growth headroom before tenants either downsize or default.
Forward outlook
- In year one you build about $40k of equity ($3k loan paydown + $38k appreciation (10.0% local appreciation)).
- Kern County population projected at +17% by 2050 — long-run rental-demand tailwind backs the buy-and-hold thesis.
- By year 2, paydown + projected appreciation supports a ~$64k cash-out refi (75% LTV) — recoverable capital for the next deal without selling this one.
Negotiation context
- It's been on market 60 days — a 3% lower offer ($364k) is reasonable based on typical stale-listing flexibility.
- 2 sale attempts with the ask held roughly flat each time — persistent listings suggest the price (not the market) is what's stuck; bring a comps-based counter.
- Current owner paid $15k; list at $375k implies a 2400% gain — meaningful room to come down on a strong offer.
Risks & watch-outs
- Climate carrying-cost: extreme-heat days projected 6→15/yr by 2055 (HVAC capex compounding) — expect insurance premiums to compound above CPI over the hold.
Questions for the listing agent
- What do current leases actually rent for vs. the listed asking? Can we see a recent rent roll and the last 12 months of T-12 income?
- It's been on market 60 days. Have you received any prior offers? Is the seller open to a 37% concession, seller financing, or rate buy-down credit?
- Is there a deadline driving the sale (1031 exchange, divorce, estate, relocation)? That informs how much negotiation room exists.
- Schools are F-rated, which usually means shorter tenancies and higher turnover. Who's the typical renter profile here, and what's been the actual vacancy rate?
- Crime grade is F in this area — have there been break-ins, vandalism, or insurance claims at this property in the last 3 years? What carrier currently insures it and at what premium?
- The area grade is low — what's the realistic commute time and amenity access for the typical tenant pool here? Any planned neighborhood developments (good or bad) we should know about?
- What's the average days-on-market for RENTAL listings here right now (not sales)? A rising rental-DOM trend means longer vacancies and softer asking-rent achievability than the comps imply.
- What's the recent tenant-quality profile in this submarket — average credit score on applications, eviction rate, late-payment / NSF rate, and stable-employment percentage? A property-management company in the area should have these aggregated.
- How much new for-sale + rental construction is in the pipeline within 1–3 miles? Heavy new supply typically softens prices + rents 12–24 months out; constrained supply supports both.
Investment metrics
- 1% rule
- 0.63% ✗
- Cap rate
- 3.98%
- Cash-on-cash
- -8.24%
- DSCR
- 0.63
- GRM
- 13.2
CMA / ARV
- ARV (median comp)
- $16,250
- List price
- $375,000
- Delta
- 2207.69%
- Verdict
- OVERPRICED
- Comps
- 6 within 1.0 mi
Projected returns pro-forma
10.0% appreciation · 5.45% rent growth · sell at horizon
- IRR
- 19.1%
- Equity multiple
- 2.56×
- Total profit
- $164,307
- Equity at exit
- $337,830
- IRR
- 18.1%
- Equity multiple
- 6.08×
- Total profit
- $533,454
- Equity at exit
- $728,543
Cash invested: $105,000 (down + closing). Projections, not guarantees.
Landlord ↔ Tenant lean methodology
- Overall (STATE)
- 18 Strongly Tenant-Friendly
- State California
- 18 Strongly Tenant-Friendly · D+13
- County
- — inherits STATE
- City
- — inherits STATE
ZIP-level market 93505
- Home prices YoY
- 13.0%
- Rents YoY
- 5.5%
- Active inventory
- 704
- Price-to-rent
- 13.2×
Monthly cashflow live
- Estimated rent
- $2,367 medium interval (Pro) →
- Mortgage (P&I)
- −$1,967
- Tax est. 1.5%
- −$469 /mo · $5,625/yr
- Insurance
- −$156
- HOA
- −$0
- Vacancy / Maint / Mgmt
- −$497
- Net cashflow
- $-721
Break-even live
Sensitivity live
| Price | -10% $-462 | -5% $-592 | +0% $-721 | +5% $-851 | +10% $-980 |
|---|---|---|---|---|---|
| Rent | -10% $-908 | -5% $-815 | +0% $-721 | +5% $-628 | +10% $-534 |
| Rate | -1.0pp $-532 | -0.5pp $-626 | base $-721 | +0.5pp $-818 | +1.0pp $-917 |
UW: 25.0% down · 7.5% · 30yr · 1.5% tax · 5.0% vac · 8.0% maint · 8.0% mgmt
Financing live
Cash to close
- Down payment
- $93,750
- Closing costs
- $11,250
- Reserves months
- —
- Total cash needed
- —
Loan-product check · same deal, 3 products live
Conventional
25% down · 7.5% · 30yr
- Down + closing
- —
- Monthly P&I
- —
- Monthly cashflow
- —
- DSCR
- —
- Eligible?
- —
Personal DTI + credit; lowest rate.
DSCR
20% down · 8.5% · 30yr
- Down + closing
- —
- Monthly P&I
- —
- Monthly cashflow
- —
- DSCR
- —
- Eligible?
- —
No personal income docs; deal must DSCR.
Hard money
10% down · 12.0% · 12mo
- Down + closing
- —
- Monthly P&I
- —
- Monthly cashflow
- —
- DSCR
- —
- Eligible?
- —
Short-term bridge; refi at stabilization.
Listing history 14 events
-
2026-06-13days on market $375,000 Active 60 DOM
-
2026-06-10days on market $375,000 Active 58 DOM
-
2026-06-09days on market $375,000 Active 57 DOM
-
2026-06-08days on market $375,000 Active 56 DOM
-
2026-06-07days on market $375,000 Active 55 DOM
-
2026-06-05days on market $375,000 Active 52 DOM
-
2026-06-03days on market $375,000 Active 51 DOM
-
2026-06-03days on market $375,000 Active 50 DOM
-
2026-06-01days on market $375,000 Active 49 DOM
-
2026-05-31days on market $375,000 Active 48 DOM
-
2026-04-13$375,000 Active 909-char remark
Show marketing remark (909 chars)
Welcome to Your Next Investment with Paid Solar panels! Enjoy Modern Living with this Brand-New Duplex! . Offering modern upgrades, desirable features, and the potential for excellent rental income, this property is a smart choice for savvy investors! Enjoy the benefits of new construction with stylish finishes, updated appliances, and contemporary design throughout both units. Quartz countertops, laminate flooring, modern cabinetry and fixtures throughout! The open floor plans create a spacious and inviting atmosphere, appealing to today's renters. Each unit features 2 bedrooms and 1 bath, one car garage. (850 sq. ft. per unit) Imagine retaining tenants with the desirable features and modern upgrades, generating consistent rental income and building long-term wealth while owning a low-maintenance property with the benefits of new construction. Let's start expanding your business portfolio today!
-
2025-04-04soldstatus $15,000 Closed Sale 393-char remark
Show marketing remark (393 chars)
The approximate addresses are 21760 and 21761 Ives Dr, California City, CA 93505 For sale are two R2 zoned lots with over 11,800 square feet each and a total square feet of 23,810. Electricity is overhead, water is in the front of the lots, and sewer is on Frontage Rd/Randsburg Mojave Rd or by septic. These lots are 214 and 215 on Ives Dr. The sales price is for both lots. Priced to sell.
-
2025-03-13status Pending Sale 393-char remark
Show marketing remark (393 chars)
The approximate addresses are 21760 and 21761 Ives Dr, California City, CA 93505 For sale are two R2 zoned lots with over 11,800 square feet each and a total square feet of 23,810. Electricity is overhead, water is in the front of the lots, and sewer is on Frontage Rd/Randsburg Mojave Rd or by septic. These lots are 214 and 215 on Ives Dr. The sales price is for both lots. Priced to sell.
-
2025-03-11$15,000 Active 393-char remark
Show marketing remark (393 chars)
The approximate addresses are 21760 and 21761 Ives Dr, California City, CA 93505 For sale are two R2 zoned lots with over 11,800 square feet each and a total square feet of 23,810. Electricity is overhead, water is in the front of the lots, and sewer is on Frontage Rd/Randsburg Mojave Rd or by septic. These lots are 214 and 215 on Ives Dr. The sales price is for both lots. Priced to sell.
ⓘ Source: listings_history table (triggers on properties + properties_extension) + one-shot
backfill from property_details.listing_events for pre-trigger history.
Climate risk First Street
- Flood 1/10 Low FEMA zone X (unshaded) · 0% chance over 30 yrs
- Wildfire 1/10 Low
- Heat 8/10 Severe 6 d/yr ≥101°F today · 15 d/yr by 30 yrs out
- Wind 1/10 Low
- Air quality 7/10 Severe 13 unhealthy d/yr today · 15 by 30 yrs out
Nearby sold comps map
Loading sold comps map…
Walkable amenities ~0.75 mi
Loading nearby amenities…
Taxation est. · year 1
- Rental income
- $28,408
- − Mortgage interest
- −$21,006
- − Property taxes
- −$5,625
- − Insurance
- −$1,875
- − Repairs & maintenance
- −$2,273
- − Management
- −$2,273
- − Depreciation
- −$10,909
- Taxable loss
- −$15,552
- Est. tax savings @ 24.0%
- +$3,732
- After-tax cash flow
- $-4,923/yr
For passive investors: Depreciation is non-cash, so a rental often shows a tax loss while cash-flowing — sheltering income. Rental losses are passive: they offset passive income freely, and up to $25,000/yr can offset ordinary (W-2) income if you actively participate and your MAGI is under $100k (phasing out to $0 by $150k); unused losses carry forward. On sale, claimed depreciation is recaptured at up to 25%, and gains may owe capital-gains tax (a 1031 exchange can defer both). Figures are a year-1 estimate at your 24.0% rate — not tax advice; consult a CPA.
Schools (NCES district)
- District
- Mojave Unified
- NCES district ID
- 0625230
- Math proficiency
- 25% ▲ 11.00%
- Reading proficiency
- 25% ▼ -1.00%
- Median HH income
- $43,017
- Composite
- 21.4/100
- National rank
- #8350
- State rank
- #411 of 517 in CA
Livability — California City
- Score
- 44/100
- State rank
- #1329
- US rank
- #26753
Category grades
Schools grade is shown separately in the Schools card above.
Census & demographics
- Census place
- California City, CA
- County
- Kern County · 710,371 people
- City population
- 14,353
- Metro
- Bakersfield, CA
- Population (ZIP)
- 14,353
- Household income
- $59,827
- Rent vs Own
- Severe rent burden
- 883.0
Population outlook (Kern County) Hauer SSP2
- Today (2025)
- 947,286 people
- By 2030
- 978,984 · +3.3%
- By 2040
- 1,045,018 · +10.3%
- By 2050
- 1,105,232 · +16.7%
- By 2075
- 1,229,538 · +29.8%
- By 2100
- 1,238,059 · +30.7%
Race, ethnicity, and origin ACS 2023
- Neighborhood character
- Highly diverse neighborhood (Simpson 0.70)
- Race & ethnicity
- Hispanic / Latino 40% White 30% Black 22% Two or more races 16% Native American 3% Asian 1%
- Hispanic origin (detail)
- Mexican 29%
- Common ancestry
- Italian 3% Lithuanian 1% Romanian 1%
- Foreign-born
- 13% · Canada, Dominican Republic
- Languages at home
- 68% English-only · Spanish 29%
Political lean MEDSL · Kern
- 2024 margin
- Strong R (+21.1) · D 38.2% · R 59.3% · Other 2.5%
- 2008→2024 swing
- -3.3pp toward R · 2008: -17.8pp · 2024: -21.1pp
- All cycles
- 2024: R+21.1 2020: R+10.2 2016: R+15.0 2012: R+20.9 2008: R+17.8
Not yet ingested
- Civics
- —
Market trends
- HPI YoY
- ▲ 46.32%
- Current HPI
- 402.4192
- Rent YoY
- ▲ 5.45%
- Metro
- Bakersfield, CA
- State GDP YoY
- ▲ 3.21%
- F500 in state
- 116
Industry mix (Fortune 500 HQ in CA)
| Industry | F500 HQs | Revenue |
|---|---|---|
| Technology | 27 | $1,492B |
|
||
| Financial Services | 3 | $174B |
|
||
| Retail | 3 | $44B |
|
||
| Insurance | 3 | $26B |
|
||
| Media / Entertainment | 2 | $115B |
|
||
| Pharmaceuticals / Biotech | 2 | $62B |
|
||
Price history
+2400.0% since first listed4 events — show timeline
- 2026-04-13 Listed $375,000 CRMLS
- 2025-04-04 Sold (MLS) $15,000 CRMLS
- 2025-03-13 Pending — CRMLS
- 2025-03-11 Listed $15,000 CRMLS
Property tax history
-12.1%/yrLatest (2025): $52 · -35.2% YoY. Source: county tax records.
Cash-flow waterfall
monthlySold comps — $/sqft
last 12 mo · ≤1 miLoading sold comps…