11743 N CR 200e · Farmersburg, IN
Flood risk 1/10 · Minimal
- FEMA flood zone
- —
- Chance of flooding over 30 yrs
- 0.0%
- Est. flood insurance / yr
- —
Fire risk 3/10 · Minor
- Est. fire insurance / yr
- $717 – $1,331
Heat risk 4/10 · Minor
- Hot days now (above 104°F)
- 7 days/yr
- Hot days in 30 yrs
- 19 days/yr
Wind risk 2/10 · Minimal
- Chance of severe wind over 30 yrs
- 1.0%
Air-quality risk 3/10 · Minor
- Unhealthy air days now
- 1 days/yr
- Unhealthy air days in 30 yrs
- 3 days/yr
Risk factors via First Street. Map © Google.
Why this score? — see what drove the F grade
The composite is a weighted blend of 9 inputs, each scored 0–100. Each bar is that input's sub-score; the figure is the points it added to the 100-point composite (weight × sub-score).
- ARV discount +7.5/15.0
- Cash flow +7.1/30.0
- Livability +3.2/5.0
- Schools +2.7/10.0
- Rent growth +2.5/5.0
- Condition / age +2.5/5.0
- Appreciation +1.4/10.0
- DSCR +1.3/10.0
- 1% rule +1.0/10.0
$189,900
🖨 Deal sheet 📄 Offer letter ✓ Due diligence
Listing remarks
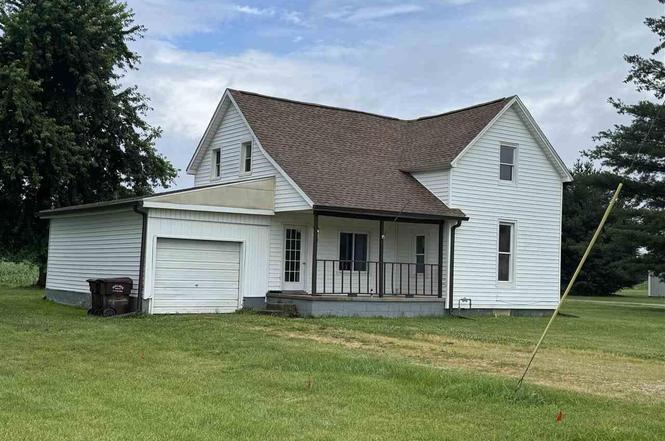
Welcome to this charming 1 1/2 story home offering 4 bedrooms and 2 full baths, perfectly situated on over a half-acre corner lot. This vinyl-sided property features some newer windows, providing both efficiency and comfort. New gutters were installed in May, 2026. Step inside to a spacious living room complete with built-in bookshelves, creating a warm and inviting space for relaxing or entertaining. The eat-in kitchen offers functionality and convenience, with plenty of room for everyday dining. Enjoy additional living space in the enclosed 3-season room, which is heated and cooled—ideal for year-round enjoyment whether you're sipping morning coffee or hosting guests. The home also
Key facts
- Ample outdoor space
- Attached garage
- Newer windows
Tags
Property features AI
Exterior
- Parking: 1-car garage; Gravel parking
- Security: Smoke detector(s)
- Utilities: Septic tank
- Home design: Single-family residence; One story
- Construction: Vinyl siding construction; Shingle roof; Crawl space foundation; Built as a single-story home
- Exterior features: Covered patio/porch; Shingle roof; Vinyl siding
Interior
- Kitchen: Refrigerator
- Bedrooms: Total of 8 rooms (bedroom count not specified)
- Flooring: Carpet; Laminate; Vinyl
- Bathrooms: 2 full bathrooms
- Heating & cooling: Heat pump and natural gas heating; Central air; Ceiling fans; Wall/window AC units
- Interior features: Refrigerator included; Crawl space basement; Smoke detectors
- Laundry & utility: No laundry details provided
Neighborhood map
What this means for you Summary
Snapshot
- This is a 2-bed/2.0-bath single-family listed at $190k.
Deal economics
- At list price, monthly cash flow is $-271 ($-3k/yr) — negative.
- To cash-flow at today's rent, offer at most $142k (25.2% below list).
- To meet the 1% rule (rent ≥ 1% of price), the offer needs to be $114k (39.7% below list).
- Recommended offer: $114k (39.7% below list) — sets the bar for 1% rule.
Location & tenants
- Location reads 63/100 on livability (#434 in IN) — a middle-class / working-renter tenant base. Strengths: crime A+, cost of living A+, housing A; Watch: employment D+, amenities F, commute F.
- Northeast School Corporation (rural): math 29% / reading 34% proficiency, ranked #228 of 301 in IN (top 76%) — families likely to look elsewhere, expect single-tenant / working-renter base with shorter leases.
- Zoned schools: North Central Jr/Sr High School (math 12% / reading 32%, grade F, #343 of 369 statewide, top 93%, 374 students, 55% FRL).
- Market conditions: 19 active listings in the ZIP; 4 units permitted in Sullivan County in 2024 (0 in 5+ unit buildings).
Forward outlook
- Local home prices are declining (-3.0%/yr); year-one equity from $1k of loan paydown is wiped out by about $6k of value loss. Plan a longer hold.
- Sullivan County population projected at -12% by 2050 — secular population decline; favor cash flow + early exit over multi-decade hold.
Negotiation context
- Only 9 days on market — expect competitive offers; lowballing is unlikely to land.
- Current owner paid $20k; list at $190k implies a 826% gain — meaningful room to come down on a strong offer.
Risks & watch-outs
- Watch-outs: built in 1930 — expect roof / HVAC / electrical / plumbing capex.
Questions for the listing agent
- What do current leases actually rent for vs. the listed asking? Can we see a recent rent roll and the last 12 months of T-12 income?
- Built in 1930 — when were the roof, HVAC, electrical panel, plumbing, and water heater last replaced?
- Is there a deadline driving the sale (1031 exchange, divorce, estate, relocation)? That informs how much negotiation room exists.
- The area grade is low — what's the realistic commute time and amenity access for the typical tenant pool here? Any planned neighborhood developments (good or bad) we should know about?
- What's the average days-on-market for RENTAL listings here right now (not sales)? A rising rental-DOM trend means longer vacancies and softer asking-rent achievability than the comps imply.
- What's the recent tenant-quality profile in this submarket — average credit score on applications, eviction rate, late-payment / NSF rate, and stable-employment percentage? A property-management company in the area should have these aggregated.
- How much new for-sale + rental construction is in the pipeline within 1–3 miles? Heavy new supply typically softens prices + rents 12–24 months out; constrained supply supports both.
Investment metrics
- 1% rule
- 0.60% ✗
- Cap rate
- 4.58%
- Cash-on-cash
- -6.11%
- DSCR
- 0.73
- GRM
- 13.8
CMA / ARV
No comps found within radius.
Projected returns pro-forma
-3.0% appreciation · 3.0% rent growth · sell at horizon
- IRR
- -26.9%
- Equity multiple
- 0.10×
- Total profit
- $-48,073
- Equity at exit
- $28,315
- IRR
- -24.6%
- Equity multiple
- -0.21×
- Total profit
- $-64,325
- Equity at exit
- $16,419
Cash invested: $53,172 (down + closing). Projections, not guarantees.
Landlord ↔ Tenant lean methodology
- Overall (STATE)
- 90 Strongly Landlord-Friendly
- State Indiana
- 90 Strongly Landlord-Friendly · R+11
- County
- — inherits STATE
- City
- — inherits STATE
ZIP-level market 47850
- Home prices YoY
- -3.8%
- Active inventory
- 19
- Price-to-rent
- 13.8×
Monthly cashflow live
- Estimated rent
- $1,145 medium interval (Pro) →
- Mortgage (P&I)
- −$996
- Tax from tax record
- −$100 /mo · $1,198/yr
- Insurance
- −$79
- HOA
- −$0
- Vacancy / Maint / Mgmt
- −$240
- Net cashflow
- $-271
Break-even live
UW: 25.0% down · 7.5% · 30yr · 1.5% tax · 5.0% vac · 8.0% maint · 8.0% mgmt
Financing live
Cash to close
- Down payment
- $47,475
- Closing costs
- $5,697
- Reserves months
- —
- Total cash needed
- —
Loan-product check · same deal, 3 products live
Conventional
25% down · 7.5% · 30yr
- Down + closing
- —
- Monthly P&I
- —
- Monthly cashflow
- —
- DSCR
- —
- Eligible?
- —
Personal DTI + credit; lowest rate.
DSCR
20% down · 8.5% · 30yr
- Down + closing
- —
- Monthly P&I
- —
- Monthly cashflow
- —
- DSCR
- —
- Eligible?
- —
No personal income docs; deal must DSCR.
Hard money
10% down · 12.0% · 12mo
- Down + closing
- —
- Monthly P&I
- —
- Monthly cashflow
- —
- DSCR
- —
- Eligible?
- —
Short-term bridge; refi at stabilization.
Listing history 8 events
-
2026-06-19days on market $189,900 Active 9 DOM
-
2026-06-18days on market $189,900 Active 8 DOM
-
2026-06-17days on market $189,900 Active 7 DOM
-
2026-06-16days on market $189,900 Active 6 DOM
-
2026-06-15days on market $189,900 Active 5 DOM
-
2026-06-14days on market $189,900 Active 3 DOM
-
2026-06-13remarks 693-char remark
-
2026-06-13$189,900 Active 2 DOM
ⓘ Source: listings_history table (triggers on properties + properties_extension) + one-shot
backfill from property_details.listing_events for pre-trigger history.
Tax reassessment forecast IN · Partial reset (capped growth)
- Current annual tax
- $1,198 · $100/mo
- Projected year-2 tax
- $1,406 · $117/mo
- Expected delta
- +$208/yr (+$17/mo · 17.4%)
ⓘ Screening estimate from a state-policy table — verify with the county assessor before closing.
Climate risk First Street
- Flood 1/10 Low 0% chance over 30 yrs
- Wildfire 3/10 Moderate
- Heat 4/10 Moderate 7 d/yr ≥104°F today · 19 d/yr by 30 yrs out
- Wind 2/10 Low 100% chance of damaging wind over 30 yrs
- Air quality 3/10 Moderate 1 unhealthy d/yr today · 3 by 30 yrs out
Nearby sold comps map
Loading sold comps map…
Walkable amenities ~0.75 mi
Loading nearby amenities…
Taxation est. · year 1
- Rental income
- $13,735
- − Mortgage interest
- −$10,637
- − Property taxes
- −$1,198
- − Insurance
- −$950
- − Repairs & maintenance
- −$1,099
- − Management
- −$1,099
- − Depreciation
- −$5,524
- Taxable loss
- −$6,772
- Est. tax savings @ 24.0%
- +$1,625
- After-tax cash flow
- $-1,622/yr
For passive investors: Depreciation is non-cash, so a rental often shows a tax loss while cash-flowing — sheltering income. Rental losses are passive: they offset passive income freely, and up to $25,000/yr can offset ordinary (W-2) income if you actively participate and your MAGI is under $100k (phasing out to $0 by $150k); unused losses carry forward. On sale, claimed depreciation is recaptured at up to 25%, and gains may owe capital-gains tax (a 1031 exchange can defer both). Figures are a year-1 estimate at your 24.0% rate — not tax advice; consult a CPA.
Schools (NCES district)
- District
- Northeast School Corporation
- NCES district ID
- 1808160
- Math proficiency
- 29% ▼ -10.00%
- Reading proficiency
- 34% ▼ -7.00%
- Median HH income
- $45,565
- Composite
- 27.01/100
- National rank
- #7061
- State rank
- #228 of 301 in IN
Livability — Farmersburg
- Score
- 63/100
- State rank
- #434
- US rank
- #15622
Category grades
Schools grade is shown separately in the Schools card above.
Census & demographics
- Census place
- Farmersburg, IN
- Population (ZIP)
- 2,027
Population outlook (Sullivan County) Hauer SSP2
- Today (2025)
- 20,313 people
- By 2030
- 19,908 · -2.0%
- By 2040
- 19,009 · -6.4%
- By 2050
- 17,972 · -11.5%
- By 2075
- 14,929 · -26.5%
- By 2100
- 11,391 · -43.9%
Race, ethnicity, and origin ACS 2023
- Neighborhood character
- Predominantly White (95%)
- Race & ethnicity
- White 95% Asian 4%
- Common ancestry
- Italian 4% Slovak 3% Romanian 3%
- Foreign-born
- 4% · Canada
- Languages at home
- 99% English-only · Other Asian/Pacific 1%
Political lean MEDSL · Sullivan
- 2024 margin
- Solid R (+52.7) · D 22.8% · R 75.5% · Other 1.7%
- 2008→2024 swing
- -52.0pp toward R · 2008: -0.7pp · 2024: -52.7pp
- All cycles
- 2024: R+52.7 2020: R+50.5 2016: R+47.0 2012: R+20.6 2008: R+0.7
Not yet ingested
- Civics
- —
Market trends
- HPI YoY
- ▼ -7.13%
- Current HPI
- 183.1507
- Rent YoY
- —
- Metro
- —
- State GDP YoY
- ▲ 2.90%
- F500 in state
- 18
Industry mix (Fortune 500 HQ in IN)
| Industry | F500 HQs | Revenue |
|---|---|---|
| Industrial Machinery | 2 | $37B |
|
||
| Healthcare | 1 | $177B |
|
||
| Pharmaceuticals | 1 | $45B |
|
||
| Metals / Steel | 1 | $18B |
|
||
| Agriculture | 1 | $17B |
|
||
| Packaging | 1 | $12B |
|
||
Price history
+826.3% since first listed2 events — show timeline
- 2026-06-10 Listed $189,900 THAAR
- 2002-12-30 Sold (Public Records) $20,500 Public Records
Property tax history
+4.8%/yrLatest (2024): $1,198 · -0.8% YoY. Source: county tax records.
Cash-flow waterfall
monthlySold comps — $/sqft
last 12 mo · ≤1 miLoading sold comps…