 Duplex
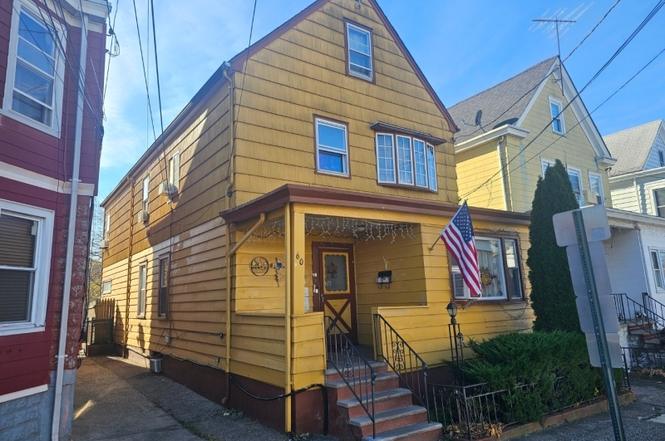
60 Murray Ave #2 · Paterson, NJ
Flood risk 7/10 · Major
- FEMA flood zone
- X (unshaded)
- Chance of flooding over 30 yrs
- 0.99%
- Est. flood insurance / yr
- $507 – $1,088
Fire risk 1/10 · Minimal
- Est. fire insurance / yr
- $526 – $976
Heat risk 7/10 · Major
- Hot days now (above 99°F)
- 7 days/yr
- Hot days in 30 yrs
- 15 days/yr
Wind risk 6/10 · Moderate
- Chance of severe wind over 30 yrs
- 27.0%
Air-quality risk 4/10 · Minor
- Unhealthy air days now
- 3 days/yr
- Unhealthy air days in 30 yrs
- 5 days/yr
Risk factors via First Street. Map © Google.
Why this score? — see what drove the D grade
The composite is a weighted blend of 9 inputs, each scored 0–100. Each bar is that input's sub-score; the figure is the points it added to the 100-point composite (weight × sub-score).
- Cash flow +11.9/30.0
- ARV discount +7.5/15.0
- Appreciation +5.5/10.0
- Rent growth +5.0/5.0
- DSCR +3.5/10.0
- Livability +3.5/5.0
- 1% rule +3.4/10.0
- Condition / age +2.5/5.0
- Schools +1.3/10.0
$585,000
🖨 Deal sheet (PDF) 📄 Offer letter ✓ Due diligence
Multi-family units
County records classify this as Multi-Family (2-4 Unit). Listing-text estimate: 2 units. confirmed
Listing remarks
Two units house within walking distance from Pennington Park in Paterson, NJ. This property presents an excellent opportunity for both investors was well as owner-occupants. Each unit offers comfortable living space with 3 bedrooms, Living room, Eat In kitchen anseparate utilities. Finished attic and basement. Strategically located with easy access to public transportation, park, schools and main roads and highways.
Key facts
- Finished attic
- Finished basement
- 3,049 sq ft lot
Tags
Neighborhood map
What this means for you Summary
Snapshot
- This is a 2 × 3-bed/2.0-bath units multifamily listed at $585k.
Deal economics
- At list price, monthly cash flow is $-212 ($-3k/yr) — negative. Per door: $-106/mo.
- To cash-flow at today's rent, offer at most $554k (5.2% below list).
- To meet the 1% rule (rent ≥ 1% of price), the offer needs to be $493k (15.7% below list).
- Recommended offer: $493k (15.7% below list) — sets the bar for 1% rule.
- Cap rate 6.0% vs local median 3.5% in Paterson — top-decile yield for the area; either an underpriced asset or a hidden risk that comps aren't pricing in. Stress-test before assuming the spread holds.
Location & tenants
- Location reads 69/100 on livability (#293 in NJ) — a middle-class / working-renter tenant base. Strengths: amenities A+, commute A+, health & safety A; Watch: schools D, employment D, crime F.
- Paterson Public School District (suburban): math 6% / reading 26% proficiency, ranked #458 of 472 in NJ (top 97%) — low school quality limits family demand, transient renter base, plan for 1-2y turnover; 83% free/reduced lunch — lower-income household profile, screen leases tightly.
- Market conditions: Rents rising fast (+11.4%/yr); 52 active listings in the ZIP; 2 comparable units currently listed for rent nearby; lower-income renter base — watch delinquency; 860 units permitted in Passaic County in 2024 (614 in 5+ unit buildings).
- At $4,933/mo this rent would consume 134% of the median local household income ($44k/yr) (locally 3954% of renters already pay >50% of income on rent) — very limited rent-growth headroom before tenants either downsize or default.
Forward outlook
- In year one you build about $10k of equity ($4k loan paydown + $6k appreciation (1.0% local appreciation)).
- Passaic County population projected at +5% by 2050 — modest demand growth; plan on rents tracking national, not racing it.
- By year 4, paydown + projected appreciation supports a ~$36k cash-out refi (75% LTV) — recoverable capital for the next deal without selling this one.
Negotiation context
- Only 2 days on market — expect competitive offers; lowballing is unlikely to land.
Risks & watch-outs
- Watch-outs: flood insurance adds $66/mo; built in 1930 — expect roof / HVAC / electrical / plumbing capex.
- Climate carrying-cost: major flood risk; major wind risk, 27% chance of damaging wind over 30y; extreme-heat days projected 7→15/yr by 2055 (HVAC capex compounding) — expect insurance premiums to compound above CPI over the hold.
Questions for the listing agent
- What do current leases actually rent for vs. the listed asking? Can we see a recent rent roll and the last 12 months of T-12 income?
- Can we see the unit-by-unit rent roll, current vacancy, and any below-market leases? What's the average tenancy length?
- What capital expenditures (roof, boiler, parking lot, exteriors) have been made in the last 5 years, and what's planned in the next 2?
- Built in 1930 — when were the roof, HVAC, electrical panel, plumbing, and water heater last replaced?
- What's the actual annual flood-insurance premium (NFIP or private), and is the property in a SFHA with mandatory coverage?
- Is there a deadline driving the sale (1031 exchange, divorce, estate, relocation)? That informs how much negotiation room exists.
- Schools are D-rated, which usually means shorter tenancies and higher turnover. Who's the typical renter profile here, and what's been the actual vacancy rate?
- Crime grade is F in this area — have there been break-ins, vandalism, or insurance claims at this property in the last 3 years? What carrier currently insures it and at what premium?
- The area grade is low — what's the realistic commute time and amenity access for the typical tenant pool here? Any planned neighborhood developments (good or bad) we should know about?
- What's the average days-on-market for RENTAL listings here right now (not sales)? A rising rental-DOM trend means longer vacancies and softer asking-rent achievability than the comps imply.
- What's the recent tenant-quality profile in this submarket — average credit score on applications, eviction rate, late-payment / NSF rate, and stable-employment percentage? A property-management company in the area should have these aggregated.
- How much new apartment / multifamily construction is in the pipeline within 1–3 miles? Heavy new supply (>2% of stock underway) typically softens rents 12–24 months out; light construction supports rent growth.
Investment metrics
- 1% rule
- 0.84% ✗
- Cap rate
- 5.99%
- Cash-on-cash
- -1.07%
- DSCR
- 0.95
- GRM
- 9.9
CMA / ARV
No comps found within radius.
Show comp detail 12 sales within ~0.75 mi
| Address | Dist | Beds/Ba | Sqft | Sold | Price | $/sf | Match |
|---|---|---|---|---|---|---|---|
| 95-97 Caldwell Ave | 0.12mi | 5/2.0 (-1) | — | 6mo | $750,000 | — | 64 |
| 72-74 Maple St | 0.36mi | 5/4.0 (-1) | — | 4mo | $600,000 | — | 62 |
| 66 Danforth Ave | 0.28mi | 7/3.0 (+1) | — | 5mo | $835,000 | — | 61 |
| 113 Turner St | 0.28mi | 5/3.0 (-1) | — | 7mo | $650,000 | — | 60 |
| 320-322 Dixon Ave | 0.43mi | 5/3.0 (-1) | — | 4mo | $840,000 | — | 55 |
| 262 Union Ave | 0.56mi | 7/4.0 (+1) | — | 3mo | $730,000 | — | 54 |
| 30-32 Union Ave | 0.59mi | 7/4.0 (+1) | — | 4mo | $875,000 | — | 51 |
| 241 Liberty St | 0.61mi | 6/2.0 | — | 6mo | $559,000 | — | 46 |
| 12 Ward St | 0.71mi | 5/3.0 (-1) | — | 1mo | $565,000 | — | 45 |
| 107 Jersey St | 0.67mi | 6/2.5 | — | 7mo | $750,000 | — | 44 |
| 449 Taft Ave | 0.71mi | 5/3.0 (-1) | — | 6mo | $833,000 | — | 40 |
| 190 Mill St | 0.74mi | 5/2.0 (-1) | — | 8mo | $600,000 | — | 34 |
Match score weights: distance 35% · size 25% · config 20% · recency 20%. Top-matched comps best support the ARV.
Projected returns pro-forma
1.01% appreciation · 8.0% rent growth · sell at horizon
- IRR
- 2.8%
- Equity multiple
- 1.15×
- Total profit
- $23,817
- Equity at exit
- $199,929
- IRR
- 10.4%
- Equity multiple
- 2.42×
- Total profit
- $232,569
- Equity at exit
- $265,858
Cash invested: $163,800 (down + closing). Projections, not guarantees.
Landlord ↔ Tenant lean methodology
- Overall (STATE)
- 21 Tenant-Leaning
- State New Jersey
- 21 Tenant-Leaning · D+6
- County
- — inherits STATE
- City
- — inherits STATE
ZIP-level market 07501
- Home prices YoY
- 0.3%
- Rents YoY
- 11.4%
- Active inventory
- 52
- Price-to-rent
- 19.8×
Monthly cashflow live
- Estimated rent
- $4,933 high interval (Pro) →
- Mortgage (P&I)
- −$3,068
- Tax est. 1.5%
- −$731 /mo · $8,775/yr
- Insurance
- −$244
- Flood insurance flood zone
- −$66 /mo · $798/yr
- HOA
- −$0
- Vacancy / Maint / Mgmt
- −$1,036
- Net cashflow
- $-212
Break-even live
Sensitivity live
| Price | -10% $192 | -5% $-10 | +0% $-212 | +5% $-414 | +10% $-616 |
|---|---|---|---|---|---|
| Rent | -10% $-602 | -5% $-407 | +0% $-212 | +5% $-17 | +10% $178 |
| Rate | -1.0pp $82 | -0.5pp $-63 | base $-212 | +0.5pp $-364 | +1.0pp $-518 |
2-unit breakdown (identical units grouped — click to expand)
| Units | Beds | Baths | Est. rent |
|---|---|---|---|
| 2× units | 3 | 2 | $4,934 |
| #1 | 3 | 2 | $2,467 |
| #2 | 3 | 2 | $2,467 |
| Total (2 units) | $4,933 | ||
UW: 25.0% down · 7.5% · 30yr · 1.5% tax · 5.0% vac · 8.0% maint · 8.0% mgmt
Financing live
Cash to close
- Down payment
- $146,250
- Closing costs
- $17,550
- Reserves months
- —
- Total cash needed
- —
Loan-product check · same deal, 3 products live
Conventional
25% down · 7.5% · 30yr
- Down + closing
- —
- Monthly P&I
- —
- Monthly cashflow
- —
- DSCR
- —
- Eligible?
- —
Personal DTI + credit; lowest rate.
DSCR
20% down · 8.5% · 30yr
- Down + closing
- —
- Monthly P&I
- —
- Monthly cashflow
- —
- DSCR
- —
- Eligible?
- —
No personal income docs; deal must DSCR.
Hard money
10% down · 12.0% · 12mo
- Down + closing
- —
- Monthly P&I
- —
- Monthly cashflow
- —
- DSCR
- —
- Eligible?
- —
Short-term bridge; refi at stabilization.
Rent comps 2 comps
| Address | Beds | Baths | Sqft | Rent | $/sqft | DOM | Units | Dist |
|---|---|---|---|---|---|---|---|---|
| 235 Preakness Ave Paterson, NJ | 6.0 | 3.0 | — | $4,900 | — | 0d | 1 | 0.61mi |
| 22 Doremus St #2 Paterson, NJ | 5.0 | 2.0 | — | $2,800 | — | 26d | 1 | 1.02mi |
Listing history 3 events
-
2025-11-22status Under Contract
-
2025-02-04historical
-
2025-02-01$585,000 Active
ⓘ Source: listings_history table (triggers on properties + properties_extension) + one-shot
backfill from property_details.listing_events for pre-trigger history.
Climate risk First Street
- Flood 7/10 Severe FEMA zone X (unshaded) · 99% chance over 30 yrs
- Wildfire 1/10 Low
- Heat 7/10 Severe 7 d/yr ≥99°F today · 15 d/yr by 30 yrs out
- Wind 6/10 Major 27% chance of damaging wind over 30 yrs
- Air quality 4/10 Moderate 3 unhealthy d/yr today · 5 by 30 yrs out
Nearby sold comps map
Loading sold comps map…
Walkable amenities ~0.75 mi
Loading nearby amenities…
Taxation est. · year 1
- Rental income
- $59,196
- − Mortgage interest
- −$32,769
- − Property taxes
- −$8,775
- − Insurance
- −$3,722
- − Repairs & maintenance
- −$4,736
- − Management
- −$4,736
- − Depreciation
- −$17,018
- Taxable loss
- −$12,560
- Est. tax savings @ 24.0%
- +$3,014
- After-tax cash flow
- $468/yr
For passive investors: Depreciation is non-cash, so a rental often shows a tax loss while cash-flowing — sheltering income. Rental losses are passive: they offset passive income freely, and up to $25,000/yr can offset ordinary (W-2) income if you actively participate and your MAGI is under $100k (phasing out to $0 by $150k); unused losses carry forward. On sale, claimed depreciation is recaptured at up to 25%, and gains may owe capital-gains tax (a 1031 exchange can defer both). Figures are a year-1 estimate at your 24.0% rate — not tax advice; consult a CPA.
Schools (NCES district)
- District
- Paterson Public School District
- NCES district ID
- 3412690
- Math proficiency
- 6% ▼ -12.00%
- Reading proficiency
- 26% ▼ -4.00%
- Median HH income
- $34,365
- Composite
- 13.02/100
- National rank
- #9568
- State rank
- #458 of 472 in NJ
Livability — Paterson
- Score
- 69/100
- State rank
- #293
- US rank
- #8763
Category grades
Schools grade is shown separately in the Schools card above.
Census & demographics
- Census place
- Paterson, NJ
- County
- Passaic County · 360,294 people
- City population
- 85,452
- Metro
- New York-Newark-Jersey City, NY-NJ-PA
- Population (ZIP)
- 35,481
- Household income
- $44,300
- Rent vs Own
- Severe rent burden
- 3954.0
Population outlook (Passaic County) Hauer SSP2
- Today (2025)
- 525,915 people
- By 2030
- 532,160 · +1.2%
- By 2040
- 543,670 · +3.4%
- By 2050
- 554,326 · +5.4%
- By 2075
- 584,728 · +11.2%
- By 2100
- 598,978 · +13.9%
Race, ethnicity, and origin ACS 2023
- Neighborhood character
- Predominantly Hispanic (68%)
- Race & ethnicity
- Hispanic / Latino 68% Black 24% Two or more races 8% White 5% Asian 3%
- Hispanic origin (detail)
- Mexican 7% Puerto Rican 10% Dominican 34%
- Foreign-born
- 42% · Canada, Jamaica
- Languages at home
- 34% English-only · Spanish 63% Other Indo-European 3%
Political lean MEDSL · Passaic
- 2024 margin
- Toss-up / Even · D 46.9% · R 49.8% · Other 3.3%
- 2008→2024 swing
- -24.6pp toward R · 2008: 21.7pp · 2024: -2.9pp
- All cycles
- 2024: R+2.9 2020: D+16.5 2016: D+21.8 2012: D+27.3 2008: D+21.7
Not yet ingested
- Civics
- —
Market trends
- HPI YoY
- ▲ 1.01%
- Current HPI
- 292.4223
- Rent YoY
- ▲ 11.37%
- Metro
- New York-Newark-Jersey City, NY-NJ-PA
- State GDP YoY
- ▲ 2.05%
- F500 in state
- 34
Industry mix (Fortune 500 HQ in NJ)
| Industry | F500 HQs | Revenue |
|---|---|---|
| Consumer Goods | 3 | $31B |
|
||
| Pharmaceuticals | 2 | $153B |
|
||
| Technology | 2 | $21B |
|
||
| Insurance | 2 | $20B |
|
||
| Healthcare | 2 | $19B |
|
||
| Financial Services | 1 | $70B |
|
||
Price history
3 events — show timeline
- 2025-11-22 Pending — GSMLS
- 2025-02-04 Delisted — GSMLS
- 2025-02-01 Listed $585,000 GSMLS
Cash-flow waterfall
monthlySold comps — $/sqft
last 12 mo · ≤1 miLoading sold comps…