14315 Core Meadows Dr · Texas City, TX
Flood risk No data
- FEMA flood zone
- —
- Chance of flooding over 30 yrs
- —
- Est. flood insurance / yr
- —
Fire risk No data
- Est. fire insurance / yr
- —
Heat risk No data
- Hot days now (above threshold)
- —
- Hot days in 30 yrs
- —
Wind risk No data
- Chance of severe wind over 30 yrs
- —
Air-quality risk No data
- Unhealthy air days now
- —
- Unhealthy air days in 30 yrs
- —
Risk factors via First Street. Map © Google.
Why this score? — see what drove the D grade
The composite is a weighted blend of 9 inputs, each scored 0–100. Each bar is that input's sub-score; the figure is the points it added to the 100-point composite (weight × sub-score).
- Cash flow +14.9/30.0
- ARV discount +9.7/15.0
- DSCR +4.5/10.0
- 1% rule +4.1/10.0
- Schools +3.5/10.0
- Livability +3.1/5.0
- Rent growth +2.5/5.0
- Condition / age +2.2/5.0
- Appreciation +0.0/10.0
$398,490
🖨 Deal sheet (PDF) 📄 Offer letter ✓ Due diligence
Listing remarks
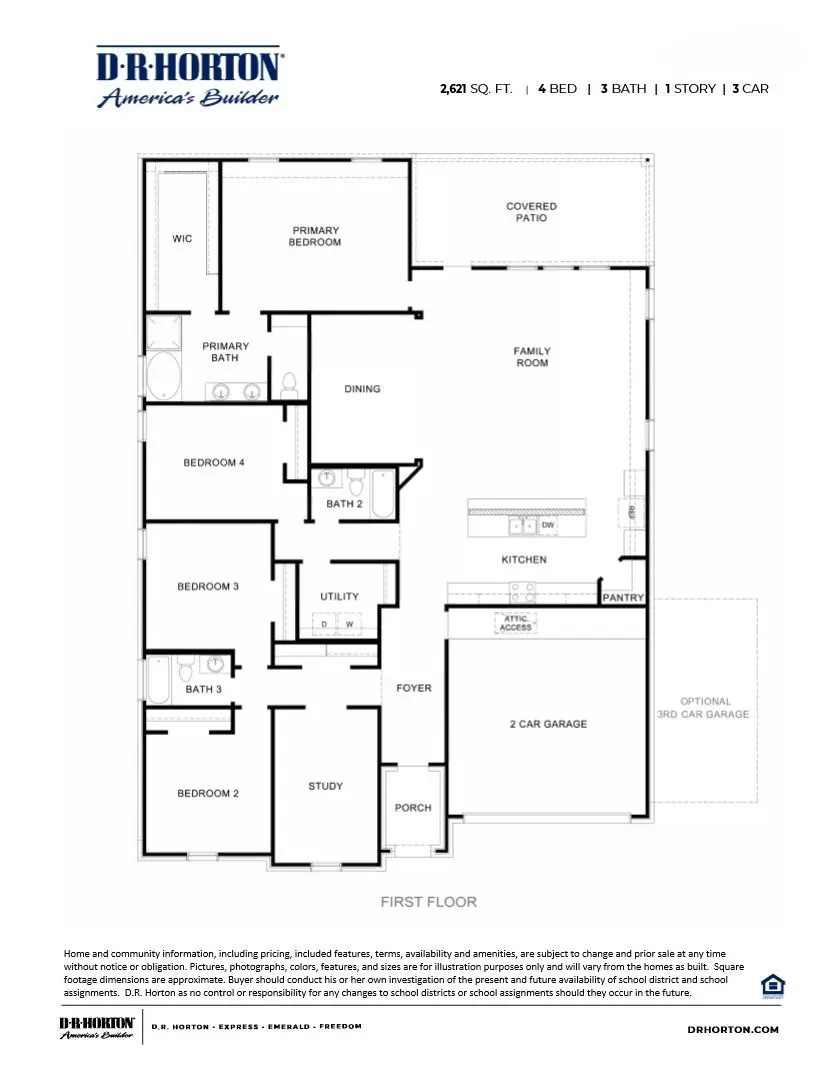
Discover spacious living and modern design in the Cardinale floor plan-now available on oversized 60' homesites in Lago Mar, a vibrant master-planned community located in Texas City, Texas. This thoughtfully designed one-story home offers 4 generously sized bedrooms, 3 full bathrooms and a three-car garage, ideal for growing families or multigenerational living. The open-concept layout connects the gourmet kitchen, dining area, and expansive family room, making it perfect for entertaining or relaxing together. The kitchen features a large island, walk-in pantry, and an optional built-in appliance package for added style and convenience. Just off the dining area, step outside to a covered pa
Key facts
- Cardinale floor plan
- Gourmet kitchen
- Covered patio
Tags
Property features AI
Finance
- Financial info: List price $399,990
Exterior
- Parking: 2-car garage (2 total parking spaces)
- Home design: Single-family property
- Exterior features: Living area of 2621 (measurement provided)
Interior
- Bedrooms: 4 bedrooms
- Bathrooms: 3 full bathrooms
- Interior features: Spec home — Cardinale plan; Active listing (last modified 2026-06-06)
Neighborhood map
What this means for you Summary
Snapshot
- This is a 4-bed/3.0-bath single-family listed at $398k. Condition is rated fair.
Deal economics
- At list price, monthly cash flow is $114 ($1k/yr) — positive.
- The deal already cash-flows at list — no discount required.
- To meet the 1% rule (rent ≥ 1% of price), the offer needs to be $363k (8.9% below list).
- Recommended offer: $363k (8.9% below list) — sets the bar for 1% rule.
- Cap rate 6.6% vs local median 4.3% in Texas City — top-decile yield for the area; either an underpriced asset or a hidden risk that comps aren't pricing in. Stress-test before assuming the spread holds.
Location & tenants
- Location reads 62/100 on livability (#907 in TX) — a middle-class / working-renter tenant base. Strengths: cost of living A+, housing A+; Watch: crime D+, amenities F, commute F.
- Dickinson ISD (suburban): math 39% / reading 40% proficiency, ranked #366 of 826 in TX (top 44%) — families likely to look elsewhere, expect single-tenant / working-renter base with shorter leases; 60% free/reduced lunch — lower-income household profile, screen leases tightly.
- Zoned schools: Hughes Road El (math 36% / reading 31%, grade F, #2,174 of 4,322 statewide, top 51%, 707 students, 67% FRL); Dunbar Middle (math 25% / reading 20%, grade F, #1,341 of 1,662 statewide, top 82%, 654 students, 78% FRL); Dickinson H S (math 30% / reading 46%, grade F, #880 of 1,632 statewide, top 54%, 3,619 students, 64% FRL).
- Market conditions: 236 active listings in the ZIP; 1 comparable units currently listed for rent nearby; 3,258 units permitted in Galveston County in 2024 (0 in 5+ unit buildings).
Forward outlook
- Local home prices are declining (-3.0%/yr); year-one equity from $3k of loan paydown is wiped out by about $12k of value loss. Plan a longer hold.
- Galveston County population projected at +43% by 2050 — long-run rental-demand tailwind backs the buy-and-hold thesis.
Negotiation context
- It's been on market 15 days — a 2% lower offer ($393k) is reasonable based on typical stale-listing flexibility.
Questions for the listing agent
- Have any recent inspections been done? Can we get a copy of the seller's disclosures and any deferred-maintenance estimates?
- Is there a deadline driving the sale (1031 exchange, divorce, estate, relocation)? That informs how much negotiation room exists.
- Schools are F-rated, which usually means shorter tenancies and higher turnover. Who's the typical renter profile here, and what's been the actual vacancy rate?
- Crime grade is D in this area — have there been break-ins, vandalism, or insurance claims at this property in the last 3 years? What carrier currently insures it and at what premium?
- The area grade is low — what's the realistic commute time and amenity access for the typical tenant pool here? Any planned neighborhood developments (good or bad) we should know about?
- What's the average days-on-market for RENTAL listings here right now (not sales)? A rising rental-DOM trend means longer vacancies and softer asking-rent achievability than the comps imply.
- What's the recent tenant-quality profile in this submarket — average credit score on applications, eviction rate, late-payment / NSF rate, and stable-employment percentage? A property-management company in the area should have these aggregated.
- How much new for-sale + rental construction is in the pipeline within 1–3 miles? Heavy new supply typically softens prices + rents 12–24 months out; constrained supply supports both.
Investment metrics
- 1% rule
- 0.91% ✗
- Cap rate
- 6.64%
- Cash-on-cash
- 1.22%
- DSCR
- 1.05
- GRM
- 9.1
CMA / ARV
- ARV (on-the-fly)
- $419,360
- Comps found
- 12
Show comp detail 12 sales within ~0.75 mi
| Address | Dist | Beds/Ba | Sqft | Sold | Price | $/sf | Match |
|---|---|---|---|---|---|---|---|
| 2816 Mackinac Bay Dr | 0.29mi | 4/3.5 | 2,666 (+2%) | 1mo | $452,990 | $170 | 81 |
| 2820 Mackinac Bay Dr | 0.28mi | 3/2.0 (-1) | 2,517 (-4%) | 2mo | $441,990 | $176 | 70 |
| 14318 Lunan Dr | 0.20mi | 4/2.5 | 2,280 (-13%) | 1mo | $364,987 | $160 | 66 |
| 3214 Bolt Rope Dr | 0.47mi | 4/2.5 | 2,452 (-6%) | 1mo | $339,990 | $139 | 65 |
| 14102 Baikal Manor Dr | 0.66mi | 4/2.5 | 2,545 (-3%) | 3mo | $349,990 | $138 | 60 |
| 13614 Hartwell Bend Dr | 0.71mi | 4/4.0 | 2,679 (+2%) | 2mo | $479,990 | $179 | 58 |
| 13602 Hartwell Bend Dr | 0.75mi | 4/4.0 | 2,679 (+2%) | 1mo | $499,990 | $187 | 57 |
| 14002 Baikal Manor Dr | 0.74mi | 4/3.0 | 2,486 (-5%) | 2mo | $352,990 | $142 | 55 |
| 13618 Hartwell Bend Dr | 0.70mi | 4/3.5 | 2,875 (+10%) | 1mo | $439,990 | $153 | 48 |
| 13601 Fairway Arbor Dr | 0.69mi | 3/2.5 (-1) | 2,377 (-9%) | 1mo | $394,990 | $166 | 45 |
| 14030 Baikal Manor Dr | 0.67mi | 5/3.0 (+1) | 2,930 (+12%) | 2mo | $367,990 | $126 | 42 |
| 14010 Baikal Manor Dr | 0.72mi | 4/3.0 | 2,264 (-14%) | 2mo | $343,990 | $152 | 42 |
Match score weights: distance 35% · size 25% · config 20% · recency 20%. Top-matched comps best support the ARV.
Projected returns pro-forma
-3.0% appreciation · 3.0% rent growth · sell at horizon
- IRR
- -14.3%
- Equity multiple
- 0.49×
- Total profit
- $-57,268
- Equity at exit
- $59,416
- IRR
- -5.6%
- Equity multiple
- 0.64×
- Total profit
- $-40,311
- Equity at exit
- $34,454
Cash invested: $111,577 (down + closing). Projections, not guarantees.
Landlord ↔ Tenant lean methodology
- Overall (STATE)
- 87 Strongly Landlord-Friendly
- State Texas
- 87 Strongly Landlord-Friendly · R+5
- County
- — inherits STATE
- City
- — inherits STATE
ZIP-level market 77510
- Home prices YoY
- -15.3%
- Active inventory
- 236
- Price-to-rent
- 9.1×
Monthly cashflow live
- Estimated rent
- $3,630 medium interval (Pro) →
- Mortgage (P&I)
- −$2,090
- Tax est. 1.5%
- −$498 /mo · $5,977/yr
- Insurance
- −$166
- HOA
- −$0
- Vacancy / Maint / Mgmt
- −$762
- Net cashflow
- $114
Break-even live
Sensitivity live
| Price | -10% $389 | -5% $252 | +0% $114 | +5% $-24 | +10% $-162 |
|---|---|---|---|---|---|
| Rent | -10% $-173 | -5% $-30 | +0% $114 | +5% $257 | +10% $401 |
| Rate | -1.0pp $315 | -0.5pp $215 | base $114 | +0.5pp $11 | +1.0pp $-94 |
UW: 25.0% down · 7.5% · 30yr · 1.5% tax · 5.0% vac · 8.0% maint · 8.0% mgmt
Financing live
Cash to close
- Down payment
- $99,622
- Closing costs
- $11,955
- Reserves months
- —
- Total cash needed
- —
Loan-product check · same deal, 3 products live
Conventional
25% down · 7.5% · 30yr
- Down + closing
- —
- Monthly P&I
- —
- Monthly cashflow
- —
- DSCR
- —
- Eligible?
- —
Personal DTI + credit; lowest rate.
DSCR
20% down · 8.5% · 30yr
- Down + closing
- —
- Monthly P&I
- —
- Monthly cashflow
- —
- DSCR
- —
- Eligible?
- —
No personal income docs; deal must DSCR.
Hard money
10% down · 12.0% · 12mo
- Down + closing
- —
- Monthly P&I
- —
- Monthly cashflow
- —
- DSCR
- —
- Eligible?
- —
Short-term bridge; refi at stabilization.
Rent comps 1 comps
| Address | Beds | Baths | Sqft | Rent | $/sqft | DOM | Units | Dist |
|---|---|---|---|---|---|---|---|---|
| 13817 Starboard Reach Dr Santa Fe, TX | 3.0–4.0 | 2.0–3.5 | 2268 | $3,630 | $1.60 | 0d | 1 | 0.42mi |
Listing history 10 events
-
2026-06-21pricedays on market $398,490 Active 15 DOM
-
2026-06-18days on market $398,990 Active 12 DOM
-
2026-06-17days on market $398,990 Active 11 DOM
-
2026-06-16days on market $398,990 Active 10 DOM
-
2026-06-15days on market $398,990 Active 9 DOM
-
2026-06-13pricedays on market $398,990 Active 7 DOM
-
2026-06-09days on market $399,990 Active 3 DOM
-
2026-06-08days on market $399,990 Active 2 DOM
-
2026-06-07remarks 699-char remark
-
2026-06-07$399,990 Active 1 DOM
ⓘ Source: listings_history table (triggers on properties + properties_extension) + one-shot
backfill from property_details.listing_events for pre-trigger history.
Nearby sold comps map
Loading sold comps map…
Walkable amenities ~0.75 mi
Loading nearby amenities…
Taxation est. · year 1
- Rental income
- $43,560
- − Mortgage interest
- −$22,322
- − Property taxes
- −$5,977
- − Insurance
- −$1,992
- − Repairs & maintenance
- −$3,485
- − Management
- −$3,485
- − Depreciation
- −$11,592
- Taxable loss
- −$5,293
- Est. tax savings @ 24.0%
- +$1,270
- After-tax cash flow
- $2,636/yr
For passive investors: Depreciation is non-cash, so a rental often shows a tax loss while cash-flowing — sheltering income. Rental losses are passive: they offset passive income freely, and up to $25,000/yr can offset ordinary (W-2) income if you actively participate and your MAGI is under $100k (phasing out to $0 by $150k); unused losses carry forward. On sale, claimed depreciation is recaptured at up to 25%, and gains may owe capital-gains tax (a 1031 exchange can defer both). Figures are a year-1 estimate at your 24.0% rate — not tax advice; consult a CPA.
Condition & rehab AI · 1 photo
The home is in fair condition with average systems and average exterior. Painting and flooring replacement would significantly enhance its value for both resale and rental.
Repairs flagged
- Minor Paint — Paint appears slightly faded
- Minor Flooring — Flooring shows slight wear
Value-add opportunities
- Both Painting — Fresh paint enhances curb appeal and interior aesthetics
- Both Flooring replacement — New flooring improves comfort and appearance
Renovation cost estimate screening
| Repair item | Severity | Est. cost |
|---|---|---|
| Paint · Paint appears slightly faded | Minor | $500–3,000 |
| Flooring · Flooring shows slight wear | Minor | $500–3,000 |
| Total estimated repair cost · 2 items | $1,000–6,000 |
Value-add ROI direction
- Both Painting — Fresh paint enhances curb appeal and interior aesthetics ↑
- Both Flooring replacement — New flooring improves comfort and appearance ↑
ⓘ Cost ranges are severity-bucket heuristics (US national rule-of-thumb). Get contractor quotes + a written scope before underwriting a rehab budget.
Schools (NCES district)
- District
- Dickinson ISD
- NCES district ID
- 4817070
- Math proficiency
- 39% ▼ -11.00%
- Reading proficiency
- 40% ▼ -2.00%
- Median HH income
- $61,318
- Composite
- 35.16/100
- National rank
- #5005
- State rank
- #366 of 826 in TX
Livability — Texas City
- Score
- 62/100
- State rank
- #907
- US rank
- #16268
Category grades
Schools grade is shown separately in the Schools card above.
Census & demographics
- Census place
- Texas City, TX
- City population
- 49,936
- Population (ZIP)
- 13,938
Population outlook (Galveston County) Hauer SSP2
- Today (2025)
- 390,640 people
- By 2030
- 425,226 · +8.9%
- By 2040
- 493,765 · +26.4%
- By 2050
- 559,698 · +43.3%
- By 2075
- 719,260 · +84.1%
- By 2100
- 819,628 · +109.8%
Race, ethnicity, and origin ACS 2023
- Neighborhood character
- Predominantly White (72%)
- Race & ethnicity
- White 72% Hispanic / Latino 21% Two or more races 17% Asian 2%
- Hispanic origin (detail)
- Mexican 14% Puerto Rican 3% Cuban 1%
- Common ancestry
- Lithuanian 4% Italian 3% Slovak 1%
- Foreign-born
- 5% · Canada
- Languages at home
- 89% English-only · Spanish 10% Tagalog/Filipino 1%
Political lean MEDSL · Galveston
- 2024 margin
- Strong R (+27.4) · D 35.7% · R 63.1% · Other 1.2%
- 2008→2024 swing
- -7.9pp toward R · 2008: -19.5pp · 2024: -27.4pp
- All cycles
- 2024: R+27.4 2020: R+22.6 2016: R+22.6 2012: R+26.9 2008: R+19.5
Not yet ingested
- Civics
- —
Market trends
- HPI YoY
- ▼ -54.15%
- Current HPI
- 299.2228
- Rent YoY
- —
- Metro
- —
- State GDP YoY
- ▲ 3.95%
- F500 in state
- 110
Industry mix (Fortune 500 HQ in TX)
| Industry | F500 HQs | Revenue |
|---|---|---|
| Energy | 16 | $1,198B |
|
||
| Technology | 5 | $198B |
|
||
| Engineering / Construction | 4 | $72B |
|
||
| Energy Services | 3 | $60B |
|
||
| Utilities | 3 | $41B |
|
||
| Healthcare | 2 | $330B |
|
||
Cash-flow waterfall
monthlySold comps — $/sqft
last 12 mo · ≤1 miLoading sold comps…