 🏗️ New Construction
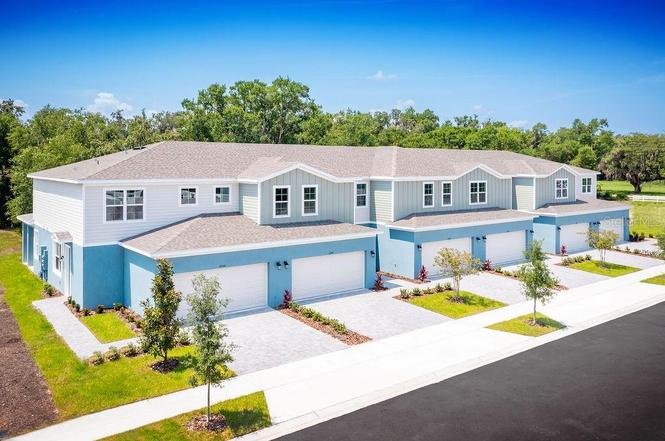
5205 Luisa Ct · St. Cloud, FL
Flood risk 1/10 · Minimal
- FEMA flood zone
- X (unshaded)
- Chance of flooding over 30 yrs
- 0.0%
- Est. flood insurance / yr
- $507 – $1,088
Fire risk 5/10 · Moderate
- Est. fire insurance / yr
- $947 – $1,759
Heat risk 9/10 · Severe
- Hot days now (above 108°F)
- 7 days/yr
- Hot days in 30 yrs
- 23 days/yr
Wind risk 9/10 · Severe
- Chance of severe wind over 30 yrs
- 99.0%
Air-quality risk 2/10 · Minimal
- Unhealthy air days now
- 1 days/yr
- Unhealthy air days in 30 yrs
- 1 days/yr
Risk factors via First Street. Map © Google.
Why this score? — see what drove the F grade
The composite is a weighted blend of 9 inputs, each scored 0–100. Each bar is that input's sub-score; the figure is the points it added to the 100-point composite (weight × sub-score).
- ARV discount +7.5/15.0
- Cash flow +6.4/30.0
- Schools +3.6/10.0
- Rent growth +3.3/5.0
- Livability +2.5/5.0
- Condition / age +2.5/5.0
- 1% rule +2.1/10.0
- DSCR +0.7/10.0
- Appreciation +0.0/10.0
$389,999
🖨 Deal sheet (PDF) 📄 Offer letter ✓ Due diligence
Listing remarks
Under Construction. Estimated Completion: June 2026! Beautiful end-unit townhome featuring designer-selected finishes and 2,010 sq ft of spacious living! This Elm floor plan offers 4 bedrooms, 3.5 baths, a 2-car garage, covered lanai, and versatile upstairs loft. Professionally curated interior includes luxury vinyl plank flooring, quartz countertops, 42” cabinets, stainless-steel appliances, and soaring 9’4” ceilings on the main level. The first-floor primary suite features a large walk-in closet, dual sinks, linen closet, and walk-in shower. Upstairs includes a private ensuite bedroom, two additional bedrooms, full bath, loft, and generous laundry room. Premium end-unit
Key facts
- $165 HOA
- 2 garage spots
- Built 2026
Neighborhood map
What this means for you Summary
Snapshot
- This is a 4-bed/3.5-bath land listed at $390k.
Deal economics
- At list price, monthly cash flow is $-681 ($-8k/yr) — negative.
- To cash-flow at today's rent, offer at most $291k (25.3% below list).
- To meet the 1% rule (rent ≥ 1% of price), the offer needs to be $276k (29.3% below list).
- Recommended offer: $276k (29.3% below list) — sets the bar for 1% rule.
Location & tenants
- Location reads: area grade F — affects rentability + tenant quality, not the cash-flow math above.
- Osceola (suburban): math 39% / reading 45% proficiency, ranked #60 of 73 in FL (top 82%) — families likely to look elsewhere, expect single-tenant / working-renter base with shorter leases; 60% free/reduced lunch — lower-income household profile, screen leases tightly.
- Zoned schools: Narcoossee Elementary School (math 55% / reading 65%, grade B-, #680 of 2,144 statewide, top 32%, 1,467 students, 38% FRL); Narcoossee Middle School (math 55% / reading 57%, grade B-, #175 of 571 statewide, top 31%, 1,371 students, 46% FRL); Tohopekaliga (math 20% / reading 41%, grade F, #434 of 667 statewide, top 66%, 2,748 students, 60% FRL).
- Market conditions: Rents rising (+3.0%/yr); 1396 active listings in the ZIP; 40 comparable units currently listed for rent nearby; rentals at typical pace (median 20d on market — plan ~3-4 weeks tenant-placement turnaround); solid renter incomes; 8,813 units permitted in Osceola County in 2024 (3,072 in 5+ unit buildings).
- This rent runs 34% of the median local income ($97k/yr) — at the standard rent-burdened threshold; future hikes will face affordability resistance.
Forward outlook
- Local home prices are declining (-3.0%/yr); year-one equity from $3k of loan paydown is wiped out by about $12k of value loss. Plan a longer hold.
- Osceola County population projected at +73% by 2050 — long-run rental-demand tailwind backs the buy-and-hold thesis.
Negotiation context
- It's been on market 42 days — a 3% lower offer ($378k) is reasonable based on typical stale-listing flexibility.
Risks & watch-outs
- Climate carrying-cost: severe wind risk, 99% chance of damaging wind over 30y; moderate wildfire risk; extreme-heat days projected 7→23/yr by 2055 (HVAC capex compounding) — expect insurance premiums to compound above CPI over the hold.
Questions for the listing agent
- What do current leases actually rent for vs. the listed asking? Can we see a recent rent roll and the last 12 months of T-12 income?
- It's been on market 42 days. Have you received any prior offers? Is the seller open to a 29% concession, seller financing, or rate buy-down credit?
- What does the HOA fee cover, when was the last increase, and are there any pending special assessments or reserve-fund shortfalls?
- Is there a deadline driving the sale (1031 exchange, divorce, estate, relocation)? That informs how much negotiation room exists.
- The area grade is low — what's the realistic commute time and amenity access for the typical tenant pool here? Any planned neighborhood developments (good or bad) we should know about?
- What's the average days-on-market for RENTAL listings here right now (not sales)? A rising rental-DOM trend means longer vacancies and softer asking-rent achievability than the comps imply.
- What's the recent tenant-quality profile in this submarket — average credit score on applications, eviction rate, late-payment / NSF rate, and stable-employment percentage? A property-management company in the area should have these aggregated.
- How much new for-sale + rental construction is in the pipeline within 1–3 miles? Heavy new supply typically softens prices + rents 12–24 months out; constrained supply supports both.
Investment metrics
- 1% rule
- 0.71% ✗
- Cap rate
- 4.20%
- Cash-on-cash
- -7.48%
- DSCR
- 0.67
- GRM
- 11.8
CMA / ARV
No comps found within radius.
Projected returns pro-forma
-3.0% appreciation · 3.02% rent growth · sell at horizon
- IRR
- -29.3%
- Equity multiple
- 0.03×
- Total profit
- $-106,368
- Equity at exit
- $58,150
- IRR
- -29.4%
- Equity multiple
- -0.35×
- Total profit
- $-147,660
- Equity at exit
- $33,720
Cash invested: $109,200 (down + closing). Projections, not guarantees.
Landlord ↔ Tenant lean methodology
- Overall (STATE)
- 87 Strongly Landlord-Friendly
- State Florida
- 87 Strongly Landlord-Friendly · R+3
- County
- — inherits STATE
- City
- — inherits STATE
ZIP-level market 34771
- Home prices YoY
- -30.0%
- Rents YoY
- 3.0%
- Active inventory
- 1396
- Price-to-rent
- 11.8×
Monthly cashflow live
- Estimated rent
- $2,759 high interval (Pro) →
- Mortgage (P&I)
- −$2,045
- Tax est. 1.5%
- −$487 /mo · $5,850/yr
- Insurance
- −$162
- HOA
- −$165
- Vacancy / Maint / Mgmt
- −$579
- Net cashflow
- $-681
Break-even live
Sensitivity live
| Price | -10% $-411 | -5% $-546 | +0% $-681 | +5% $-816 | +10% $-950 |
|---|---|---|---|---|---|
| Rent | -10% $-899 | -5% $-790 | +0% $-681 | +5% $-572 | +10% $-463 |
| Rate | -1.0pp $-485 | -0.5pp $-582 | base $-681 | +0.5pp $-782 | +1.0pp $-885 |
UW: 25.0% down · 7.5% · 30yr · 1.5% tax · 5.0% vac · 8.0% maint · 8.0% mgmt
Financing live
Cash to close
- Down payment
- $97,500
- Closing costs
- $11,700
- Reserves months
- —
- Total cash needed
- —
Loan-product check · same deal, 3 products live
Conventional
25% down · 7.5% · 30yr
- Down + closing
- —
- Monthly P&I
- —
- Monthly cashflow
- —
- DSCR
- —
- Eligible?
- —
Personal DTI + credit; lowest rate.
DSCR
20% down · 8.5% · 30yr
- Down + closing
- —
- Monthly P&I
- —
- Monthly cashflow
- —
- DSCR
- —
- Eligible?
- —
No personal income docs; deal must DSCR.
Hard money
10% down · 12.0% · 12mo
- Down + closing
- —
- Monthly P&I
- —
- Monthly cashflow
- —
- DSCR
- —
- Eligible?
- —
Short-term bridge; refi at stabilization.
Rent comps 40 comps
| Address | Beds | Baths | Sqft | Rent | $/sqft | DOM | Units | Dist |
|---|---|---|---|---|---|---|---|---|
| 5261 Luisa Ct Saint Cloud, FL | 4.0 | 2.5 | 1860 | $2,350 | $1.26 | 25d | 1 | 0.08mi |
| 5273 Luisa Ct Saint Cloud, FL | 4.0 | 2.5 | 1860 | $2,375 | $1.28 | 14d | 1 | 0.10mi |
| 1200 Wycliffe Way Saint Cloud, FL | 3.0 | 2.5 | 1524 | $2,490 | $1.63 | 0d | 1 | 0.35mi |
| 1260 Stockwell Ave Saint Cloud, FL | 4.0 | 3.0 | 1786 | $2,390 | $1.34 | 25d | 1 | 0.38mi |
| 1305 Stockwell Ave Saint Cloud, FL | 3.0 | 2.5 | 1704 | $2,169 | $1.27 | 6d | 1 | 0.41mi |
| 5327 Timberland Ave Saint Cloud, FL | 4.0 | 2.0 | 1828 | $2,550 | $1.39 | 25d | 1 | 0.42mi |
| 5358 Douglas Fir Dr Saint Cloud, FL | 5.0 | 3.0 | 2626 | $2,750 | $1.05 | 25d | 1 | 0.46mi |
| 5268 Sanders Oak Trl Saint Cloud, FL | 4.0 | 3.0 | 2634 | $2,695 | $1.02 | 6d | 1 | 0.55mi |
| 5251 Meredrew Ln Saint Cloud, FL | 4.0 | 3.0 | 2634 | $2,500 | $0.95 | 6d | 1 | 0.56mi |
| 5265 Luke Hammock St Saint Cloud, FL | 4.0 | 2.5 | 2168 | $2,635 | $1.22 | 0d | 1 | 0.62mi |
| 1610 Spray Ter Saint Cloud, FL | 3.0 | 2.0 | 1672 | $2,599 | $1.55 | 16d | 1 | 0.65mi |
| 94 Polermo Ave Saint Cloud, FL | 3.0 | 2.0 | 1990 | $2,450 | $1.23 | 9d | 1 | 0.72mi |
| 504 Enaya St Saint Cloud, FL | 4.0 | 2.0 | 1825 | $3,100 | $1.70 | 25d | 1 | 0.74mi |
| 1711 Setter Ave Saint Cloud, FL | 5.0 | 3.0 | 2626 | $2,800 | $1.07 | 25d | 1 | 0.76mi |
| 18 Polermo Ave Saint Cloud, FL | 3.0 | 2.5 | 1982 | $2,400 | $1.21 | 23d | 1 | 0.77mi |
| 1560 Scarbrough Abby Pl Saint Cloud, FL | 4.0 | 2.0 | 2004 | $2,475 | $1.24 | 22d | 1 | 0.77mi |
| 510 Whistling Duck Trl Saint Cloud, FL | 4.0 | 3.0 | 2368 | $2,425 | $1.02 | 0d | 1 | 0.82mi |
| 5580 Vigo Loop Saint Cloud, FL | 4.0 | 2.0 | 2021 | $2,849 | $1.41 | 16d | 1 | 0.87mi |
| 4843 Calasans Ave Saint Cloud, FL | 4.0 | 3.0 | 2022 | $2,600 | $1.29 | 9d | 1 | 0.91mi |
| 234 Polermo Ave Saint Cloud, FL | 4.0 | 2.0 | 1825 | $2,490 | $1.36 | 25d | 1 | 0.95mi |
| 1817 Stillwood Way Saint Cloud, FL | 5.0 | 2.5 | 2518 | $3,089 | $1.23 | 25d | 1 | 0.95mi |
| 100 Lavenna Ave Saint Cloud, FL | 4.0 | 2.5 | 2800 | $3,550 | $1.27 | 0d | 1 | 1.03mi |
| 5614 Stockade Blvd Saint Cloud, FL | 3.0 | 2.5 | 1760 | $2,395 | $1.36 | 19d | 1 | 1.04mi |
| 600 Talisi Loop Saint Cloud, FL | 3.0 | 2.0 | 1676 | $2,450 | $1.46 | 6d | 1 | 1.10mi |
| 5566 Sabal Dr Saint Cloud, FL | 4.0 | 3.0 | 2105 | $2,700 | $1.28 | 16d | 1 | 1.14mi |
| 5566 Sabal Dr Saint Cloud, FL | 4.0 | 3.0 | 2126 | $2,699 | $1.27 | 9d | 1 | 1.14mi |
| 994 Teal Creek Dr Saint Cloud, FL | 4.0 | 2.5 | 1790 | $2,799 | $1.56 | 25d | 1 | 1.16mi |
| 416 Preston Cove Dr Saint Cloud, FL | 3.0 | 2.5 | 2614 | $2,150 | $0.82 | 19d | 1 | 1.16mi |
| 1029 Ladyfish Trl Saint Cloud, FL | 4.0 | 2.5 | 2197 | $3,100 | $1.41 | 15d | 1 | 1.21mi |
| 399 Tanis Ave Saint Cloud, FL | 4.0 | 2.0 | 1846 | $2,375 | $1.29 | 25d | 1 | 1.21mi |
| 5172 Goldfinch Dr Saint Cloud, FL | 3.0 | 2.5 | 1992 | $2,600 | $1.31 | 19d | 1 | 1.25mi |
| 564 Preston Cove Dr Saint Cloud, FL | 3.0 | 2.5 | 1551 | $2,080 | $1.34 | 25d | 1 | 1.26mi |
| 588 Preston Cove Dr Saint Cloud, FL | 3.0 | 2.5 | 1553 | $2,250 | $1.45 | 4d | 1 | 1.28mi |
| 764 Preston Cove Dr Unit 1 St Cloud, FL | 3.0 | 2.5 | 1463 | $2,100 | $1.44 | 25d | 1 | 1.28mi |
| 1217 Grassland Ave Saint Cloud, FL | 4.0 | 3.0 | 2185 | $2,900 | $1.33 | 25d | 1 | 1.30mi |
| 5686 Stockade Blvd Saint Cloud, FL | 3.0 | 2.5 | 1496 | $2,150 | $1.44 | 9d | 1 | 1.31mi |
| 5274 Kildare Pl Saint Cloud, FL | 4.0 | 2.5 | 1790 | $2,700 | $1.51 | 25d | 1 | 1.39mi |
| 5752 Anders Way Saint Cloud, FL | 3.0 | 2.5 | 1700 | $2,500 | $1.47 | 25d | 1 | 1.41mi |
| 419 Conway Ave Saint Cloud, FL | 4.0 | 2.0 | 1910 | $2,750 | $1.44 | 9d | 1 | 1.42mi |
| 1166 Silo Dr Saint Cloud, FL | 3.0 | 3.0 | 1856 | $2,499 | $1.35 | 18d | 1 | 1.43mi |
HOA detail
- Monthly dues
- $165 · $1,980/yr
Listing history 6 events
-
2026-04-07status Pending
-
2026-03-25price $389,999
-
2026-03-03price $395,999
-
2026-02-24$394,999 Active
-
2025-07-15soldstatus $1,096,000
-
2024-04-16soldstatus $2,240,000
ⓘ Source: listings_history table (triggers on properties + properties_extension) + one-shot
backfill from property_details.listing_events for pre-trigger history.
Climate risk First Street
- Flood 1/10 Low FEMA zone X (unshaded) · 0% chance over 30 yrs
- Wildfire 5/10 Major
- Heat 9/10 Extreme 7 d/yr ≥108°F today · 23 d/yr by 30 yrs out
- Wind 9/10 Extreme 99% chance of damaging wind over 30 yrs
- Air quality 2/10 Low 1 unhealthy d/yr today · 1 by 30 yrs out
Nearby sold comps map
Loading sold comps map…
Walkable amenities ~0.75 mi
Loading nearby amenities…
Taxation est. · year 1
- Rental income
- $33,102
- − Mortgage interest
- −$21,846
- − Property taxes
- −$5,850
- − Insurance
- −$1,950
- − Repairs & maintenance
- −$2,648
- − Management
- −$2,648
- − HOA
- −$1,980
- − Depreciation
- −$11,345
- Taxable loss
- −$15,165
- Est. tax savings @ 24.0%
- +$3,640
- After-tax cash flow
- $-4,532/yr
For passive investors: Depreciation is non-cash, so a rental often shows a tax loss while cash-flowing — sheltering income. Rental losses are passive: they offset passive income freely, and up to $25,000/yr can offset ordinary (W-2) income if you actively participate and your MAGI is under $100k (phasing out to $0 by $150k); unused losses carry forward. On sale, claimed depreciation is recaptured at up to 25%, and gains may owe capital-gains tax (a 1031 exchange can defer both). Figures are a year-1 estimate at your 24.0% rate — not tax advice; consult a CPA.
Schools (NCES district)
- District
- Osceola
- NCES district ID
- 1201470
- Math proficiency
- 39% ▼ -9.00%
- Reading proficiency
- 45% ▼ -4.00%
- Median HH income
- $45,528
- Composite
- 35.7/100
- National rank
- #4865
- State rank
- #60 of 73 in FL
Livability — St. Cloud
No livability data for this city. (Only ~50 U.S. cities are tracked.)
Census & demographics
- County
- Osceola County · 410,217 people
- City population
- 29,247
- Metro
- Orlando-Kissimmee-Sanford, FL
- Population (ZIP)
- 35,257
- Household income
- $97,415
- Rent vs Own
- Severe rent burden
- 338.0
Population outlook (Osceola County) Hauer SSP2
- Today (2025)
- 447,624 people
- By 2030
- 511,823 · +14.3%
- By 2040
- 642,986 · +43.6%
- By 2050
- 774,552 · +73.0%
- By 2075
- 1,078,144 · +140.9%
- By 2100
- 1,269,660 · +183.6%
Race, ethnicity, and origin ACS 2023
- Neighborhood character
- Diverse neighborhood (Simpson 0.62)
- Race & ethnicity
- White 45% Hispanic / Latino 41% Two or more races 20% Black 9% Asian 2%
- Hispanic origin (detail)
- Mexican 3% Puerto Rican 26% Cuban 2% Dominican 4%
- Common ancestry
- Slovak 2% Romanian 2% Lithuanian 1%
- Foreign-born
- 14% · Canada, Jamaica
- Languages at home
- 64% English-only · Spanish 33% Other Indo-European 3%
Political lean MEDSL · Osceola
- 2024 margin
- Toss-up / Even · D 48.7% · R 50.2% · Other 1.1%
- 2008→2024 swing
- -21.2pp toward R · 2008: 19.7pp · 2024: -1.4pp
- All cycles
- 2024: R+1.4 2020: D+13.8 2016: D+25.0 2012: D+24.5 2008: D+19.7
Not yet ingested
- Civics
- —
Market trends
- HPI YoY
- ▼ -124.44%
- Current HPI
- 290.3095
- Rent YoY
- ▲ 3.02%
- Metro
- Orlando-Kissimmee-Sanford, FL
- State GDP YoY
- ▲ 3.28%
- F500 in state
- 36
Industry mix (Fortune 500 HQ in FL)
| Industry | F500 HQs | Revenue |
|---|---|---|
| Industrial Technology | 2 | $29B |
|
||
| Insurance | 2 | $17B |
|
||
| Retail | 1 | $60B |
|
||
| Technology Distribution | 1 | $58B |
|
||
| Homebuilding | 1 | $35B |
|
||
| Technology Manufacturing | 1 | $35B |
|
||
Price history
-82.6% since first listed6 events — show timeline
- 2026-04-07 Pending — Stellar MLS as Distributed by MLS Grid
- 2026-03-25 Price Changed $389,999 Stellar MLS as Distributed by MLS Grid
- 2026-03-03 Price Changed $395,999 Stellar MLS as Distributed by MLS Grid
- 2026-02-24 Listed $394,999 Stellar MLS as Distributed by MLS Grid
- 2025-07-15 Sold (Public Records) $1,096,000 Public Records
- 2024-04-16 Sold (Public Records) $2,240,000 Public Records
Property tax history
+40.9%/yrLatest (2025): $554 · +100.7% YoY. Source: county tax records.
Cash-flow waterfall
monthlySold comps — $/sqft
last 12 mo · ≤1 miLoading sold comps…