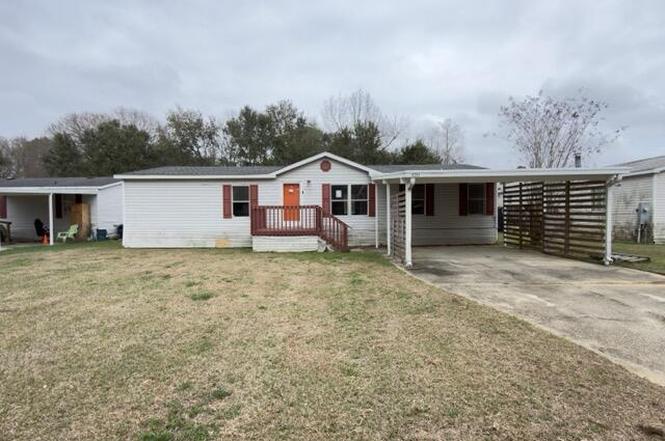
6253 Footprint Dr Unit N/A · Bellview, FL
Flood risk 1/10 · Minimal
- FEMA flood zone
- X (unshaded)
- Chance of flooding over 30 yrs
- 0.0%
- Est. flood insurance / yr
- $507 – $1,088
Fire risk 2/10 · Minimal
- Est. fire insurance / yr
- $947 – $1,759
Heat risk 10/10 · Severe
- Hot days now (above 105°F)
- 7 days/yr
- Hot days in 30 yrs
- 23 days/yr
Wind risk 9/10 · Severe
- Chance of severe wind over 30 yrs
- 99.0%
Air-quality risk 1/10 · Minimal
- Unhealthy air days now
- 0 days/yr
- Unhealthy air days in 30 yrs
- 0 days/yr
Risk factors via First Street. Map © Google.
Why this score? — see what drove the C+ grade
The composite is a weighted blend of 9 inputs, each scored 0–100. Each bar is that input's sub-score; the figure is the points it added to the 100-point composite (weight × sub-score).
- Cash flow +30.0/30.0
- 1% rule +10.0/10.0
- DSCR +10.0/10.0
- Rent growth +3.6/5.0
- Schools +3.6/10.0
- Livability +3.4/5.0
- Condition / age +2.5/5.0
- ARV discount +0.5/15.0
- Appreciation +0.0/10.0
$111,000
🖨 Deal sheet (PDF) 📄 Offer letter ✓ Due diligence
Listing remarks
This HUD REO is eligible for the HUD FHA $100 Down program! Located just a few miles from schools, shopping, and NAS, this 2002 Mobile home is ready for owners with some vision. This 1352 square foot home has split bedroom design with 3 bedrooms and 2 baths. The living room, dining area and kitchen have vaulted ceilings, giving the main living area a increased 'roomy' feeling! Just off the living room is the master bedroom. Master bath has garden tub, separate shower and an additional walk in closet. Just off the kitchen on the opposite side of the home: remaining 2 bedrooms, full bath, laundry area and a large walk in pantry. For owner occupants and investors alike, this property has tons
Key facts
- 0.26 acre lot
- 2 parking spots
- Built 2002
Neighborhood map
What this means for you Summary
Snapshot
- This is a 3-bed/2.0-bath manufactured listed at $111k.
Deal economics
- At list price, monthly cash flow is $774 ($9k/yr) — positive.
- The deal already cash-flows at list — no discount required.
- Meets the 1% rule at list price ($2k rent vs $111k).
- Recommended offer: $108k (3.0% below list) — sets the bar for market timing.
- Cap rate 14.7% vs local median 5.2% in Bellview — top-decile yield for the area; either an underpriced asset or a hidden risk that comps aren't pricing in. Stress-test before assuming the spread holds.
Location & tenants
- Location reads 67/100 on livability (#561 in FL) — a middle-class / working-renter tenant base. Strengths: cost of living A+, housing A+; Watch: amenities F, commute F, health & safety F.
- Escambia (suburban): math 40% / reading 45% proficiency, ranked #56 of 73 in FL (top 77%) — families likely to look elsewhere, expect single-tenant / working-renter base with shorter leases.
- Zoned schools: Bellview Elementary School (math 28% / reading 34%, grade F, #1,854 of 2,144 statewide, top 87%, 545 students, 75% FRL); Pine Forest High School (math 20% / reading 32%, grade F, #494 of 667 statewide, top 75%, 1,870 students, 62% FRL).
- Zoned-school proficiency averages 28% at this address vs 42% district-wide (-14 pts) — the specific schools serving this property underperform the Escambia average; the district grade overstates school quality for this exact location.
- Market conditions: Rents rising fast (+4.4%/yr); 417 active listings in the ZIP; 15 comparable units currently listed for rent nearby; rentals at typical pace (median 24d on market — plan ~3-4 weeks tenant-placement turnaround); solid renter incomes; 1,479 units permitted in Escambia County in 2024 (0 in 5+ unit buildings).
- This rent runs 31% of the median local income ($75k/yr) — at the standard rent-burdened threshold; future hikes will face affordability resistance.
Forward outlook
- Local home prices are declining (-3.0%/yr); year-one equity from $767 of loan paydown is wiped out by about $3k of value loss. Plan a longer hold.
- Escambia County population projected at +13% by 2050 — modest demand growth; plan on rents tracking national, not racing it.
- At projected returns (-3.0% appreciation + 4.4% rent growth), your $31k cash investment doubles in ~4 years — after that, you're playing with house money.
Negotiation context
- It's been on market 58 days — a 3% lower offer ($108k) is reasonable based on typical stale-listing flexibility.
Risks & watch-outs
- Climate carrying-cost: severe wind risk, 99% chance of damaging wind over 30y; extreme-heat days projected 7→23/yr by 2055 (HVAC capex compounding) — expect insurance premiums to compound above CPI over the hold.
Questions for the listing agent
- It's been on market 58 days. Have you received any prior offers? Is the seller open to a 3% concession, seller financing, or rate buy-down credit?
- Is there a deadline driving the sale (1031 exchange, divorce, estate, relocation)? That informs how much negotiation room exists.
- Schools are D-rated, which usually means shorter tenancies and higher turnover. Who's the typical renter profile here, and what's been the actual vacancy rate?
- What's the average days-on-market for RENTAL listings here right now (not sales)? A rising rental-DOM trend means longer vacancies and softer asking-rent achievability than the comps imply.
- What's the recent tenant-quality profile in this submarket — average credit score on applications, eviction rate, late-payment / NSF rate, and stable-employment percentage? A property-management company in the area should have these aggregated.
- How much new for-sale + rental construction is in the pipeline within 1–3 miles? Heavy new supply typically softens prices + rents 12–24 months out; constrained supply supports both.
Investment metrics
- 1% rule
- 1.76% ✓
- Cap rate
- 14.66%
- Cash-on-cash
- 29.87%
- DSCR
- 2.33
- GRM
- 4.7
CMA / ARV
- ARV (on-the-fly)
- $95,992
- Comps found
- 4
Show comp detail 4 sales within ~0.75 mi
| Address | Dist | Beds/Ba | Sqft | Sold | Price | $/sf | Match |
|---|---|---|---|---|---|---|---|
| 6253 Footprint Dr Unit N/A | 0.00mi | 3/2.0 | 1,352 (0%) | 1mo | $96,000 | $71 | 99 |
| 6290 Footprint Dr | 0.08mi | 3/2.0 | 1,404 (+4%) | 3mo | $90,000 | $64 | 87 |
| 6368 Footprint Dr | 0.16mi | 3/2.0 | 1,404 (+4%) | 8mo | $80,000 | $57 | 80 |
| 6392 Footprint Dr | 0.21mi | 4/2.0 (+1) | 1,431 (+6%) | 22mo | $122,000 | $85 | 57 |
Match score weights: distance 35% · size 25% · config 20% · recency 20%. Top-matched comps best support the ARV.
Projected returns pro-forma
-3.0% appreciation · 4.42% rent growth · sell at horizon
- IRR
- 26.0%
- Equity multiple
- 2.10×
- Total profit
- $34,136
- Equity at exit
- $16,550
- IRR
- 34.6%
- Equity multiple
- 4.39×
- Total profit
- $105,221
- Equity at exit
- $9,597
Cash invested: $31,080 (down + closing). Projections, not guarantees.
Landlord ↔ Tenant lean methodology
- Overall (STATE)
- 87 Strongly Landlord-Friendly
- State Florida
- 87 Strongly Landlord-Friendly · R+3
- County
- — inherits STATE
- City
- — inherits STATE
ZIP-level market 32526
- Home prices YoY
- -28.3%
- Rents YoY
- 4.4%
- Active inventory
- 417
- Price-to-rent
- 4.7×
Monthly cashflow live
- Estimated rent
- $1,950 high interval (Pro) →
- Mortgage (P&I)
- −$582
- Tax est. 1.5%
- −$139 /mo · $1,665/yr
- Insurance
- −$46
- HOA
- −$0
- Vacancy / Maint / Mgmt
- −$410
- Net cashflow
- $774
Break-even live
Sensitivity live
| Price | -10% $850 | -5% $812 | +0% $774 | +5% $735 | +10% $697 |
|---|---|---|---|---|---|
| Rent | -10% $619 | -5% $697 | +0% $774 | +5% $851 | +10% $928 |
| Rate | -1.0pp $829 | -0.5pp $802 | base $774 | +0.5pp $745 | +1.0pp $716 |
UW: 25.0% down · 7.5% · 30yr · 1.5% tax · 5.0% vac · 8.0% maint · 8.0% mgmt
Financing live
Cash to close
- Down payment
- $27,750
- Closing costs
- $3,330
- Reserves months
- —
- Total cash needed
- —
Loan-product check · same deal, 3 products live
Conventional
25% down · 7.5% · 30yr
- Down + closing
- —
- Monthly P&I
- —
- Monthly cashflow
- —
- DSCR
- —
- Eligible?
- —
Personal DTI + credit; lowest rate.
DSCR
20% down · 8.5% · 30yr
- Down + closing
- —
- Monthly P&I
- —
- Monthly cashflow
- —
- DSCR
- —
- Eligible?
- —
No personal income docs; deal must DSCR.
Hard money
10% down · 12.0% · 12mo
- Down + closing
- —
- Monthly P&I
- —
- Monthly cashflow
- —
- DSCR
- —
- Eligible?
- —
Short-term bridge; refi at stabilization.
Rent comps 15 comps
| Address | Beds | Baths | Sqft | Rent | $/sqft | DOM | Units | Dist |
|---|---|---|---|---|---|---|---|---|
| 5519 Lexlee Blvd Pensacola, FL | 3.0 | 2.5 | 1543 | $1,850 | $1.20 | 24d | 1 | 0.12mi |
| 5172 Zachary Blvd Pensacola, FL | 3.0 | 2.0 | 1803 | $1,900 | $1.05 | 24d | 1 | 0.53mi |
| 5184 Regalo Dr Pensacola, FL | 3.0 | 2.0 | 1504 | $1,900 | $1.26 | 24d | 1 | 0.54mi |
| 5217 Saufley Field Rd Pensacola, FL | 4.0 | 2.5 | 1817 | $1,895 | $1.04 | 24d | 1 | 0.54mi |
| 3001 Flintlock Dr Pensacola, FL | 3.0 | 2.0 | 1750 | $1,895 | $1.08 | 14d | 1 | 0.79mi |
| 5404 N Blue Angel Pkwy Pensacola, FL | 3.0 | 1.0 | 1120 | $1,275 | $1.14 | 24d | 1 | 0.80mi |
| 5604 Scotland Ter Pensacola, FL | 3.0 | 2.0 | 1231 | $1,600 | $1.30 | 14d | 1 | 1.09mi |
| 3115 Flintlock Dr Pensacola, FL | 3.0 | 2.0 | 1200 | $1,700 | $1.42 | 24d | 1 | 1.20mi |
| 6081 Royal Port Ct Pensacola, FL | 3.0 | 2.5 | 1428 | $1,850 | $1.30 | 24d | 1 | 1.24mi |
| 6077 Royal Port Ct Pensacola, FL | 3.0 | 2.5 | 1542 | $1,775 | $1.15 | 24d | 1 | 1.25mi |
| 4930 Laceiba Dr Pensacola, FL | 3.0 | 1.5 | 1020 | $1,300 | $1.27 | 21d | 1 | 1.25mi |
| 6225 Mobile Hwy Pensacola, FL | 1.0–3.0 | 1.0–2.0 | 1036 | $2,595 | $2.50 | 14d | 15 | 1.31mi |
| 5049 Quarter Deck St Pensacola, FL | 4.0 | 2.0 | 1820 | $2,300 | $1.26 | 14d | 1 | 1.33mi |
| 5031 Firstmate Way Pensacola, FL | 3.0 | 2.0 | 1425 | $2,100 | $1.47 | 24d | 1 | 1.38mi |
| 6379 Mers Ln Pensacola, FL | 3.0 | 2.5 | 1811 | $1,900 | $1.05 | 21d | 1 | 1.44mi |
Listing history 3 events
-
2026-04-23status Pending
-
2026-03-27price $111,000
-
2026-02-24$130,000 Active
ⓘ Source: listings_history table (triggers on properties + properties_extension) + one-shot
backfill from property_details.listing_events for pre-trigger history.
Climate risk First Street
- Flood 1/10 Low FEMA zone X (unshaded) · 0% chance over 30 yrs
- Wildfire 2/10 Low
- Heat 10/10 Extreme 7 d/yr ≥105°F today · 23 d/yr by 30 yrs out
- Wind 9/10 Extreme 99% chance of damaging wind over 30 yrs
- Air quality 1/10 Low 0 unhealthy d/yr today · 0 by 30 yrs out
Nearby sold comps map
Loading sold comps map…
Walkable amenities ~0.75 mi
Loading nearby amenities…
Taxation est. · year 1
- Rental income
- $23,402
- − Mortgage interest
- −$6,218
- − Property taxes
- −$1,665
- − Insurance
- −$555
- − Repairs & maintenance
- −$1,872
- − Management
- −$1,872
- − Depreciation
- −$3,229
- Taxable income
- $7,991
- Est. tax owed @ 24.0%
- −$1,918
- After-tax cash flow
- $7,365/yr
For passive investors: Depreciation is non-cash, so a rental often shows a tax loss while cash-flowing — sheltering income. Rental losses are passive: they offset passive income freely, and up to $25,000/yr can offset ordinary (W-2) income if you actively participate and your MAGI is under $100k (phasing out to $0 by $150k); unused losses carry forward. On sale, claimed depreciation is recaptured at up to 25%, and gains may owe capital-gains tax (a 1031 exchange can defer both). Figures are a year-1 estimate at your 24.0% rate — not tax advice; consult a CPA.
Schools (NCES district)
- District
- Escambia
- NCES district ID
- 1200510
- Math proficiency
- 40% ▼ -9.00%
- Reading proficiency
- 45% ▼ -4.00%
- Median HH income
- $44,649
- Composite
- 36.04/100
- National rank
- #4773
- State rank
- #56 of 73 in FL
Livability — Bellview
- Score
- 67/100
- State rank
- #561
- US rank
- #10731
Category grades
Schools grade is shown separately in the Schools card above.
Census & demographics
- Census place
- Bellview, FL
- County
- Escambia County · 301,722 people
- Metro
- Pensacola-Ferry Pass-Brent, FL
- Population (ZIP)
- 44,680
- Household income
- $75,098
- Rent vs Own
- Severe rent burden
- 1166.0
Population outlook (Escambia County) Hauer SSP2
- Today (2025)
- 334,637 people
- By 2030
- 345,779 · +3.3%
- By 2040
- 364,828 · +9.0%
- By 2050
- 378,514 · +13.1%
- By 2075
- 403,220 · +20.5%
- By 2100
- 386,125 · +15.4%
Race, ethnicity, and origin ACS 2023
- Neighborhood character
- Predominantly White (66%)
- Race & ethnicity
- White 66% Black 19% Two or more races 8% Hispanic / Latino 5% Asian 3%
- Common ancestry
- Lithuanian 2% Slovak 2% Serbian 2%
- Foreign-born
- 5% · Canada, China
- Languages at home
- 94% English-only · Spanish 2% Tagalog/Filipino 1% Other Indo-European 1%
Political lean MEDSL · Escambia
- 2024 margin
- R (+19.5) · D 39.7% · R 59.2% · Other 1.1%
- 2008→2024 swing
- -0.2pp no change · 2008: -19.3pp · 2024: -19.5pp
- All cycles
- 2024: R+19.5 2020: R+15.1 2016: R+20.6 2012: R+20.6 2008: R+19.3
Not yet ingested
- Civics
- —
Market trends
- HPI YoY
- ▼ -99.68%
- Current HPI
- 252.6406
- Rent YoY
- ▲ 4.42%
- Metro
- Pensacola-Ferry Pass-Brent, FL
- State GDP YoY
- ▲ 3.28%
- F500 in state
- 36
Industry mix (Fortune 500 HQ in FL)
| Industry | F500 HQs | Revenue |
|---|---|---|
| Industrial Technology | 2 | $29B |
|
||
| Insurance | 2 | $17B |
|
||
| Retail | 1 | $60B |
|
||
| Technology Distribution | 1 | $58B |
|
||
| Homebuilding | 1 | $35B |
|
||
| Technology Manufacturing | 1 | $35B |
|
||
Price history
-14.6% since first listed3 events — show timeline
- 2026-04-23 Pending — ECAR
- 2026-03-27 Price Changed $111,000 ECAR
- 2026-02-24 Listed $130,000 ECAR
Cash-flow waterfall
monthlySold comps — $/sqft
last 12 mo · ≤1 miLoading sold comps…