 Triplex
2067 32nd St · New York, NY
Flood risk 1/10 · Minimal
- FEMA flood zone
- X (unshaded)
- Chance of flooding over 30 yrs
- 0.0%
- Est. flood insurance / yr
- $507 – $1,088
Fire risk 1/10 · Minimal
- Est. fire insurance / yr
- $691 – $1,283
Heat risk 6/10 · Moderate
- Hot days now (above 99°F)
- 7 days/yr
- Hot days in 30 yrs
- 15 days/yr
Wind risk 6/10 · Moderate
- Chance of severe wind over 30 yrs
- 27.0%
Air-quality risk 4/10 · Minor
- Unhealthy air days now
- 5 days/yr
- Unhealthy air days in 30 yrs
- 6 days/yr
Risk factors via First Street. Map © Google.
Why this score? — see what drove the C- grade
The composite is a weighted blend of 9 inputs, each scored 0–100. Each bar is that input's sub-score; the figure is the points it added to the 100-point composite (weight × sub-score).
- Cash flow +17.9/30.0
- ARV discount +7.5/15.0
- DSCR +5.6/10.0
- Schools +5.0/10.0
- Rent growth +4.2/5.0
- 1% rule +3.9/10.0
- Livability +3.8/5.0
- Condition / age +2.5/5.0
- Appreciation +0.0/10.0
$1,449,000
🖨 Deal sheet (PDF) 📄 Offer letter ✓ Due diligence
Multi-family units
County records classify this as Multi-Family (2-4 Unit). Listing-text estimate: 3 units. confirmed
Listing remarks
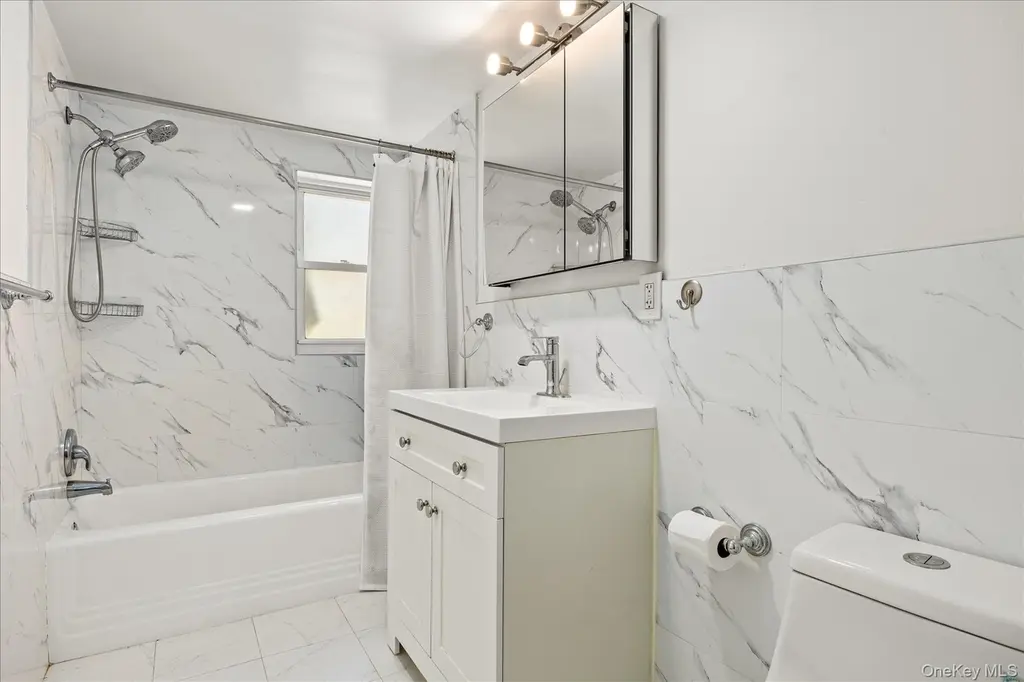
Versatile 3-Family Home in the Heart of Astoria Excellent opportunity to own a well-maintained three-family home in one of Astoria’s most sought-after locations. Situated at 2067 32nd Street, this three-story property is an ideal choice for an owner-occupant looking for rental income or an investor seeking a turnkey property in a high-demand area. Interior Layout: First Floor (Fully Renovated): This floor has been completely updated and features a brand-new kitchen, a full bathroom, a comfortable living room, and two bedrooms, one of which provides direct access to the backyard. " Second Floor: A functional 1-bedroom apartment consisting of a living room, kitchen, and full bathr
Key facts
- New boiler
- New hot water heater
- 1,260 sq ft lot
Tags
Property features AI
Exterior
- Parking: On-street parking
- Utilities: Public sewer; Electricity connected; Sewer connected
- Home design: Duplex
- Construction: Brick construction; Property condition listed as actual
- Exterior features: Brick exterior; Back yard fencing; Not waterfront
Interior
- Bedrooms: One 1-bedroom unit; Two 2-bedroom units
- Bathrooms: 4 full bathrooms
- Heating & cooling: Natural gas heating; No central cooling
- Interior features: First-floor bedroom; Finished full basement with walk-out access
Neighborhood map
What this means for you Summary
Snapshot
- This is a 3 × 5-bed/4.0-bath units multifamily listed at $1.45M.
Deal economics
- At list price, monthly cash flow is $1k ($15k/yr) — positive. Per door: $409/mo.
- The deal already cash-flows at list — no discount required.
- To meet the 1% rule (rent ≥ 1% of price), the offer needs to be $1.29M (10.8% below list).
- Recommended offer: $1.29M (10.8% below list) — sets the bar for 1% rule.
- Cap rate 7.3% vs local median 2.6% in New York — top-decile yield for the area; either an underpriced asset or a hidden risk that comps aren't pricing in. Stress-test before assuming the spread holds.
Location & tenants
- Location reads 75/100 on livability (#268 in NY, #4,188 nationally) — a middle-class / working-renter tenant base. Strengths: amenities A+, commute A+, health & safety A; Watch: crime F, cost of living F.
- Market conditions: Rents rising fast (+6.7%/yr); 112 active listings in the ZIP; solid renter incomes; 5,302 units permitted in Queens County in 2024 (4,918 in 5+ unit buildings).
- At $12,918/mo this rent would consume 152% of the median local household income ($102k/yr) (locally 2291% of renters already pay >50% of income on rent) — very limited rent-growth headroom before tenants either downsize or default.
Forward outlook
- Local home prices are declining (-3.0%/yr); year-one equity from $10k of loan paydown is wiped out by about $43k of value loss. Plan a longer hold.
- Queens County population projected at +16% by 2050 — long-run rental-demand tailwind backs the buy-and-hold thesis.
Negotiation context
- It's been on market 41 days — a 3% lower offer ($1.41M) is reasonable based on typical stale-listing flexibility.
Risks & watch-outs
- Watch-outs: built in 1930 — expect roof / HVAC / electrical / plumbing capex.
- Climate carrying-cost: major wind risk, 27% chance of damaging wind over 30y; extreme-heat days projected 7→15/yr by 2055 (HVAC capex compounding) — expect insurance premiums to compound above CPI over the hold.
Questions for the listing agent
- It's been on market 41 days. Have you received any prior offers? Is the seller open to a 11% concession, seller financing, or rate buy-down credit?
- Can we see the unit-by-unit rent roll, current vacancy, and any below-market leases? What's the average tenancy length?
- What capital expenditures (roof, boiler, parking lot, exteriors) have been made in the last 5 years, and what's planned in the next 2?
- Built in 1930 — when were the roof, HVAC, electrical panel, plumbing, and water heater last replaced?
- Is there a deadline driving the sale (1031 exchange, divorce, estate, relocation)? That informs how much negotiation room exists.
- Schools are B-rated — typically a magnet for longer-tenancy family renters. What's the average tenant stay here, and is there a school-zone premium baked into asking?
- Crime grade is F in this area — have there been break-ins, vandalism, or insurance claims at this property in the last 3 years? What carrier currently insures it and at what premium?
- What's the average days-on-market for RENTAL listings here right now (not sales)? A rising rental-DOM trend means longer vacancies and softer asking-rent achievability than the comps imply.
- What's the recent tenant-quality profile in this submarket — average credit score on applications, eviction rate, late-payment / NSF rate, and stable-employment percentage? A property-management company in the area should have these aggregated.
- How much new apartment / multifamily construction is in the pipeline within 1–3 miles? Heavy new supply (>2% of stock underway) typically softens rents 12–24 months out; light construction supports rent growth.
Investment metrics
- 1% rule
- 0.89% ✗
- Cap rate
- 7.31%
- Cash-on-cash
- 3.63%
- DSCR
- 1.16
- GRM
- 9.3
CMA / ARV
No comps found within radius.
Projected returns pro-forma
-3.0% appreciation · 6.66% rent growth · sell at horizon
- IRR
- -6.9%
- Equity multiple
- 0.73×
- Total profit
- $-107,758
- Equity at exit
- $216,051
- IRR
- 6.4%
- Equity multiple
- 1.55×
- Total profit
- $223,250
- Equity at exit
- $125,283
Cash invested: $405,720 (down + closing). Projections, not guarantees.
Landlord ↔ Tenant lean methodology
- Overall (CITY)
- 0 Strongly Tenant-Friendly
- State New York
- 15 Strongly Tenant-Friendly · D+10
- County
- — inherits STATE
- City New York
- 0 Strongly Tenant-Friendly · D+34
ZIP-level market 11105
- Home prices YoY
- -11.2%
- Rents YoY
- 6.7%
- Active inventory
- 112
- Price-to-rent
- 28.0×
Monthly cashflow live
- Estimated rent
- $12,918 medium interval (Pro) →
- Mortgage (P&I)
- −$7,599
- Tax from tax record
- −$775 /mo · $9,306/yr
- Insurance
- −$604
- HOA
- −$0
- Vacancy / Maint / Mgmt
- −$2,713
- Net cashflow
- $1,227
Break-even live
Sensitivity live
| Price | -10% $2,048 | -5% $1,637 | +0% $1,227 | +5% $817 | +10% $407 |
|---|---|---|---|---|---|
| Rent | -10% $207 | -5% $717 | +0% $1,227 | +5% $1,738 | +10% $2,248 |
| Rate | -1.0pp $1,957 | -0.5pp $1,596 | base $1,227 | +0.5pp $852 | +1.0pp $470 |
3-unit breakdown (identical units grouped — click to expand)
| Units | Beds | Baths | Est. rent |
|---|---|---|---|
| 3× units | 5 | 4 | $12,918 |
| #1 | 5 | 4 | $4,306 |
| #2 | 5 | 4 | $4,306 |
| #3 | 5 | 4 | $4,306 |
| Total (3 units) | $12,918 | ||
UW: 25.0% down · 7.5% · 30yr · 1.5% tax · 5.0% vac · 8.0% maint · 8.0% mgmt
Financing live
Cash to close
- Down payment
- $362,250
- Closing costs
- $43,470
- Reserves months
- —
- Total cash needed
- —
Loan-product check · same deal, 3 products live
Conventional
25% down · 7.5% · 30yr
- Down + closing
- —
- Monthly P&I
- —
- Monthly cashflow
- —
- DSCR
- —
- Eligible?
- —
Personal DTI + credit; lowest rate.
DSCR
20% down · 8.5% · 30yr
- Down + closing
- —
- Monthly P&I
- —
- Monthly cashflow
- —
- DSCR
- —
- Eligible?
- —
No personal income docs; deal must DSCR.
Hard money
10% down · 12.0% · 12mo
- Down + closing
- —
- Monthly P&I
- —
- Monthly cashflow
- —
- DSCR
- —
- Eligible?
- —
Short-term bridge; refi at stabilization.
Listing history 13 events
-
2026-06-18days on market $1,449,000 Active 41 DOM
-
2026-06-17days on market $1,449,000 Active 40 DOM
-
2026-06-16days on market $1,449,000 Active 39 DOM
-
2026-06-15days on market $1,449,000 Active 38 DOM
-
2026-06-13days on market $1,449,000 Active 36 DOM
-
2026-06-10days on market $1,449,000 Active 32 DOM
-
2026-06-08days on market $1,449,000 Active 31 DOM
-
2026-06-08days on market $1,449,000 Active 30 DOM
-
2026-06-04days on market $1,449,000 Active 27 DOM
-
2026-06-03days on market $1,449,000 Active 26 DOM
-
2026-06-01days on market $1,449,000 Active 24 DOM
-
2026-05-31days on market $1,449,000 Active 23 DOM
-
2026-05-08$1,449,000 Active
ⓘ Source: listings_history table (triggers on properties + properties_extension) + one-shot
backfill from property_details.listing_events for pre-trigger history.
Tax reassessment forecast NY · Partial reset (capped growth)
- Current annual tax
- $9,306 · $775/mo
- Projected year-2 tax
- $16,897 · $1,408/mo
- Expected delta
- +$7,591/yr (+$633/mo · 81.6%)
ⓘ Screening estimate from a state-policy table — verify with the county assessor before closing.
Climate risk First Street
- Flood 1/10 Low FEMA zone X (unshaded) · 0% chance over 30 yrs
- Wildfire 1/10 Low
- Heat 6/10 Major 7 d/yr ≥99°F today · 15 d/yr by 30 yrs out
- Wind 6/10 Major 27% chance of damaging wind over 30 yrs
- Air quality 4/10 Moderate 5 unhealthy d/yr today · 6 by 30 yrs out
Nearby sold comps map
Loading sold comps map…
Walkable amenities ~0.75 mi
Loading nearby amenities…
Taxation est. · year 1
- Rental income
- $155,016
- − Mortgage interest
- −$81,167
- − Property taxes
- −$9,306
- − Insurance
- −$7,245
- − Repairs & maintenance
- −$12,401
- − Management
- −$12,401
- − Depreciation
- −$42,153
- Taxable loss
- −$9,657
- Est. tax savings @ 24.0%
- +$2,318
- After-tax cash flow
- $17,045/yr
For passive investors: Depreciation is non-cash, so a rental often shows a tax loss while cash-flowing — sheltering income. Rental losses are passive: they offset passive income freely, and up to $25,000/yr can offset ordinary (W-2) income if you actively participate and your MAGI is under $100k (phasing out to $0 by $150k); unused losses carry forward. On sale, claimed depreciation is recaptured at up to 25%, and gains may owe capital-gains tax (a 1031 exchange can defer both). Figures are a year-1 estimate at your 24.0% rate — not tax advice; consult a CPA.
Schools (NCES district)
No district data.
Livability — New York
- Score
- 75/100
- State rank
- #268
- US rank
- #4188
Category grades
Schools grade is shown separately in the Schools card above.
Census & demographics
- Census place
- New York, NY
- County
- Queens County · 1,914,869 people
- City population
- 7,731,280
- Metro
- New York-Newark-Jersey City, NY-NJ-PA
- Population (ZIP)
- 37,936
- Household income
- $102,012
- Rent vs Own
- Severe rent burden
- 2291.0
Population outlook (Queens County) Hauer SSP2
- Today (2025)
- 2,546,320 people
- By 2030
- 2,643,059 · +3.8%
- By 2040
- 2,815,563 · +10.6%
- By 2050
- 2,944,423 · +15.6%
- By 2075
- 3,123,338 · +22.7%
- By 2100
- 3,098,688 · +21.7%
Race, ethnicity, and origin ACS 2023
- Neighborhood character
- Diverse neighborhood (Simpson 0.58)
- Race & ethnicity
- White 60% Hispanic / Latino 22% Two or more races 11% Asian 10% Black 3%
- Hispanic origin (detail)
- Mexican 4% Puerto Rican 5% Dominican 2%
- Common ancestry
- Romanian 3% Italian 1% Scotch-Irish 1%
- Foreign-born
- 32% · Canada, Jamaica, Vietnam
- Languages at home
- 53% English-only · Other Indo-European 17% Spanish 16% Arabic 6%
Political lean MEDSL · Queens
- 2024 margin
- Strong D (+24.6) · D 62.3% · R 37.7%
- 2008→2024 swing
- -26.2pp toward R · 2008: 50.8pp · 2024: 24.6pp
- All cycles
- 2024: D+24.6 2020: D+45.2 2016: D+53.4 2012: D+58.5 2008: D+50.8
Not yet ingested
- Civics
- —
Market trends
- HPI YoY
- ▼ -62.96%
- Current HPI
- 501.1392
- Rent YoY
- ▲ 6.66%
- Metro
- New York-Newark-Jersey City, NY-NJ-PA
- State GDP YoY
- ▲ 2.60%
- F500 in state
- 92
Industry mix (Fortune 500 HQ in NY)
| Industry | F500 HQs | Revenue |
|---|---|---|
| Financial Services | 10 | $950B |
|
||
| Consumer Goods | 9 | $162B |
|
||
| Insurance | 4 | $225B |
|
||
| Telecommunications | 2 | $144B |
|
||
| Pharmaceuticals | 2 | $112B |
|
||
| Media / Entertainment | 2 | $69B |
|
||
Price history
1 event — show timeline
- 2026-05-08 Listed $1,449,000 OneKey® MLS as Distributed by MLS Grid
Property tax history
+5.4%/yrLatest (2025): $9,306 · +3.4% YoY. Source: county tax records.
Cash-flow waterfall
monthlySold comps — $/sqft
last 12 mo · ≤1 miLoading sold comps…