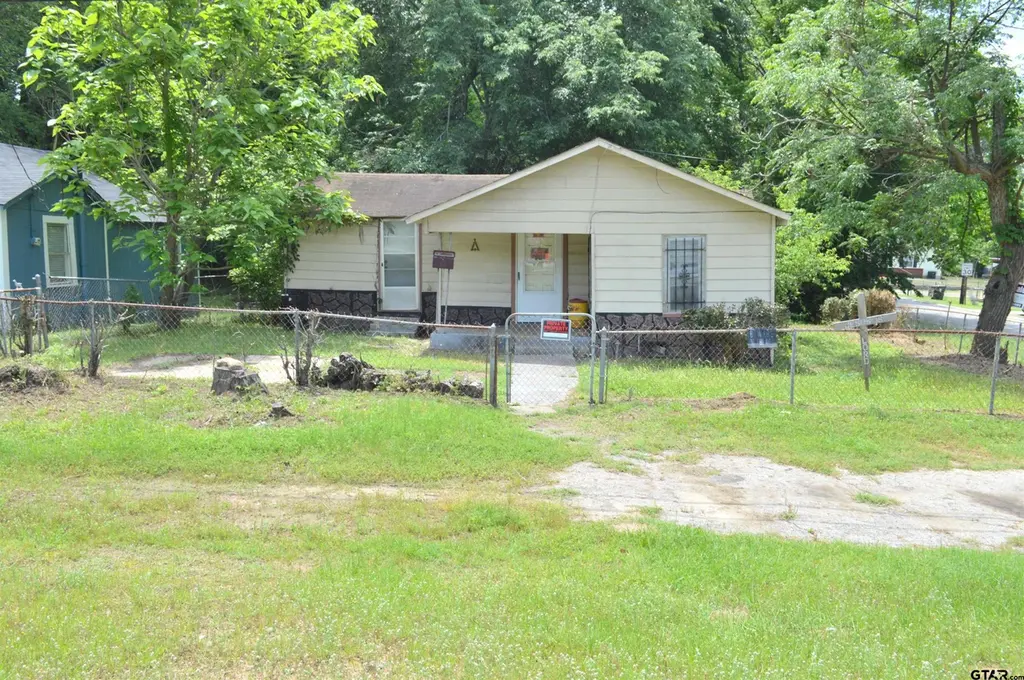
3210 Bellwood Rd · Tyler, TX
Flood risk 1/10 · Minimal
- FEMA flood zone
- X (unshaded)
- Chance of flooding over 30 yrs
- 0.0%
- Est. flood insurance / yr
- $507 – $1,088
Fire risk 2/10 · Minimal
- Est. fire insurance / yr
- $1,222 – $2,270
Heat risk 6/10 · Moderate
- Hot days now (above 109°F)
- 7 days/yr
- Hot days in 30 yrs
- 24 days/yr
Wind risk 6/10 · Moderate
- Chance of severe wind over 30 yrs
- 59.0%
Air-quality risk 2/10 · Minimal
- Unhealthy air days now
- 0 days/yr
- Unhealthy air days in 30 yrs
- 1 days/yr
Risk factors via First Street. Map © Google.
Why this score? — see what drove the B grade
The composite is a weighted blend of 9 inputs, each scored 0–100. Each bar is that input's sub-score; the figure is the points it added to the 100-point composite (weight × sub-score).
- Cash flow +30.0/30.0
- 1% rule +10.0/10.0
- DSCR +10.0/10.0
- ARV discount +7.5/15.0
- Livability +3.8/5.0
- Rent growth +3.4/5.0
- Schools +3.3/10.0
- Condition / age +2.5/5.0
- Appreciation +0.0/10.0
$70,000
🖨 Deal sheet 📄 Offer letter ✓ Due diligence
Listing remarks MLS
OPPORTUNITIES ARE AWAITING YOU! this is a fixer upper! This house is located in a growing area of new homes and businesses! You can fix and/or remodel this house or restart from the ground up, it's all up to you! The Possibilities are endless! This is a 3/1 corner lot, You can make this corner statement what you want it to be, you decide! Come see invest and be a part of this developing community!
Key facts
- Corner lot
- Growing area
- 8,712 sq ft lot
Tags
Neighborhood map
What this means for you Summary
Snapshot
- This is a 3-bed/1.0-bath single-family listed at $70k.
Deal economics
- At list price, monthly cash flow is $573 ($7k/yr) — positive.
- The deal already cash-flows at list — no discount required.
- Meets the 1% rule at list price ($1k rent vs $70k).
- Recommended offer: $62k (12.0% below list) — sets the bar for market timing.
- Cap rate 16.1% vs local median 3.6% in Tyler — top-decile yield for the area; either an underpriced asset or a hidden risk that comps aren't pricing in. Stress-test before assuming the spread holds.
Location & tenants
- Location reads 75/100 on livability (#147 in TX, #4,181 nationally) — a middle-class / working-renter tenant base. Strengths: cost of living A+, housing A+, health & safety A+; Watch: employment C-, schools D+, crime D+.
- Tyler ISD (urban): math 39% / reading 38% proficiency, ranked #449 of 826 in TX (top 54%) — families likely to look elsewhere, expect single-tenant / working-renter base with shorter leases; 66% free/reduced lunch — lower-income household profile, screen leases tightly.
- Market conditions: Rents rising (+3.7%/yr); 327 active listings in the ZIP; 15 comparable units currently listed for rent nearby; rentals at typical pace (median 21d on market — plan ~3-4 weeks tenant-placement turnaround); 40% of comp listings sitting > 30 days — soft ceiling on asking rent; 595 units permitted in Smith County in 2024 (45 in 5+ unit buildings).
Forward outlook
- Local home prices are declining (-3.0%/yr); year-one equity from $484 of loan paydown is wiped out by about $2k of value loss. Plan a longer hold.
- Smith County population projected at +24% by 2050 — long-run rental-demand tailwind backs the buy-and-hold thesis.
- At projected returns (-3.0% appreciation + 3.7% rent growth), your $20k cash investment doubles in ~4 years — after that, you're playing with house money.
Negotiation context
- It's been on market 458 days — a 12% lower offer ($62k) is reasonable based on typical stale-listing flexibility.
Risks & watch-outs
- Watch-outs: built in 1950 — expect roof / HVAC / electrical / plumbing capex.
- Climate carrying-cost: major wind risk, 59% chance of damaging wind over 30y; extreme-heat days projected 7→24/yr by 2055 (HVAC capex compounding) — expect insurance premiums to compound above CPI over the hold.
Questions for the listing agent
- It's been on market 458 days. Have you received any prior offers? Is the seller open to a 12% concession, seller financing, or rate buy-down credit?
- Built in 1950 — when were the roof, HVAC, electrical panel, plumbing, and water heater last replaced?
- Why hasn't it sold? Are there any deal-killer items the seller is aware of (foundation, flood, title, zoning, code violations)?
- Is there a deadline driving the sale (1031 exchange, divorce, estate, relocation)? That informs how much negotiation room exists.
- Schools are D-rated, which usually means shorter tenancies and higher turnover. Who's the typical renter profile here, and what's been the actual vacancy rate?
- Crime grade is D in this area — have there been break-ins, vandalism, or insurance claims at this property in the last 3 years? What carrier currently insures it and at what premium?
- What's the average days-on-market for RENTAL listings here right now (not sales)? A rising rental-DOM trend means longer vacancies and softer asking-rent achievability than the comps imply.
- What's the recent tenant-quality profile in this submarket — average credit score on applications, eviction rate, late-payment / NSF rate, and stable-employment percentage? A property-management company in the area should have these aggregated.
- How much new for-sale + rental construction is in the pipeline within 1–3 miles? Heavy new supply typically softens prices + rents 12–24 months out; constrained supply supports both.
Investment metrics
- 1% rule
- 1.96% ✓
- Cap rate
- 16.11%
- Cash-on-cash
- 35.07%
- DSCR
- 2.56
- GRM
- 4.3
CMA / ARV
- ARV (median comp)
- $147,431
- List price
- $70,000
- Delta
- -52.52%
- Verdict
- UNDERPRICED
- Comps
- 7 within 1.0 mi
Show comp detail 1 sale within ~0.75 mi
| Address | Dist | Beds/Ba | Sqft | Sold | Price | $/sf | Match |
|---|---|---|---|---|---|---|---|
| 114 Tournament Rd | 0.65mi | 3/1.5 | 1,004 (-7%) | 18mo | $220,000 | $219 | 40 |
Match score weights: distance 35% · size 25% · config 20% · recency 20%. Top-matched comps best support the ARV.
Projected returns pro-forma
-3.0% appreciation · 3.66% rent growth · sell at horizon
- IRR
- 31.4%
- Equity multiple
- 2.33×
- Total profit
- $26,090
- Equity at exit
- $10,437
- IRR
- 38.9%
- Equity multiple
- 4.76×
- Total profit
- $73,652
- Equity at exit
- $6,052
Cash invested: $19,600 (down + closing). Projections, not guarantees.
Landlord ↔ Tenant lean methodology
- Overall (STATE)
- 87 Strongly Landlord-Friendly
- State Texas
- 87 Strongly Landlord-Friendly · R+5
- County
- — inherits STATE
- City
- — inherits STATE
ZIP-level market 75701
- Rents YoY
- 3.7%
- Active inventory
- 327
- Price-to-rent
- 4.3×
Monthly cashflow live
- Estimated rent
- $1,371 high interval (Pro) →
- Mortgage (P&I)
- −$367
- Tax from tax record
- −$114 /mo · $1,365/yr
- Insurance
- −$29
- HOA
- −$0
- Vacancy / Maint / Mgmt
- −$288
- Net cashflow
- $573
Break-even live
UW: 25.0% down · 7.5% · 30yr · 1.5% tax · 5.0% vac · 8.0% maint · 8.0% mgmt
Financing live
Cash to close
- Down payment
- $17,500
- Closing costs
- $2,100
- Reserves months
- —
- Total cash needed
- —
Loan-product check · same deal, 3 products live
Conventional
25% down · 7.5% · 30yr
- Down + closing
- —
- Monthly P&I
- —
- Monthly cashflow
- —
- DSCR
- —
- Eligible?
- —
Personal DTI + credit; lowest rate.
DSCR
20% down · 8.5% · 30yr
- Down + closing
- —
- Monthly P&I
- —
- Monthly cashflow
- —
- DSCR
- —
- Eligible?
- —
No personal income docs; deal must DSCR.
Hard money
10% down · 12.0% · 12mo
- Down + closing
- —
- Monthly P&I
- —
- Monthly cashflow
- —
- DSCR
- —
- Eligible?
- —
Short-term bridge; refi at stabilization.
Rent comps 15 comps
| Address | Beds | Baths | Sqft | Rent | $/sqft | DOM | Units | Dist |
|---|---|---|---|---|---|---|---|---|
| 3111 W Jackson St Tyler, TX | 3.0 | 2.0 | 1028 | $1,564 | $1.52 | 43d | 1 | 0.30mi |
| 2815 W Shaw St Unit 2 Tyler, TX | 2.0 | 1.0 | 875 | $1,200 | $1.37 | 43d | 1 | 0.43mi |
| 2803 W Shaw St Tyler, TX | 2.0 | 1.0 | 900 | $1,050 | $1.17 | 21d | 1 | 0.45mi |
| 2717 W Shaw St Tyler, TX | 2.0 | 1.0 | 985 | $1,200 | $1.22 | 21d | 1 | 0.45mi |
| 310 S Boon Ave Tyler, TX | 2.0 | 1.0 | 819 | $1,200 | $1.47 | 43d | 1 | 0.87mi |
| 1215 S Lenox St Tyler, TX | 3.0 | 2.0 | 1090 | $1,264 | $1.16 | 43d | 1 | 0.88mi |
| 2006 W Oakwood St Tyler, TX | 3.0 | 2.0 | 1344 | $1,895 | $1.41 | 13d | 1 | 1.17mi |
| 1523 W 2nd St Tyler, TX | 2.0 | 1.0 | 810 | $750 | $0.93 | 13d | 1 | 1.18mi |
| 1500 Mockingbird Ln Tyler, TX | 3.0 | 2.0 | 1090 | $1,230 | $1.13 | 43d | 1 | 1.19mi |
| 1822 W Oakwood St Tyler, TX | 2.0 | 1.0 | 900 | $1,100 | $1.22 | 43d | 1 | 1.24mi |
| 1806 W Oakwood St Tyler, TX | 2.0 | 1.0 | 900 | $975 | $1.08 | 21d | 1 | 1.27mi |
| 1800 W Oakwood St Tyler, TX | 2.0 | 1.0 | 900 | $975 | $1.08 | 21d | 1 | 1.28mi |
| 1104 W Park St Tyler, TX | 3.0 | 2.0 | 1440 | $1,650 | $1.15 | 21d | 1 | 1.42mi |
| 1216 S Glenwood Blvd Tyler, TX | 2.0 | 1.0 | 808 | $1,200 | $1.49 | 13d | 1 | 1.45mi |
| 210 N Ross Ave Tyler, TX | 2.0 | 1.0 | 850 | $695 | $0.82 | 21d | 1 | 1.48mi |
Listing history 20 events
-
2026-06-19days on market $70,000 Active 458 DOM
-
2026-06-18days on market $70,000 Active 457 DOM
-
2026-06-17days on market $70,000 Active 456 DOM
-
2026-06-16days on market $70,000 Active 455 DOM
-
2026-06-15days on market $70,000 Active 454 DOM
-
2026-06-14days on market $70,000 Active 452 DOM
-
2026-06-13days on market $70,000 Active 451 DOM
-
2026-06-10days on market $70,000 Active 449 DOM
-
2026-06-09days on market $70,000 Active 448 DOM
-
2026-06-08days on market $70,000 Active 447 DOM
-
2026-06-07days on market $70,000 Active 446 DOM
-
2026-06-05days on market $70,000 Active 443 DOM
-
2026-06-02days on market $70,000 Active 441 DOM
-
2026-06-01days on market $70,000 Active 440 DOM
-
2026-05-31days on market $70,000 Active 439 DOM
-
2026-05-30days on market $70,000 Active 438 DOM
-
2026-02-09price $70,000 403-char remark
Show marketing remark (403 chars)
OPPORTUNITIES ARE AWAITING YOU! this is a fixer upper! This house is located in a growing area of new homes and businesses! You can fix and/or remodel this house or restart from the ground up, it's all up to you! The Possibilities are endless! This is a 3/1 corner lot, You can make this corner statement what you want it to be, you decide! Come see invest and be a part of this developing community!
-
2025-06-06price $80,000 403-char remark
Show marketing remark (403 chars)
OPPORTUNITIES ARE AWAITING YOU! this is a fixer upper! This house is located in a growing area of new homes and businesses! You can fix and/or remodel this house or restart from the ground up, it's all up to you! The Possibilities are endless! This is a 3/1 corner lot, You can make this corner statement what you want it to be, you decide! Come see invest and be a part of this developing community!
-
2025-03-18$95,000 Active 403-char remark
Show marketing remark (403 chars)
OPPORTUNITIES ARE AWAITING YOU! this is a fixer upper! This house is located in a growing area of new homes and businesses! You can fix and/or remodel this house or restart from the ground up, it's all up to you! The Possibilities are endless! This is a 3/1 corner lot, You can make this corner statement what you want it to be, you decide! Come see invest and be a part of this developing community!
-
2007-12-19soldstatus
ⓘ Source: listings_history table (triggers on properties + properties_extension) + one-shot
backfill from property_details.listing_events for pre-trigger history.
Tax reassessment forecast TX · Resets to sale price
- Current annual tax
- $1,365 · $114/mo
- Projected year-2 tax
- $1,365 · $114/mo
- Expected delta
- $0/yr ($0/mo · 0.0%)
ⓘ Screening estimate from a state-policy table — verify with the county assessor before closing.
Climate risk First Street
- Flood 1/10 Low FEMA zone X (unshaded) · 0% chance over 30 yrs
- Wildfire 2/10 Low
- Heat 6/10 Major 7 d/yr ≥109°F today · 24 d/yr by 30 yrs out
- Wind 6/10 Major 59% chance of damaging wind over 30 yrs
- Air quality 2/10 Low 0 unhealthy d/yr today · 1 by 30 yrs out
Nearby sold comps map
Loading sold comps map…
Walkable amenities ~0.75 mi
Loading nearby amenities…
Taxation est. · year 1
- Rental income
- $16,448
- − Mortgage interest
- −$3,921
- − Property taxes
- −$1,365
- − Insurance
- −$350
- − Repairs & maintenance
- −$1,316
- − Management
- −$1,316
- − Depreciation
- −$2,036
- Taxable income
- $6,143
- Est. tax owed @ 24.0%
- −$1,474
- After-tax cash flow
- $5,399/yr
For passive investors: Depreciation is non-cash, so a rental often shows a tax loss while cash-flowing — sheltering income. Rental losses are passive: they offset passive income freely, and up to $25,000/yr can offset ordinary (W-2) income if you actively participate and your MAGI is under $100k (phasing out to $0 by $150k); unused losses carry forward. On sale, claimed depreciation is recaptured at up to 25%, and gains may owe capital-gains tax (a 1031 exchange can defer both). Figures are a year-1 estimate at your 24.0% rate — not tax advice; consult a CPA.
Schools (NCES district)
- District
- Tyler ISD
- NCES district ID
- 4843470
- Math proficiency
- 39% ▼ -4.00%
- Reading proficiency
- 38% ▼ -1.00%
- Median HH income
- $44,090
- Composite
- 32.69/100
- National rank
- #5650
- State rank
- #449 of 826 in TX
Livability — Tyler
- Score
- 75/100
- State rank
- #147
- US rank
- #4181
Category grades
Schools grade is shown separately in the Schools card above.
Census & demographics
- Census place
- Tyler, TX
- County
- Smith County · 180,570 people
- City population
- 127,842
- Metro
- Tyler, TX
- Population (ZIP)
- 36,344
- Household income
- $66,401
- Rent vs Own
- Severe rent burden
- 1116.0
Population outlook (Smith County) Hauer SSP2
- Today (2025)
- 248,890 people
- By 2030
- 261,665 · +5.1%
- By 2040
- 286,114 · +15.0%
- By 2050
- 308,006 · +23.8%
- By 2075
- 354,171 · +42.3%
- By 2100
- 372,828 · +49.8%
Race, ethnicity, and origin ACS 2023
- Neighborhood character
- Diverse neighborhood (Simpson 0.64)
- Race & ethnicity
- White 53% Black 21% Hispanic / Latino 19% Two or more races 8% Asian 2%
- Hispanic origin (detail)
- Mexican 17%
- Common ancestry
- Slovak 2% Italian 1% Lithuanian 1%
- Foreign-born
- 8% · Canada
- Languages at home
- 84% English-only · Spanish 14% Other Indo-European 1%
Political lean MEDSL · Smith
- 2024 margin
- Solid R (+45.1) · D 27.0% · R 72.1%
- 2008→2024 swing
- -5.6pp toward R · 2008: -39.5pp · 2024: -45.1pp
- All cycles
- 2024: R+45.1 2020: R+39.4 2016: R+43.9 2012: R+46.9 2008: R+39.5
Not yet ingested
- Civics
- —
Market trends
- HPI YoY
- ▼ -299.78%
- Current HPI
- 207.238
- Rent YoY
- ▲ 3.66%
- Metro
- Tyler, TX
- State GDP YoY
- ▲ 3.95%
- F500 in state
- 110
Industry mix (Fortune 500 HQ in TX)
| Industry | F500 HQs | Revenue |
|---|---|---|
| Energy | 16 | $1,198B |
|
||
| Technology | 5 | $198B |
|
||
| Engineering / Construction | 4 | $72B |
|
||
| Energy Services | 3 | $60B |
|
||
| Utilities | 3 | $41B |
|
||
| Healthcare | 2 | $330B |
|
||
Price history
-26.3% since first listed4 events — show timeline
- 2026-02-09 Price Changed $70,000 GTAR
- 2025-06-06 Price Changed $80,000 GTAR
- 2025-03-18 Listed $95,000 GTAR
- 2007-12-19 Sold (Public Records) — Public Records
Property tax history
+9.9%/yrLatest (2024): $1,365 · +6.3% YoY. Source: county tax records.
Cash-flow waterfall
monthlySold comps — $/sqft
last 12 mo · ≤1 miLoading sold comps…