 14-Plex
5746 Tilton · Jurupa Valley, CA
Flood risk 1/10 · Minimal
- FEMA flood zone
- X
- Chance of flooding over 30 yrs
- 0.0%
- Est. flood insurance / yr
- $507 – $1,088
Fire risk 8/10 · Major
- Est. fire insurance / yr
- $659 – $1,223
Heat risk 8/10 · Major
- Hot days now (above 103°F)
- 7 days/yr
- Hot days in 30 yrs
- 21 days/yr
Wind risk 1/10 · Minimal
- Chance of severe wind over 30 yrs
- —
Air-quality risk 10/10 · Severe
- Unhealthy air days now
- 27 days/yr
- Unhealthy air days in 30 yrs
- 32 days/yr
Risk factors via First Street. Map © Google.
Why this score? — see what drove the D grade
The composite is a weighted blend of 9 inputs, each scored 0–100. Each bar is that input's sub-score; the figure is the points it added to the 100-point composite (weight × sub-score).
- Cash flow +15.0/30.0
- ARV discount +7.5/15.0
- DSCR +4.6/10.0
- 1% rule +3.1/10.0
- Schools +3.1/10.0
- Rent growth +2.8/5.0
- Livability +2.5/5.0
- Condition / age +2.5/5.0
- Appreciation +0.0/10.0
$2,980,000
🖨 Deal sheet 📄 Offer letter ✓ Due diligence
Multi-family units
County records classify this as Multi-Family (5+ Unit). Listing-text estimate: 14 units. confirmed
5+ unit building — per-unit beds/baths from public records are typically unavailable; the breakdown below (if shown) is an estimate from the listing text.
Listing remarks MLS
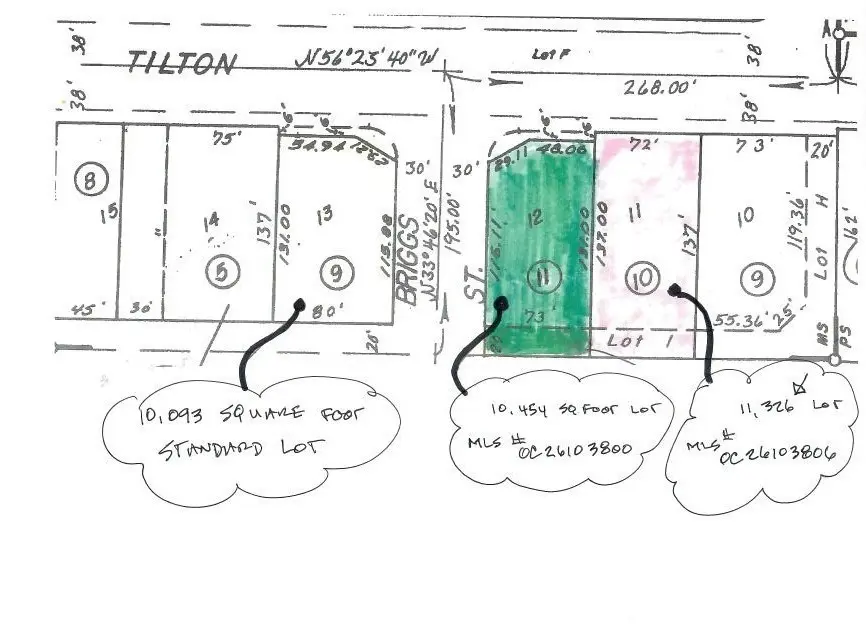
11,320 ft. ² lot 181–043–010 with storage container included, ($160 a month income on storage container). When combined with lot number 818–043–011 total area is 1/2 an acre. When combined with additional property, Edgar, at the Jurupa Valley building department advised that an additional eight ADU units could be added to property… (do your own due diligence regarding usage).
Key facts
- 0.24 acre lot
- 16 parking spots
- Built 1981
Property features AI
Finance
- Financial info: 14 total units; Total building area 6,424; Gross scheduled income: $285,360; Gross income: $285,360; Gross operating income: $271,100; Gross spendable income: $222,480; Net operating income: $208,220; Laundry income: $5,400 (equipment owned); Operating expenses: $62,880; Operating expense example items: taxes $30,000; trash $11,000; insurance $7,680; water/sewer $6,400; electric $2,160; gardener $3,600; Vacancy allowance rate: 5% (allowance $14,260); 13 separate gas meters and 13 separate electric meters; 1 building
- HOA & community: Community features include curbs, sidewalks, park, dog park, hiking, horse trails, foothills
Exterior
- Parking: 16 on-site parking spaces; Uncovered parking (16 spaces); Asphalt driveway; Private, unassigned parking spaces
- Utilities: Electricity on property; Natural gas connected; Public/district water; Public sewer; Cable connected; Underground utilities; Sewer connected; Water connected
- Home design: Attached property; Turnkey, updated/remodeled condition; 2 stories
- Construction: Stucco construction; Synthetic, reflective roof
- Exterior features: Block wall and wrought iron fencing; No pool
Interior
- Kitchen: Gas water heater; Free standing range; Gas range; Gas oven; Dishwasher
- Bedrooms: 14 bedrooms total (various units)
- Bathrooms: 14 full bathrooms total (various units)
- Heating & cooling: Central heating (furnace); Wall heaters; Central cooling; Wall/window cooling units
- Interior features: Block walls; Mirrored closet doors; Panel doors; Two levels; Entry on level 1
- Laundry & utility: On-site laundry (individual rooms and community/area facilities); Laundry income included in gross scheduled income; Laundry equipment owned
Neighborhood map
What this means for you Summary
Snapshot
- This is a 14 × 1-bed/1-bath units multifamily listed at $2.98M.
Deal economics
- At list price, monthly cash flow is $940 ($11k/yr) — positive. Per door: $67/mo.
- The deal already cash-flows at list — no discount required.
- To meet the 1% rule (rent ≥ 1% of price), the offer needs to be $2.41M (19.2% below list).
- Recommended offer: $2.41M (19.2% below list) — sets the bar for 1% rule.
- Cap rate 6.7% vs local median 2.9% in Jurupa Valley — top-decile yield for the area; either an underpriced asset or a hidden risk that comps aren't pricing in. Stress-test before assuming the spread holds.
Location & tenants
- Location reads 49/100 on livability (#1,170 in CA) — a working-class tenant base; expect higher turnover. Strengths: housing A+, employment A-; Watch: schools F, amenities F, commute F.
- Jurupa Unified (suburban): math 25% / reading 38% proficiency, ranked #953 of 1,400 in CA (top 68%) — families likely to look elsewhere, expect single-tenant / working-renter base with shorter leases; 64% free/reduced lunch — lower-income household profile, screen leases tightly.
- Market conditions: Rents rising (+1.3%/yr); 202 active listings in the ZIP; solid renter incomes; 9,195 units permitted in Riverside County in 2024 (1,512 in 5+ unit buildings).
- At $24,084/mo this rent would consume 303% of the median local household income ($95k/yr) (locally 1694% of renters already pay >50% of income on rent) — very limited rent-growth headroom before tenants either downsize or default.
Forward outlook
- Local home prices are declining (-3.0%/yr); year-one equity from $21k of loan paydown is wiped out by about $89k of value loss. Plan a longer hold.
- Riverside County population projected at +22% by 2050 — long-run rental-demand tailwind backs the buy-and-hold thesis.
Negotiation context
- It's been on market 17 days — a 2% lower offer ($2.94M) is reasonable based on typical stale-listing flexibility.
- 5 sale attempts since 13y ago; this cycle's ask has dropped $170k (5%) from the opening price — seller is motivated, your offer sets the floor, not the list.
- Current owner paid $568k; list at $2.98M implies a 425% gain — meaningful room to come down on a strong offer.
Risks & watch-outs
- Climate carrying-cost: severe wildfire risk; extreme-heat days projected 7→21/yr by 2055 (HVAC capex compounding) — expect insurance premiums to compound above CPI over the hold.
Questions for the listing agent
- Can we see the unit-by-unit rent roll, current vacancy, and any below-market leases? What's the average tenancy length?
- What capital expenditures (roof, boiler, parking lot, exteriors) have been made in the last 5 years, and what's planned in the next 2?
- Is there a deadline driving the sale (1031 exchange, divorce, estate, relocation)? That informs how much negotiation room exists.
- Schools are F-rated, which usually means shorter tenancies and higher turnover. Who's the typical renter profile here, and what's been the actual vacancy rate?
- The area grade is low — what's the realistic commute time and amenity access for the typical tenant pool here? Any planned neighborhood developments (good or bad) we should know about?
- What's the average days-on-market for RENTAL listings here right now (not sales)? A rising rental-DOM trend means longer vacancies and softer asking-rent achievability than the comps imply.
- What's the recent tenant-quality profile in this submarket — average credit score on applications, eviction rate, late-payment / NSF rate, and stable-employment percentage? A property-management company in the area should have these aggregated.
- How much new apartment / multifamily construction is in the pipeline within 1–3 miles? Heavy new supply (>2% of stock underway) typically softens rents 12–24 months out; light construction supports rent growth.
Investment metrics
- 1% rule
- 0.81% ✗
- Cap rate
- 6.67%
- Cash-on-cash
- 1.35%
- DSCR
- 1.06
- GRM
- 10.3
CMA / ARV
No comps found within radius.
Projected returns pro-forma
-3.0% appreciation · 1.31% rent growth · sell at horizon
- IRR
- -15.9%
- Equity multiple
- 0.44×
- Total profit
- $-464,484
- Equity at exit
- $444,328
- IRR
- -10.4%
- Equity multiple
- 0.41×
- Total profit
- $-491,921
- Equity at exit
- $257,656
Cash invested: $834,400 (down + closing). Projections, not guarantees.
Landlord ↔ Tenant lean methodology
- Overall (STATE)
- 18 Strongly Tenant-Friendly
- State California
- 18 Strongly Tenant-Friendly · D+13
- County
- — inherits STATE
- City
- — inherits STATE
ZIP-level market 92509
- Rents YoY
- 1.3%
- Active inventory
- 202
- Price-to-rent
- 144.4×
Monthly cashflow live
- Estimated rent
- $24,084 medium interval (Pro) →
- Mortgage (P&I)
- −$15,627
- Tax from tax record
- −$1,217 /mo · $14,609/yr
- Insurance
- −$1,242
- HOA
- −$0
- Vacancy / Maint / Mgmt
- −$5,058
- Net cashflow
- $940
Break-even live
14-unit breakdown (identical units grouped — click to expand)
| Units | Beds | Baths | Est. rent |
|---|---|---|---|
| 14× units | 1 | 1 | $24,080 |
| #1 | 1 | 1 | $1,720 |
| #2 | 1 | 1 | $1,720 |
| #3 | 1 | 1 | $1,720 |
| #4 | 1 | 1 | $1,720 |
| #5 | 1 | 1 | $1,720 |
| #6 | 1 | 1 | $1,720 |
| #7 | 1 | 1 | $1,720 |
| #8 | 1 | 1 | $1,720 |
| #9 | 1 | 1 | $1,720 |
| #10 | 1 | 1 | $1,720 |
| #11 | 1 | 1 | $1,720 |
| #12 | 1 | 1 | $1,720 |
| #13 | 1 | 1 | $1,720 |
| #14 | 1 | 1 | $1,720 |
| Total (14 units) | $24,084 | ||
UW: 25.0% down · 7.5% · 30yr · 1.5% tax · 5.0% vac · 8.0% maint · 8.0% mgmt
Financing live
Cash to close
- Down payment
- $745,000
- Closing costs
- $89,400
- Reserves months
- —
- Total cash needed
- —
Loan-product check · same deal, 3 products live
Conventional
25% down · 7.5% · 30yr
- Down + closing
- —
- Monthly P&I
- —
- Monthly cashflow
- —
- DSCR
- —
- Eligible?
- —
Personal DTI + credit; lowest rate.
DSCR
20% down · 8.5% · 30yr
- Down + closing
- —
- Monthly P&I
- —
- Monthly cashflow
- —
- DSCR
- —
- Eligible?
- —
No personal income docs; deal must DSCR.
Hard money
10% down · 12.0% · 12mo
- Down + closing
- —
- Monthly P&I
- —
- Monthly cashflow
- —
- DSCR
- —
- Eligible?
- —
Short-term bridge; refi at stabilization.
Listing history 36 events
-
2026-06-18days on market $2,980,000 Active 17 DOM
-
2026-06-17days on market $2,980,000 Active 16 DOM
-
2026-06-16days on market $2,980,000 Active 15 DOM
-
2026-06-15days on market $2,980,000 Active 14 DOM
-
2026-06-13days on market $2,980,000 Active 12 DOM
-
2026-06-13days on market $2,980,000 Active 11 DOM
-
2026-06-09days on market $2,980,000 Active 8 DOM
-
2026-06-08days on market $2,980,000 Active 7 DOM
-
2026-06-07days on market $2,980,000 Active 6 DOM
-
2026-06-04days on market $2,980,000 Active 3 DOM
-
2026-06-03days on market $2,980,000 Active 2 DOM
-
2026-06-02statusdays on market $2,980,000 Active 1 DOM
-
2026-06-01days on market $2,980,000 Coming Soon 6 DOM
-
2026-05-31days on market $2,980,000 Coming Soon 5 DOM
-
2026-05-26historical $180,000 417-char remark
Show marketing remark (417 chars)
11,320 ft. ² lot 181–043–010 with storage container included, ($160 a month income on storage container). When combined with lot number 818–043–011 total area is 1/2 an acre. When combined with additional property, Edgar, at the Jurupa Valley building department advised that an additional eight ADU units could be added to property… (do your own due diligence regarding usage).
-
2026-05-26historical $2,980,000
Show marketing remark (417 chars)
11,320 ft. ² lot 181–043–010 with storage container included, ($160 a month income on storage container). When combined with lot number 818–043–011 total area is 1/2 an acre. When combined with additional property, Edgar, at the Jurupa Valley building department advised that an additional eight ADU units could be added to property… (do your own due diligence regarding usage).
-
2025-08-14historical
-
2025-05-27$3,150,000 Active
-
2024-03-16historical $1,680
-
2024-02-10$1,680
-
2023-11-18historical $1,750
-
2023-10-14$1,750
-
2014-07-09historical
-
2014-06-04soldstatus $568,000
-
2014-02-25$2,500,000 Active
-
2014-01-01historical
-
2013-03-11$2,500,000 Active
-
2011-09-27soldstatus $1,950,000
-
2005-05-19soldstatus $1,100,000
-
1994-06-30soldstatus $425,000
-
1994-03-21soldstatus $350,000
-
1991-12-26soldstatus $463,285
-
1988-12-21soldstatus $343,500
-
1988-09-16soldstatus $220,000
-
1988-09-16soldstatus $647,500
-
1986-07-11soldstatus $291,500
ⓘ Source: listings_history table (triggers on properties + properties_extension) + one-shot
backfill from property_details.listing_events for pre-trigger history.
Tax reassessment forecast CA · Resets to sale price
- Current annual tax
- $14,609 · $1,217/mo
- Projected year-2 tax
- $22,648 · $1,887/mo
- Expected delta
- +$8,039/yr (+$670/mo · 55.0%)
ⓘ Screening estimate from a state-policy table — verify with the county assessor before closing.
Climate risk First Street
- Flood 1/10 Low FEMA zone X · 0% chance over 30 yrs
- Wildfire 8/10 Severe
- Heat 8/10 Severe 7 d/yr ≥103°F today · 21 d/yr by 30 yrs out
- Wind 1/10 Low
- Air quality 10/10 Extreme 27 unhealthy d/yr today · 32 by 30 yrs out
Nearby sold comps map
Loading sold comps map…
Walkable amenities ~0.75 mi
Loading nearby amenities…
Taxation est. · year 1
- Rental income
- $289,008
- − Mortgage interest
- −$166,926
- − Property taxes
- −$14,609
- − Insurance
- −$14,900
- − Repairs & maintenance
- −$23,121
- − Management
- −$23,121
- − Depreciation
- −$86,691
- Taxable loss
- −$40,359
- Est. tax savings @ 24.0%
- +$9,686
- After-tax cash flow
- $20,964/yr
For passive investors: Depreciation is non-cash, so a rental often shows a tax loss while cash-flowing — sheltering income. Rental losses are passive: they offset passive income freely, and up to $25,000/yr can offset ordinary (W-2) income if you actively participate and your MAGI is under $100k (phasing out to $0 by $150k); unused losses carry forward. On sale, claimed depreciation is recaptured at up to 25%, and gains may owe capital-gains tax (a 1031 exchange can defer both). Figures are a year-1 estimate at your 24.0% rate — not tax advice; consult a CPA.
Schools (NCES district)
- District
- Jurupa Unified
- NCES district ID
- 0619260
- Math proficiency
- 25% ▲ 2.00%
- Reading proficiency
- 38% ▲ 2.00%
- Median HH income
- $58,100
- Composite
- 30.97/100
- National rank
- #11327
- State rank
- #953 of 1400 in CA
Livability — Jurupa Valley
- Score
- 49/100
- State rank
- #1170
- US rank
- #25915
Category grades
Schools grade is shown separately in the Schools card above.
Census & demographics
- Census place
- Jurupa Valley, CA
- County
- Riverside County · 2,287,001 people
- City population
- 119,165
- Metro
- Riverside-San Bernardino-Ontario, CA
- Population (ZIP)
- 81,182
- Household income
- $95,355
- Rent vs Own
- Severe rent burden
- 1694.0
Population outlook (Riverside County) Hauer SSP2
- Today (2025)
- 2,664,475 people
- By 2030
- 2,802,692 · +5.2%
- By 2040
- 3,050,904 · +14.5%
- By 2050
- 3,256,783 · +22.2%
- By 2075
- 3,655,058 · +37.2%
- By 2100
- 3,766,594 · +41.4%
Race, ethnicity, and origin ACS 2023
- Neighborhood character
- Predominantly Hispanic (74%)
- Race & ethnicity
- Hispanic / Latino 74% White 17% Two or more races 16% Black 4% Asian 4% Native American 1%
- Hispanic origin (detail)
- Mexican 67%
- Common ancestry
- Lithuanian 1%
- Foreign-born
- 28% · Canada, China, Vietnam
- Languages at home
- 42% English-only · Spanish 54% Other Indo-European 1% Tagalog/Filipino 1%
Political lean MEDSL · Riverside
- 2024 margin
- Toss-up / Even · D 48.0% · R 49.3% · Other 2.6%
- 2008→2024 swing
- -3.6pp toward R · 2008: 2.3pp · 2024: -1.3pp
- All cycles
- 2024: R+1.3 2020: D+8.0 2016: D+4.3 2012: R+0.4 2008: D+2.3
Not yet ingested
- Civics
- —
Market trends
- HPI YoY
- ▼ -374.91%
- Current HPI
- 464.8939
- Rent YoY
- ▲ 1.31%
- Metro
- Riverside-San Bernardino-Ontario, CA
- State GDP YoY
- ▲ 3.21%
- F500 in state
- 116
Industry mix (Fortune 500 HQ in CA)
| Industry | F500 HQs | Revenue |
|---|---|---|
| Technology | 27 | $1,492B |
|
||
| Financial Services | 3 | $174B |
|
||
| Retail | 3 | $44B |
|
||
| Insurance | 3 | $26B |
|
||
| Media / Entertainment | 2 | $115B |
|
||
| Pharmaceuticals / Biotech | 2 | $62B |
|
||
Price history
-38.3% since first listed22 events — show timeline
- 2026-05-26 Coming Soon $180,000 CRMLS
- 2026-05-26 Coming Soon $2,980,000 CRMLS
- 2025-08-14 Listing Removed — CRMLS
- 2025-05-27 Listed $3,150,000 CRMLS
- 2024-03-16 Rental Removed $1,680 CRMLS
- 2024-02-10 Listed for Rent $1,680 CRMLS
- 2023-11-18 Rental Removed $1,750 CRMLS
- 2023-10-14 Listed for Rent $1,750 CRMLS
- 2014-07-09 Listing Removed — CRMLS
- 2014-06-04 Sold (Public Records) $568,000 Public Records
- 2014-02-25 Listed $2,500,000 CRMLS
- 2014-01-01 Listing Removed — CRMLS
- 2013-03-11 Listed $2,500,000 CRMLS
- 2011-09-27 Sold (Public Records) $1,950,000 Public Records
- 2005-05-19 Sold (Public Records) $1,100,000 Public Records
- 1994-06-30 Sold (Public Records) $425,000 Public Records
- 1994-03-21 Sold (Public Records) $350,000 Public Records
- 1991-12-26 Sold (Public Records) $463,285 Public Records
- 1988-12-21 Sold (Public Records) $343,500 Public Records
- 1988-09-16 Sold (Public Records) $647,500 Public Records
- 1988-09-16 Sold (Public Records) $220,000 Public Records
- 1986-07-11 Sold (Public Records) $291,500 Public Records
Property tax history
+5.1%/yrLatest (2025): $14,609 · +5.0% YoY. Source: county tax records.
Cash-flow waterfall
monthlySold comps — $/sqft
last 12 mo · ≤1 miLoading sold comps…