 6-Plex
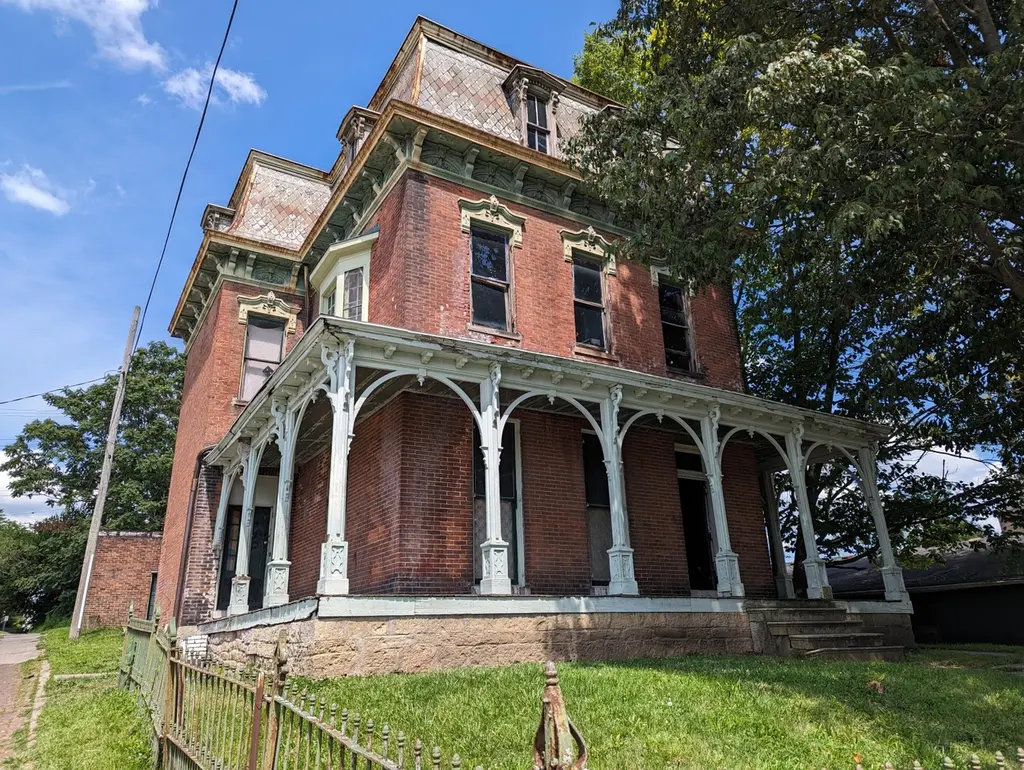
411 S Limestone St · Springfield, OH
Flood risk 1/10 · Minimal
- FEMA flood zone
- X (unshaded)
- Chance of flooding over 30 yrs
- 0.0%
- Est. flood insurance / yr
- $473 – $860
Fire risk 1/10 · Minimal
- Est. fire insurance / yr
- $713 – $1,323
Heat risk 4/10 · Minor
- Hot days now (above 100°F)
- 7 days/yr
- Hot days in 30 yrs
- 18 days/yr
Wind risk 2/10 · Minimal
- Chance of severe wind over 30 yrs
- —
Air-quality risk 3/10 · Minor
- Unhealthy air days now
- 2 days/yr
- Unhealthy air days in 30 yrs
- 3 days/yr
Risk factors via First Street. Map © Google.
Why this score? — see what drove the B- grade
The composite is a weighted blend of 9 inputs, each scored 0–100. Each bar is that input's sub-score; the figure is the points it added to the 100-point composite (weight × sub-score).
- Cash flow +30.0/30.0
- 1% rule +10.0/10.0
- DSCR +10.0/10.0
- ARV discount +7.5/15.0
- Livability +2.8/5.0
- Rent growth +2.5/5.0
- Condition / age +2.5/5.0
- Schools +1.9/10.0
- Appreciation +0.0/10.0
$295,000
🖨 Deal sheet (PDF) 📄 Offer letter ✓ Due diligence
Multi-family units
County records classify this as Multi-Family (5+ Unit). Listing-text estimate: 6 units. confirmed
5+ unit building — per-unit beds/baths from public records are typically unavailable; the breakdown below (if shown) is an estimate from the listing text.
Listing remarks MLS
Looking for an income producing property? Located in the Historic District is this beautiful 6-unit building, bringing in $3,200.00 per month income. There are 4 efficiencies and 2 1-bedroom units, detached 3 car carports.
Key facts
- 6,098 sq ft lot
- Built 1900
- Listed 1071 days
Neighborhood map
What this means for you Summary
Snapshot
- This is a 2×1bd/1ba + 4×1bd/?ba units multifamily listed at $295k.
Deal economics
- At list price, monthly cash flow is $2k ($21k/yr) — positive. Per door: $292/mo.
- The deal already cash-flows at list — no discount required.
- Meets the 1% rule at list price ($5k rent vs $295k).
- Recommended offer: $260k (12.0% below list) — sets the bar for market timing.
- Cap rate 13.4% vs local median 4.7% in Springfield — top-decile yield for the area; either an underpriced asset or a hidden risk that comps aren't pricing in. Stress-test before assuming the spread holds.
Location & tenants
- Location reads 56/100 on livability (#1,108 in OH) — a working-class tenant base; expect higher turnover. Strengths: cost of living A+, housing A+; Watch: crime F, amenities F, commute F.
- Springfield City School District (urban): math 20% / reading 27% proficiency, ranked #616 of 656 in OH (top 94%) — low school quality limits family demand, transient renter base, plan for 1-2y turnover; 75% free/reduced lunch — lower-income household profile, screen leases tightly.
- Market conditions: 158 active listings in the ZIP; lower-income renter base — watch delinquency; 232 units permitted in Clark County in 2024 (116 in 5+ unit buildings).
- At $4,830/mo this rent would consume 132% of the median local household income ($44k/yr) (locally 950% of renters already pay >50% of income on rent) — very limited rent-growth headroom before tenants either downsize or default.
Forward outlook
- Local home prices are declining (-3.0%/yr); year-one equity from $2k of loan paydown is wiped out by about $9k of value loss. Plan a longer hold.
- Clark County population projected at -16% by 2050 — secular population decline; favor cash flow + early exit over multi-decade hold.
- At projected returns (-3.0% appreciation + 3.0% rent growth), your $83k cash investment doubles in ~5 years — after that, you're playing with house money.
Negotiation context
- It's been on market 1072 days — a 12% lower offer ($260k) is reasonable based on typical stale-listing flexibility.
- 3 sale attempts since 3y ago with the ask held roughly flat each time — persistent listings suggest the price (not the market) is what's stuck; bring a comps-based counter.
Risks & watch-outs
- Watch-outs: built in 1900 — expect roof / HVAC / electrical / plumbing capex.
Questions for the listing agent
- It's been on market 1072 days. Have you received any prior offers? Is the seller open to a 12% concession, seller financing, or rate buy-down credit?
- Can we see the unit-by-unit rent roll, current vacancy, and any below-market leases? What's the average tenancy length?
- What capital expenditures (roof, boiler, parking lot, exteriors) have been made in the last 5 years, and what's planned in the next 2?
- Built in 1900 — when were the roof, HVAC, electrical panel, plumbing, and water heater last replaced?
- Why hasn't it sold? Are there any deal-killer items the seller is aware of (foundation, flood, title, zoning, code violations)?
- Is there a deadline driving the sale (1031 exchange, divorce, estate, relocation)? That informs how much negotiation room exists.
- Crime grade is F in this area — have there been break-ins, vandalism, or insurance claims at this property in the last 3 years? What carrier currently insures it and at what premium?
- What's the average days-on-market for RENTAL listings here right now (not sales)? A rising rental-DOM trend means longer vacancies and softer asking-rent achievability than the comps imply.
- What's the recent tenant-quality profile in this submarket — average credit score on applications, eviction rate, late-payment / NSF rate, and stable-employment percentage? A property-management company in the area should have these aggregated.
- How much new apartment / multifamily construction is in the pipeline within 1–3 miles? Heavy new supply (>2% of stock underway) typically softens rents 12–24 months out; light construction supports rent growth.
Investment metrics
- 1% rule
- 1.64% ✓
- Cap rate
- 13.42%
- Cash-on-cash
- 25.47%
- DSCR
- 2.13
- GRM
- 5.1
CMA / ARV
- ARV (median comp)
- $109,096
- List price
- $295,000
- Delta
- 170.40%
- Verdict
- OVERPRICED
- Comps
- 20 within 1.0 mi
Show comp detail 1 sale within ~0.75 mi
| Address | Dist | Beds/Ba | Sqft | Sold | Price | $/sf | Match |
|---|---|---|---|---|---|---|---|
| 659 W Mulberry St | 0.70mi | 6/2.0 | 3,048 (-13%) | 12mo | $100,000 | $33 | 20 |
Match score weights: distance 35% · size 25% · config 20% · recency 20%. Top-matched comps best support the ARV.
Projected returns pro-forma
-3.0% appreciation · 3.0% rent growth · sell at horizon
- IRR
- 19.1%
- Equity multiple
- 1.77×
- Total profit
- $63,926
- Equity at exit
- $43,985
- IRR
- 27.4%
- Equity multiple
- 3.42×
- Total profit
- $199,778
- Equity at exit
- $25,506
Cash invested: $82,600 (down + closing). Projections, not guarantees.
Landlord ↔ Tenant lean methodology
- Overall (STATE)
- 73 Landlord-Friendly
- State Ohio
- 73 Landlord-Friendly · R+6
- County
- — inherits STATE
- City
- — inherits STATE
ZIP-level market 45505
- Home prices YoY
- -34.3%
- Active inventory
- 158
- Price-to-rent
- 30.5×
Monthly cashflow live
- Estimated rent
- $4,830 medium interval (Pro) →
- Mortgage (P&I)
- −$1,547
- Tax from tax record
- −$393 /mo · $4,715/yr
- Insurance
- −$123
- HOA
- −$0
- Vacancy / Maint / Mgmt
- −$1,014
- Net cashflow
- $1,753
Break-even live
Sensitivity live
| Price | -10% $1,920 | -5% $1,836 | +0% $1,753 | +5% $1,669 | +10% $1,586 |
|---|---|---|---|---|---|
| Rent | -10% $1,371 | -5% $1,562 | +0% $1,753 | +5% $1,944 | +10% $2,134 |
| Rate | -1.0pp $1,901 | -0.5pp $1,828 | base $1,753 | +0.5pp $1,676 | +1.0pp $1,599 |
6-unit breakdown (identical units grouped — click to expand)
| Units | Beds | Baths | Est. rent |
|---|---|---|---|
| 2× units | 1 | 1 | $1,610 |
| #1 | 1 | 1 | $805 |
| #2 | 1 | 1 | $805 |
| 4× units | 1 | 0 | $3,220 |
| #3 | 1 | 0 | $805 |
| #4 | 1 | 0 | $805 |
| #5 | 1 | 0 | $805 |
| #6 | 1 | 0 | $805 |
| Total (6 units) | $4,830 | ||
UW: 25.0% down · 7.5% · 30yr · 1.5% tax · 5.0% vac · 8.0% maint · 8.0% mgmt
Financing live
Cash to close
- Down payment
- $73,750
- Closing costs
- $8,850
- Reserves months
- —
- Total cash needed
- —
Loan-product check · same deal, 3 products live
Conventional
25% down · 7.5% · 30yr
- Down + closing
- —
- Monthly P&I
- —
- Monthly cashflow
- —
- DSCR
- —
- Eligible?
- —
Personal DTI + credit; lowest rate.
DSCR
20% down · 8.5% · 30yr
- Down + closing
- —
- Monthly P&I
- —
- Monthly cashflow
- —
- DSCR
- —
- Eligible?
- —
No personal income docs; deal must DSCR.
Hard money
10% down · 12.0% · 12mo
- Down + closing
- —
- Monthly P&I
- —
- Monthly cashflow
- —
- DSCR
- —
- Eligible?
- —
Short-term bridge; refi at stabilization.
Listing history 33 events
-
2026-06-19days on market $295,000 Active 1072 DOM
-
2026-06-18days on market $295,000 Active 1071 DOM
-
2026-06-17days on market $295,000 Active 1070 DOM
-
2026-06-16days on market $295,000 Active 1069 DOM
-
2026-06-15days on market $295,000 Active 1068 DOM
-
2026-06-14days on market $295,000 Active 1066 DOM
-
2026-06-12days on market $295,000 Active 1065 DOM
-
2026-06-09days on market $295,000 Active 1062 DOM
-
2026-06-08days on market $295,000 Active 1061 DOM
-
2026-06-07days on market $295,000 Active 1060 DOM
-
2026-06-05days on market $295,000 Active 1057 DOM
-
2026-06-02days on market $295,000 Active 1055 DOM
-
2026-06-01days on market $295,000 Active 1054 DOM
-
2026-05-31days on market $295,000 Active 1053 DOM
-
2026-05-30days on market $295,000 Active 1052 DOM
-
2026-02-19price $295,000 222-char remark
Show marketing remark (222 chars)
Looking for an income producing property? Located in the Historic District is this beautiful 6-unit building, bringing in $3,200.00 per month income. There are 4 efficiencies and 2 1-bedroom units, detached 3 car carports.
-
2026-02-19price $295,000 222-char remark
Show marketing remark (222 chars)
Looking for an income producing property? Located in the Historic District is this beautiful 6-unit building, bringing in $3,200.00 per month income. There are 4 efficiencies and 2 1-bedroom units, detached 3 car carports.
-
2026-02-19price $295,000
Show marketing remark (222 chars)
Looking for an income producing property? Located in the Historic District is this beautiful 6-unit building, bringing in $3,200.00 per month income. There are 4 efficiencies and 2 1-bedroom units, detached 3 car carports.
-
2025-08-18price $300,000 222-char remark
Show marketing remark (222 chars)
Looking for an income producing property? Located in the Historic District is this beautiful 6-unit building, bringing in $3,200.00 per month income. There are 4 efficiencies and 2 1-bedroom units, detached 3 car carports.
-
2025-08-18price $300,000 222-char remark
Show marketing remark (222 chars)
Looking for an income producing property? Located in the Historic District is this beautiful 6-unit building, bringing in $3,200.00 per month income. There are 4 efficiencies and 2 1-bedroom units, detached 3 car carports.
-
2025-08-18price $300,000
Show marketing remark (222 chars)
Looking for an income producing property? Located in the Historic District is this beautiful 6-unit building, bringing in $3,200.00 per month income. There are 4 efficiencies and 2 1-bedroom units, detached 3 car carports.
-
2025-02-28price $295,000 222-char remark
Show marketing remark (222 chars)
Looking for an income producing property? Located in the Historic District is this beautiful 6-unit building, bringing in $3,200.00 per month income. There are 4 efficiencies and 2 1-bedroom units, detached 3 car carports.
-
2025-02-28price $295,000 222-char remark
Show marketing remark (222 chars)
Looking for an income producing property? Located in the Historic District is this beautiful 6-unit building, bringing in $3,200.00 per month income. There are 4 efficiencies and 2 1-bedroom units, detached 3 car carports.
-
2025-02-28price $295,000
Show marketing remark (222 chars)
Looking for an income producing property? Located in the Historic District is this beautiful 6-unit building, bringing in $3,200.00 per month income. There are 4 efficiencies and 2 1-bedroom units, detached 3 car carports.
-
2024-08-23price $290,000 222-char remark
Show marketing remark (222 chars)
Looking for an income producing property? Located in the Historic District is this beautiful 6-unit building, bringing in $3,200.00 per month income. There are 4 efficiencies and 2 1-bedroom units, detached 3 car carports.
-
2024-08-23price $290,000 222-char remark
Show marketing remark (222 chars)
Looking for an income producing property? Located in the Historic District is this beautiful 6-unit building, bringing in $3,200.00 per month income. There are 4 efficiencies and 2 1-bedroom units, detached 3 car carports.
-
2024-08-23price $290,000
Show marketing remark (222 chars)
Looking for an income producing property? Located in the Historic District is this beautiful 6-unit building, bringing in $3,200.00 per month income. There are 4 efficiencies and 2 1-bedroom units, detached 3 car carports.
-
2024-02-23price $295,000 222-char remark
Show marketing remark (222 chars)
Looking for an income producing property? Located in the Historic District is this beautiful 6-unit building, bringing in $3,200.00 per month income. There are 4 efficiencies and 2 1-bedroom units, detached 3 car carports.
-
2024-02-23price $295,000 222-char remark
Show marketing remark (222 chars)
Looking for an income producing property? Located in the Historic District is this beautiful 6-unit building, bringing in $3,200.00 per month income. There are 4 efficiencies and 2 1-bedroom units, detached 3 car carports.
-
2024-02-23price $295,000
Show marketing remark (222 chars)
Looking for an income producing property? Located in the Historic District is this beautiful 6-unit building, bringing in $3,200.00 per month income. There are 4 efficiencies and 2 1-bedroom units, detached 3 car carports.
-
2023-07-11$300,000 Active 222-char remark
Show marketing remark (222 chars)
Looking for an income producing property? Located in the Historic District is this beautiful 6-unit building, bringing in $3,200.00 per month income. There are 4 efficiencies and 2 1-bedroom units, detached 3 car carports.
-
2023-07-11$300,000 Active
Show marketing remark (222 chars)
Looking for an income producing property? Located in the Historic District is this beautiful 6-unit building, bringing in $3,200.00 per month income. There are 4 efficiencies and 2 1-bedroom units, detached 3 car carports.
ⓘ Source: listings_history table (triggers on properties + properties_extension) + one-shot
backfill from property_details.listing_events for pre-trigger history.
Tax reassessment forecast OH · Partial reset (capped growth)
- Current annual tax
- $4,715 · $393/mo
- Projected year-2 tax
- $4,715 · $393/mo
- Expected delta
- $0/yr ($0/mo · 0.0%)
ⓘ Screening estimate from a state-policy table — verify with the county assessor before closing.
Climate risk First Street
- Flood 1/10 Low FEMA zone X (unshaded) · 0% chance over 30 yrs
- Wildfire 1/10 Low
- Heat 4/10 Moderate 7 d/yr ≥100°F today · 18 d/yr by 30 yrs out
- Wind 2/10 Low
- Air quality 3/10 Moderate 2 unhealthy d/yr today · 3 by 30 yrs out
Nearby sold comps map
Loading sold comps map…
Walkable amenities ~0.75 mi
Loading nearby amenities…
Taxation est. · year 1
- Rental income
- $57,960
- − Mortgage interest
- −$16,525
- − Property taxes
- −$4,715
- − Insurance
- −$1,475
- − Repairs & maintenance
- −$4,637
- − Management
- −$4,637
- − Depreciation
- −$8,582
- Taxable income
- $17,390
- Est. tax owed @ 24.0%
- −$4,174
- After-tax cash flow
- $16,861/yr
For passive investors: Depreciation is non-cash, so a rental often shows a tax loss while cash-flowing — sheltering income. Rental losses are passive: they offset passive income freely, and up to $25,000/yr can offset ordinary (W-2) income if you actively participate and your MAGI is under $100k (phasing out to $0 by $150k); unused losses carry forward. On sale, claimed depreciation is recaptured at up to 25%, and gains may owe capital-gains tax (a 1031 exchange can defer both). Figures are a year-1 estimate at your 24.0% rate — not tax advice; consult a CPA.
Schools (NCES district)
- District
- Springfield City School District
- NCES district ID
- 3904481
- Math proficiency
- 20% ▼ -16.00%
- Reading proficiency
- 27% ▼ -12.00%
- Median HH income
- $32,541
- Composite
- 19.12/100
- National rank
- #8834
- State rank
- #616 of 656 in OH
Livability — Springfield
- Score
- 56/100
- State rank
- #1108
- US rank
- #22551
Category grades
Schools grade is shown separately in the Schools card above.
Census & demographics
- Census place
- Springfield, OH
- County
- Clark County · 33,261 people
- City population
- 33,261
- Metro
- Springfield, OH
- Population (ZIP)
- 19,826
- Household income
- $43,819
- Rent vs Own
- Severe rent burden
- 950.0
Population outlook (Clark County) Hauer SSP2
- Today (2025)
- 130,703 people
- By 2030
- 126,952 · -2.9%
- By 2040
- 118,344 · -9.5%
- By 2050
- 109,590 · -16.2%
- By 2075
- 89,464 · -31.6%
- By 2100
- 68,810 · -47.4%
Race, ethnicity, and origin ACS 2023
- Neighborhood character
- Predominantly White (75%)
- Race & ethnicity
- White 75% Black 14% Two or more races 7% Hispanic / Latino 4%
- Common ancestry
- Slovak 1% German 1% Iranian 1%
- Foreign-born
- 2% · Canada
- Languages at home
- 96% English-only · Spanish 2% French/Haitian/Cajun 1% German/W. Germanic 1%
Political lean MEDSL · Clark
- 2024 margin
- Strong R (+29.5) · D 34.8% · R 64.3%
- 2008→2024 swing
- -27.0pp toward R · 2008: -2.5pp · 2024: -29.5pp
- All cycles
- 2024: R+29.5 2020: R+23.3 2016: R+19.5 2012: R+1.8 2008: R+2.5
Not yet ingested
- Civics
- —
Market trends
- HPI YoY
- ▼ -135.16%
- Current HPI
- 258.9037
- Rent YoY
- —
- Metro
- Springfield, OH
- State GDP YoY
- ▲ 1.98%
- F500 in state
- 48
Industry mix (Fortune 500 HQ in OH)
| Industry | F500 HQs | Revenue |
|---|---|---|
| Insurance | 3 | $145B |
|
||
| Industrial Machinery | 3 | $49B |
|
||
| Financial Services | 3 | $24B |
|
||
| Consumer Goods | 2 | $93B |
|
||
| Aerospace / Defense | 2 | $47B |
|
||
| Utilities | 2 | $33B |
|
||
Price history
-1.7% since first listed18 events — show timeline
- 2026-02-19 Price Changed $295,000 CBRMLS
- 2026-02-19 Price Changed $295,000 Dayton MLS
- 2026-02-19 Price Changed $295,000 WRIST
- 2025-08-18 Price Changed $300,000 CBRMLS
- 2025-08-18 Price Changed $300,000 Dayton MLS
- 2025-08-18 Price Changed $300,000 WRIST
- 2025-02-28 Price Changed $295,000 Dayton MLS
- 2025-02-28 Price Changed $295,000 CBRMLS
- 2025-02-28 Price Changed $295,000 WRIST
- 2024-08-23 Price Changed $290,000 Dayton MLS
- 2024-08-23 Price Changed $290,000 CBRMLS
- 2024-08-23 Price Changed $290,000 WRIST
- 2024-02-23 Price Changed $295,000 Dayton MLS
- 2024-02-23 Price Changed $295,000 CBRMLS
- 2024-02-23 Price Changed $295,000 WRIST
- 2023-07-11 Listed $300,000 WRIST
- 2023-07-11 Listed $300,000 Dayton MLS
- 2023-07-11 Listed $300,000 CBRMLS
Property tax history
+15.9%/yrLatest (2025): $4,715 · +464.7% YoY. Source: county tax records.
Cash-flow waterfall
monthlySold comps — $/sqft
last 12 mo · ≤1 miLoading sold comps…