12765 Shiloh Church Rd · Dahlgren Center, VA
Flood risk 1/10 · Minimal
- FEMA flood zone
- X (unshaded)
- Chance of flooding over 30 yrs
- 0.0%
- Est. flood insurance / yr
- $507 – $1,088
Fire risk 4/10 · Minor
- Est. fire insurance / yr
- $755 – $1,403
Heat risk 8/10 · Major
- Hot days now (above 105°F)
- 7 days/yr
- Hot days in 30 yrs
- 15 days/yr
Wind risk 6/10 · Moderate
- Chance of severe wind over 30 yrs
- 27.0%
Air-quality risk 2/10 · Minimal
- Unhealthy air days now
- 1 days/yr
- Unhealthy air days in 30 yrs
- 1 days/yr
Risk factors via First Street. Map © Google.
Why this score? — see what drove the B- grade
The composite is a weighted blend of 9 inputs, each scored 0–100. Each bar is that input's sub-score; the figure is the points it added to the 100-point composite (weight × sub-score).
- Cash flow +30.0/30.0
- 1% rule +10.0/10.0
- DSCR +10.0/10.0
- ARV discount +7.5/15.0
- Livability +2.7/5.0
- Rent growth +2.5/5.0
- Condition / age +2.5/5.0
- Schools +2.3/10.0
- Appreciation +1.4/10.0
$79,900
🖨 Deal sheet (PDF) 📄 Offer letter ✓ Due diligence
Listing remarks MLS
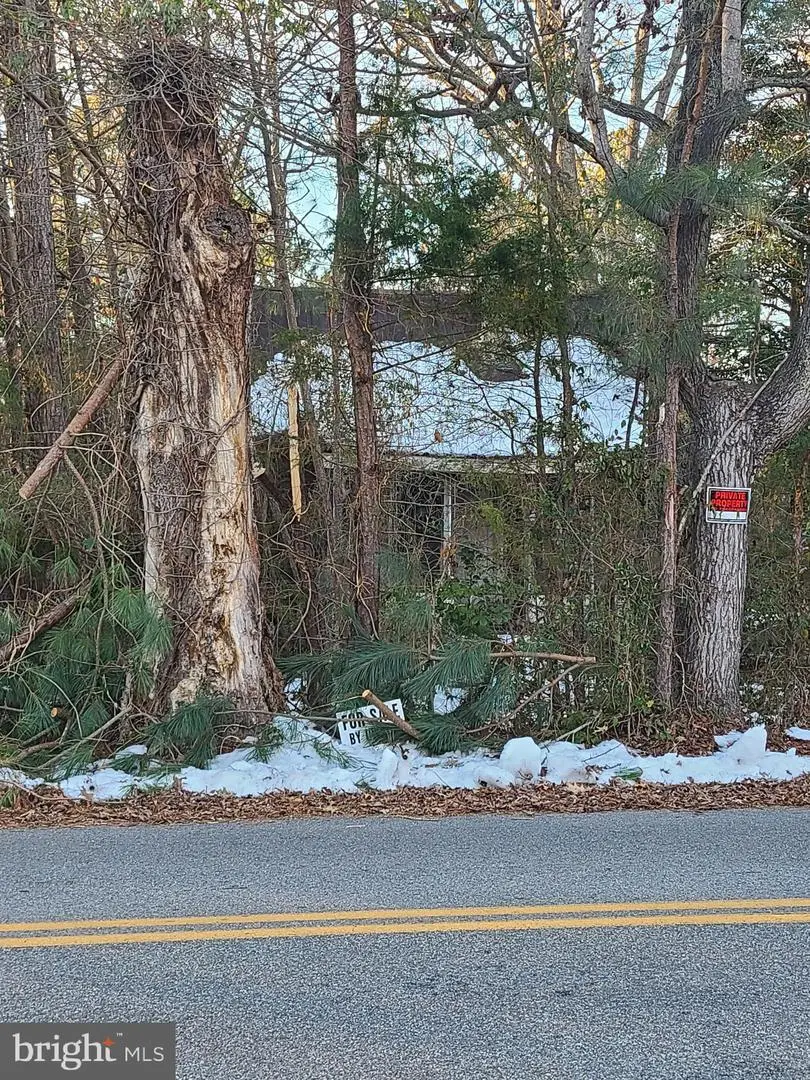
Value is in the land, the home is a tear down and not safe to enter. Great lot to build your dream home. Bring your own builder or use ours. Many options and floor plans to choose from, call today to get the process started. Please call the listing agent for details.
Key facts
- Great lot
- 1.5 acre lot
- Built 1940
Tags
Neighborhood map
What this means for you Summary
Snapshot
- This is a 2-bed/1.0-bath single-family listed at $80k.
Deal economics
- At list price, monthly cash flow is $1k ($12k/yr) — positive.
- The deal already cash-flows at list — no discount required.
- Meets the 1% rule at list price ($2k rent vs $80k).
- Recommended offer: $73k (9.0% below list) — sets the bar for market timing.
Location & tenants
- Location reads 53/100 on livability (#531 in VA) — a working-class tenant base; expect higher turnover. Strengths: crime A, employment A-, housing B; Watch: amenities F, commute F, cost of living F.
- Charles County Public Schools (suburban): math 13% / reading 29% proficiency, ranked #14 of 24 in MD (top 58%) — low school quality limits family demand, transient renter base, plan for 1-2y turnover.
- Market conditions: 1,542 units permitted in Charles County in 2024 (516 in 5+ unit buildings).
Forward outlook
- Local home prices are declining (-3.0%/yr); year-one equity from $552 of loan paydown is wiped out by about $2k of value loss. Plan a longer hold.
- Charles County population projected at +27% by 2050 — long-run rental-demand tailwind backs the buy-and-hold thesis.
- At projected returns (-3.0% appreciation + 3.0% rent growth), your $22k cash investment doubles in ~3 years — after that, you're playing with house money.
Negotiation context
- It's been on market 110 days — a 9% lower offer ($73k) is reasonable based on typical stale-listing flexibility.
- 7 sale attempts since 4y ago with the ask held roughly flat each time — persistent listings suggest the price (not the market) is what's stuck; bring a comps-based counter.
- Current owner paid $25k; list at $80k implies a 220% gain — meaningful room to come down on a strong offer.
Risks & watch-outs
- Watch-outs: built in 1940 — expect roof / HVAC / electrical / plumbing capex.
- Climate carrying-cost: major wind risk, 27% chance of damaging wind over 30y; extreme-heat days projected 7→15/yr by 2055 (HVAC capex compounding) — expect insurance premiums to compound above CPI over the hold.
Questions for the listing agent
- It's been on market 110 days. Have you received any prior offers? Is the seller open to a 9% concession, seller financing, or rate buy-down credit?
- Built in 1940 — when were the roof, HVAC, electrical panel, plumbing, and water heater last replaced?
- Why hasn't it sold? Are there any deal-killer items the seller is aware of (foundation, flood, title, zoning, code violations)?
- Is there a deadline driving the sale (1031 exchange, divorce, estate, relocation)? That informs how much negotiation room exists.
- What's the average days-on-market for RENTAL listings here right now (not sales)? A rising rental-DOM trend means longer vacancies and softer asking-rent achievability than the comps imply.
- What's the recent tenant-quality profile in this submarket — average credit score on applications, eviction rate, late-payment / NSF rate, and stable-employment percentage? A property-management company in the area should have these aggregated.
- How much new for-sale + rental construction is in the pipeline within 1–3 miles? Heavy new supply typically softens prices + rents 12–24 months out; constrained supply supports both.
Investment metrics
- 1% rule
- 2.55% ✓
- Cap rate
- 21.76%
- Cash-on-cash
- 55.24%
- DSCR
- 3.46
- GRM
- 3.3
CMA / ARV
- ARV (median comp)
- $241,582
- List price
- $79,900
- Delta
- -66.93%
- Verdict
- UNDERPRICED
- Comps
- 3 within 1.0 mi
Projected returns pro-forma
-3.0% appreciation · 3.0% rent growth · sell at horizon
- IRR
- 53.5%
- Equity multiple
- 3.36×
- Total profit
- $52,688
- Equity at exit
- $11,913
- IRR
- 58.7%
- Equity multiple
- 6.83×
- Total profit
- $130,530
- Equity at exit
- $6,908
Cash invested: $22,372 (down + closing). Projections, not guarantees.
Landlord ↔ Tenant lean methodology
- Overall (STATE)
- 55 Moderately Landlord-Leaning
- State Virginia
- 55 Moderately Landlord-Leaning · D+2
- County
- — inherits STATE
- City
- — inherits STATE
ZIP-level market 20664
- Home prices YoY
- -2.7%
- Price-to-rent
- 3.3×
Monthly cashflow live
- Estimated rent
- $2,039 medium interval (Pro) →
- Mortgage (P&I)
- −$419
- Tax from tax record
- −$129 /mo · $1,543/yr
- Insurance
- −$33
- HOA
- −$0
- Vacancy / Maint / Mgmt
- −$428
- Net cashflow
- $1,030
Break-even live
Sensitivity live
| Price | -10% $1,075 | -5% $1,052 | +0% $1,030 | +5% $1,007 | +10% $985 |
|---|---|---|---|---|---|
| Rent | -10% $869 | -5% $949 | +0% $1,030 | +5% $1,110 | +10% $1,191 |
| Rate | -1.0pp $1,070 | -0.5pp $1,050 | base $1,030 | +0.5pp $1,009 | +1.0pp $988 |
UW: 25.0% down · 7.5% · 30yr · 1.5% tax · 5.0% vac · 8.0% maint · 8.0% mgmt
Financing live
Cash to close
- Down payment
- $19,975
- Closing costs
- $2,397
- Reserves months
- —
- Total cash needed
- —
Loan-product check · same deal, 3 products live
Conventional
25% down · 7.5% · 30yr
- Down + closing
- —
- Monthly P&I
- —
- Monthly cashflow
- —
- DSCR
- —
- Eligible?
- —
Personal DTI + credit; lowest rate.
DSCR
20% down · 8.5% · 30yr
- Down + closing
- —
- Monthly P&I
- —
- Monthly cashflow
- —
- DSCR
- —
- Eligible?
- —
No personal income docs; deal must DSCR.
Hard money
10% down · 12.0% · 12mo
- Down + closing
- —
- Monthly P&I
- —
- Monthly cashflow
- —
- DSCR
- —
- Eligible?
- —
Short-term bridge; refi at stabilization.
Listing history 28 events
-
2026-06-18days on market $79,900 Active 110 DOM
-
2026-06-17days on market $79,900 Active 109 DOM
-
2026-06-16days on market $79,900 Active 108 DOM
-
2026-06-15days on market $79,900 Active 107 DOM
-
2026-06-13days on market $79,900 Active 105 DOM
-
2026-06-10days on market $79,900 Active 101 DOM
-
2026-06-08days on market $79,900 Active 100 DOM
-
2026-06-07days on market $79,900 Active 99 DOM
-
2026-06-04days on market $79,900 Active 96 DOM
-
2026-06-03days on market $79,900 Active 95 DOM
-
2026-06-02days on market $79,900 Active 94 DOM
-
2026-06-01days on market $79,900 Active 93 DOM
-
2026-05-31days on market $79,900 Active 92 DOM
-
2026-03-13historical
-
2026-02-28$79,900 Active 267-char remark
Show marketing remark (267 chars)
Value is in the land, the home is a tear down and not safe to enter. Great lot to build your dream home. Bring your own builder or use ours. Many options and floor plans to choose from, call today to get the process started. Please call the listing agent for details.
-
2026-02-16$79,900 Active
-
2025-12-31historical
-
2025-02-10$79,900 Active
-
2024-12-31historical
-
2024-04-25$80,000 Active
-
2023-12-31historical
-
2023-03-01status Active
-
2023-02-28historical
-
2022-06-06status Active
-
2022-06-01historical
-
2022-02-17$65,000 Active
-
2010-10-15soldstatus $25,000
-
2010-09-29soldstatus $25,000
ⓘ Source: listings_history table (triggers on properties + properties_extension) + one-shot
backfill from property_details.listing_events for pre-trigger history.
Tax reassessment forecast VA · Resets to sale price
- Current annual tax
- $1,543 · $129/mo
- Projected year-2 tax
- $1,543 · $129/mo
- Expected delta
- $0/yr ($0/mo · 0.0%)
ⓘ Screening estimate from a state-policy table — verify with the county assessor before closing.
Climate risk First Street
- Flood 1/10 Low FEMA zone X (unshaded) · 0% chance over 30 yrs
- Wildfire 4/10 Moderate
- Heat 8/10 Severe 7 d/yr ≥105°F today · 15 d/yr by 30 yrs out
- Wind 6/10 Major 27% chance of damaging wind over 30 yrs
- Air quality 2/10 Low 1 unhealthy d/yr today · 1 by 30 yrs out
Nearby sold comps map
Loading sold comps map…
Walkable amenities ~0.75 mi
Loading nearby amenities…
Taxation est. · year 1
- Rental income
- $24,466
- − Mortgage interest
- −$4,476
- − Property taxes
- −$1,543
- − Insurance
- −$400
- − Repairs & maintenance
- −$1,957
- − Management
- −$1,957
- − Depreciation
- −$2,324
- Taxable income
- $11,809
- Est. tax owed @ 24.0%
- −$2,834
- After-tax cash flow
- $9,523/yr
For passive investors: Depreciation is non-cash, so a rental often shows a tax loss while cash-flowing — sheltering income. Rental losses are passive: they offset passive income freely, and up to $25,000/yr can offset ordinary (W-2) income if you actively participate and your MAGI is under $100k (phasing out to $0 by $150k); unused losses carry forward. On sale, claimed depreciation is recaptured at up to 25%, and gains may owe capital-gains tax (a 1031 exchange can defer both). Figures are a year-1 estimate at your 24.0% rate — not tax advice; consult a CPA.
Schools (NCES district)
- District
- Charles County Public Schools
- NCES district ID
- 2400270
- Math proficiency
- 13% ▼ -19.00%
- Reading proficiency
- 29% ▼ -13.00%
- Median HH income
- $90,389
- Composite
- 22.54/100
- National rank
- #8087
- State rank
- #14 of 24 in MD
Livability — Dahlgren Center
- Score
- 53/100
- State rank
- #531
- US rank
- #24335
Category grades
Schools grade is shown separately in the Schools card above.
Census & demographics
- City population
- 658
- Population (ZIP)
- 3,121
Population outlook (Charles County) Hauer SSP2
- Today (2025)
- 176,616 people
- By 2030
- 186,471 · +5.6%
- By 2040
- 206,472 · +16.9%
- By 2050
- 224,883 · +27.3%
- By 2075
- 272,101 · +54.1%
- By 2100
- 303,564 · +71.9%
Race, ethnicity, and origin ACS 2023
- Neighborhood character
- Predominantly White (67%)
- Race & ethnicity
- White 67% Hispanic / Latino 14% Black 14% Two or more races 6% Native American 4%
- Hispanic origin (detail)
- Mexican 11% Salvadoran 1%
- Common ancestry
- Romanian 2% Slovak 2% Portuguese 1%
- Foreign-born
- 5% · Canada
- Languages at home
- 93% English-only · Spanish 6% Chinese 1%
Political lean MEDSL · Charles
- 2024 margin
- Solid D (+40.7) · D 69.2% · R 28.5% · Other 2.2%
- 2008→2024 swing
- +15.2pp toward D · 2008: 25.5pp · 2024: 40.7pp
- All cycles
- 2024: D+40.7 2020: D+40.9 2016: D+30.2 2012: D+31.3 2008: D+25.5
Not yet ingested
- Civics
- —
Market trends
- HPI YoY
- ▼ -7.20%
- Current HPI
- 261.9526
- Rent YoY
- —
- Metro
- —
- State GDP YoY
- ▲ 2.40%
- F500 in state
- 50
Industry mix (Fortune 500 HQ in VA)
| Industry | F500 HQs | Revenue |
|---|---|---|
| Aerospace / Defense | 4 | $236B |
|
||
| Technology / Defense | 3 | $32B |
|
||
| Financial Services | 2 | $176B |
|
||
| Utilities | 2 | $27B |
|
||
| Insurance | 2 | $25B |
|
||
| Technology | 2 | $15B |
|
||
Price history
+219.6% since first listed15 events — show timeline
- 2026-03-13 Listing Removed — BRIGHT MLS
- 2026-02-28 Listed $79,900 BRIGHT MLS
- 2026-02-16 Listed $79,900 BRIGHT MLS
- 2025-12-31 Listing Removed — BRIGHT MLS
- 2025-02-10 Listed $79,900 BRIGHT MLS
- 2024-12-31 Listing Removed — BRIGHT MLS
- 2024-04-25 Listed $80,000 BRIGHT MLS
- 2023-12-31 Listing Removed — BRIGHT MLS
- 2023-03-01 Relisted — BRIGHT MLS
- 2023-02-28 Listing Removed — BRIGHT MLS
- 2022-06-06 Relisted — BRIGHT MLS
- 2022-06-01 Listing Removed — BRIGHT MLS
- 2022-02-17 Listed $65,000 BRIGHT MLS
- 2010-10-15 Sold (Public Records) $25,000 Public Records
- 2010-09-29 Sold (Public Records) $25,000 Public Records
Property tax history
-0.2%/yrLatest (2025): $1,543 · +5.2% YoY. Source: county tax records.
Cash-flow waterfall
monthlySold comps — $/sqft
last 12 mo · ≤1 miLoading sold comps…