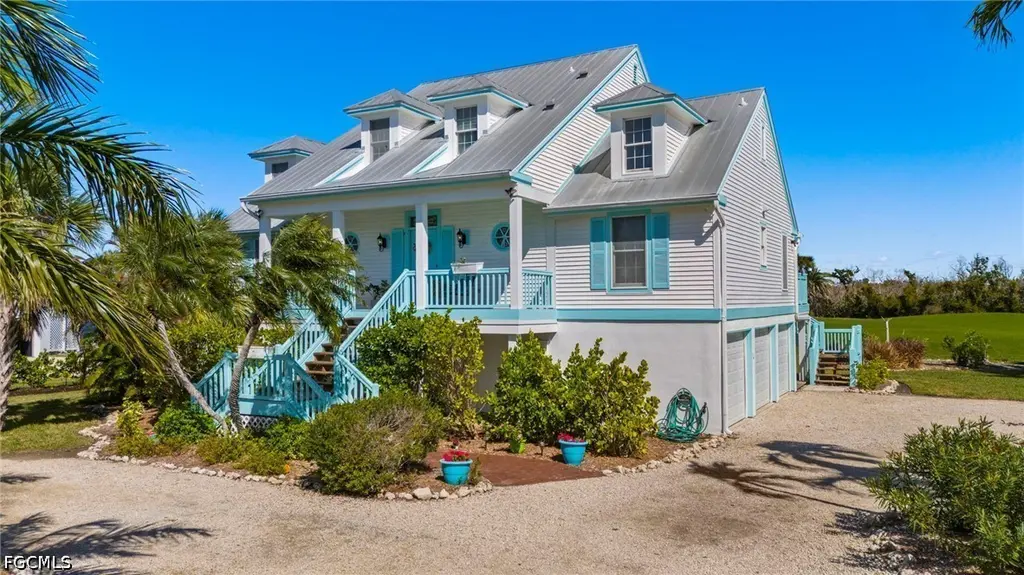
1425 Causey Ct · Sanibel, FL
Flood risk 10/10 · Severe
- FEMA flood zone
- AE
- Chance of flooding over 30 yrs
- 0.99%
- Est. flood insurance / yr
- $1,737 – $8,500
Fire risk 3/10 · Minor
- Est. fire insurance / yr
- $947 – $1,759
Heat risk 10/10 · Severe
- Hot days now (above 113°F)
- 7 days/yr
- Hot days in 30 yrs
- 26 days/yr
Wind risk 10/10 · Severe
- Chance of severe wind over 30 yrs
- 99.0%
Air-quality risk 2/10 · Minimal
- Unhealthy air days now
- 1 days/yr
- Unhealthy air days in 30 yrs
- 1 days/yr
Risk factors via First Street. Map © Google.
Why this score? — see what drove the B- grade
The composite is a weighted blend of 9 inputs, each scored 0–100. Each bar is that input's sub-score; the figure is the points it added to the 100-point composite (weight × sub-score).
- Cash flow +30.0/30.0
- DSCR +10.0/10.0
- 1% rule +8.9/10.0
- ARV discount +7.5/15.0
- Schools +4.1/10.0
- Livability +3.4/5.0
- Rent growth +2.5/5.0
- Condition / age +2.5/5.0
- Appreciation +0.0/10.0
$899,000
🖨 Deal sheet 📄 Offer letter ✓ Due diligence
Listing remarks
Nestled on a charming street in the Dunes, this impeccably maintained residence boasts not only enchanting curb appeal but also breathtaking 180-degree views of the golf course and lake. Featuring four bedrooms and three bathrooms, the home includes bonus space that can serve as a home office, additional sleeping quarters, or a playroom. The recently renovated kitchen showcases an open concept, highlighted by a generous island, quartz countertops, and stainless-steel appliances. The seamless flow of the living space extends to an outdoor porch overlooking the expansive golf course and serene lake. The primary suite, situated on the first floor, occupies an entire side of the home, and inclu
Key facts
- Generous island
- Open concept
- Lake
Tags
Property features AI
Finance
- Financial info: Pets allowed
- HOA & community: Homeowners association (annual fee $275); Association covers management, golf, legal/accounting, recreation facilities; Community amenities include beach access/rights, clubhouse, golf course, putting greens, pool, restaurant, tennis courts, management; Community features: golf, non-gated, tennis courts
Exterior
- Parking: Attached garage with 3 spaces; Circular driveway; Driveway; Garage door opener; Unpaved parking areas
- Security: Smoke detector(s)
- Utilities: Public water; Public sewer; Cable available
- Home design: 2-story property; Resale condition; Faces southwest; Exposures to northeast; Raised foundation with pillar/post/pier
- Construction: Metal roof; Stucco, vinyl siding, and wood frame construction
- Exterior features: Deck; Lanai (open, screened); Porch; Room for pool; Sprinkler/irrigation (municipal); Security/high impact doors; Community pool; Has view; Sprinklers automatic
Interior
- Kitchen: Built-In Oven; Electric Cooktop; Microwave; Dishwasher; Disposal; Icemaker; Refrigerator; Refrigerator with Ice Maker
- Bedrooms: Bedroom on main level
- Flooring: Carpet; Tile; Wood
- Bathrooms: 3 full bathrooms
- Heating & cooling: Central heating (electric, zoned); Central air conditioning (electric, zoned); Ceiling fans
- Interior features: Breakfast bar; Built-in features; Entrance foyer; Eat-in kitchen; Kitchen island; Pantry; Dual sinks; Shower only; Separate shower; Cable TV; Home office
- Laundry & utility: Washer; Dryer; Laundry inside
Neighborhood map
What this means for you Summary
Snapshot
- This is a 3-bed/3.0-bath single-family listed at $899k.
Deal economics
- At list price, monthly cash flow is $3k ($39k/yr) — positive.
- The deal already cash-flows at list — no discount required.
- Meets the 1% rule at list price ($12k rent vs $899k).
- Cap rate 11.2% vs local median 3.8% in Sanibel — top-decile yield for the area; either an underpriced asset or a hidden risk that comps aren't pricing in. Stress-test before assuming the spread holds.
Location & tenants
- Location reads 67/100 on livability (#541 in FL) — a middle-class / working-renter tenant base. Strengths: schools A+, crime A+, employment A+; Watch: housing D+, amenities F, commute F.
- Lee (suburban): math 47% / reading 50% proficiency, ranked #42 of 73 in FL (top 58%) — families likely to look elsewhere, expect single-tenant / working-renter base with shorter leases.
- Market conditions: 526 active listings in the ZIP; 4 comparable units currently listed for rent nearby; rentals at typical pace (median 24d on market — plan ~3-4 weeks tenant-placement turnaround); 15,411 units permitted in Lee County in 2024 (4,686 in 5+ unit buildings).
Forward outlook
- Local home prices are declining (-3.0%/yr); year-one equity from $6k of loan paydown is wiped out by about $27k of value loss. Plan a longer hold.
- Lee County population projected at +44% by 2050 — long-run rental-demand tailwind backs the buy-and-hold thesis.
- At projected returns (-3.0% appreciation + 3.0% rent growth), your $252k cash investment doubles in ~8 years — after that, you're playing with house money.
Negotiation context
- Only 5 days on market — expect competitive offers; lowballing is unlikely to land.
- 6 sale attempts since 9y ago; this cycle's ask has dropped $300k (25%) from the opening price — seller is motivated, your offer sets the floor, not the list.
- Current owner paid $660k; 36% above their basis — modest negotiation headroom, anchor on the comps not their cost.
Risks & watch-outs
- Watch-outs: flood insurance adds $427/mo.
- Climate carrying-cost: in FEMA flood zone AE (mandatory federal flood insurance); severe wind risk, 99% chance of damaging wind over 30y; extreme-heat days projected 7→26/yr by 2055 (HVAC capex compounding) — expect insurance premiums to compound above CPI over the hold.
Questions for the listing agent
- What's the actual annual flood-insurance premium (NFIP or private), and is the property in a SFHA with mandatory coverage?
- What does the HOA fee cover, when was the last increase, and are there any pending special assessments or reserve-fund shortfalls?
- Is there a deadline driving the sale (1031 exchange, divorce, estate, relocation)? That informs how much negotiation room exists.
- Schools are A-rated — typically a magnet for longer-tenancy family renters. What's the average tenant stay here, and is there a school-zone premium baked into asking?
- What's the average days-on-market for RENTAL listings here right now (not sales)? A rising rental-DOM trend means longer vacancies and softer asking-rent achievability than the comps imply.
- What's the recent tenant-quality profile in this submarket — average credit score on applications, eviction rate, late-payment / NSF rate, and stable-employment percentage? A property-management company in the area should have these aggregated.
- How much new for-sale + rental construction is in the pipeline within 1–3 miles? Heavy new supply typically softens prices + rents 12–24 months out; constrained supply supports both.
Investment metrics
- 1% rule
- 1.39% ✓
- Cap rate
- 11.19%
- Cash-on-cash
- 17.48%
- DSCR
- 1.78
- GRM
- 6.0
CMA / ARV
- ARV (on-the-fly)
- $2,935,412
- Comps found
- 1
Show comp detail 1 sale within ~0.75 mi
| Address | Dist | Beds/Ba | Sqft | Sold | Price | $/sf | Match |
|---|---|---|---|---|---|---|---|
| 1212 Isabel Dr | 0.32mi | 3/3.0 | 2,354 (+1%) | 4mo | $2,970,000 | $1,262 | 80 |
Match score weights: distance 35% · size 25% · config 20% · recency 20%. Top-matched comps best support the ARV.
Projected returns pro-forma
-3.0% appreciation · 3.0% rent growth · sell at horizon
- IRR
- 6.2%
- Equity multiple
- 1.24×
- Total profit
- $61,065
- Equity at exit
- $134,044
- IRR
- 15.6%
- Equity multiple
- 2.27×
- Total profit
- $320,570
- Equity at exit
- $77,729
Cash invested: $251,720 (down + closing). Projections, not guarantees.
Landlord ↔ Tenant lean methodology
- Overall (STATE)
- 87 Strongly Landlord-Friendly
- State Florida
- 87 Strongly Landlord-Friendly · R+3
- County
- — inherits STATE
- City
- — inherits STATE
ZIP-level market 33957
- Home prices YoY
- -15.7%
- Active inventory
- 526
- Price-to-rent
- 6.0×
Monthly cashflow live
- Estimated rent
- $12,455 medium interval (Pro) →
- Mortgage (P&I)
- −$4,714
- Tax from tax record
- −$1,062 /mo · $12,738/yr
- Insurance
- −$375
- Flood insurance flood zone
- −$427 /mo · $5,118/yr
- HOA
- −$23
- Vacancy / Maint / Mgmt
- −$2,616
- Net cashflow
- $3,239
Break-even live
UW: 25.0% down · 7.5% · 30yr · 1.5% tax · 5.0% vac · 8.0% maint · 8.0% mgmt
Financing live
Cash to close
- Down payment
- $224,750
- Closing costs
- $26,970
- Reserves months
- —
- Total cash needed
- —
Loan-product check · same deal, 3 products live
Conventional
25% down · 7.5% · 30yr
- Down + closing
- —
- Monthly P&I
- —
- Monthly cashflow
- —
- DSCR
- —
- Eligible?
- —
Personal DTI + credit; lowest rate.
DSCR
20% down · 8.5% · 30yr
- Down + closing
- —
- Monthly P&I
- —
- Monthly cashflow
- —
- DSCR
- —
- Eligible?
- —
No personal income docs; deal must DSCR.
Hard money
10% down · 12.0% · 12mo
- Down + closing
- —
- Monthly P&I
- —
- Monthly cashflow
- —
- DSCR
- —
- Eligible?
- —
Short-term bridge; refi at stabilization.
Rent comps 4 comps
| Address | Beds | Baths | Sqft | Rent | $/sqft | DOM | Units | Dist |
|---|---|---|---|---|---|---|---|---|
| 1666 Sabal Palm Dr Sanibel, FL | 2.0 | 2.5 | 1715 | $3,500 | $2.04 | 23d | 1 | 0.44mi |
| 1679 Serenity Ln Unit 1323695P Sanibel, FL | 3.0 | 2.0 | 1646 | $7,115 | $4.32 | 16d | 1 | 1.12mi |
| 702 Anchor Dr Sanibel, FL | 4.0 | 3.0 | 3100 | $6,000 | $1.94 | 23d | 1 | 1.34mi |
| 1111 Schooner Pl Sanibel, FL | 4.0 | 3.0 | 3073 | $19,000 | $6.18 | 23d | 1 | 1.47mi |
HOA detail
- Monthly dues
- $23 · $276/yr
Listing history 26 events
-
2026-06-10status $899,000 Pending 5 DOM
-
2026-06-09days on market $899,000 Active 5 DOM
-
2026-06-08days on market $899,000 Active 4 DOM
-
2026-06-07days on market $899,000 Active 3 DOM
-
2026-06-01days on market $899,000 Active 227 DOM
-
2026-04-09price $899,000
-
2025-12-01price $999,000
-
2025-10-15$1,199,000 Active
-
2025-04-30historical
-
2024-10-28$1,199,000 Active
-
2024-06-30historical
-
2024-01-02$1,295,000 Active
-
2023-06-09historical
-
2023-04-24$1,395,000 Active
-
2018-04-02soldstatus $660,000
-
2018-03-30soldstatus $660,000 Sold
-
2018-02-12status Pending
-
2018-01-26status Pending With Contingencies
-
2018-01-17price $729,000
-
2017-12-13$779,000 Active
-
2017-06-16historical
-
2017-03-29price $779,000
-
2017-03-15$799,000 Active
-
2001-09-11soldstatus $642,500
-
1986-01-01soldstatus $258,000
-
1984-05-01soldstatus $75,000
ⓘ Source: listings_history table (triggers on properties + properties_extension) + one-shot
backfill from property_details.listing_events for pre-trigger history.
Tax reassessment forecast FL · Resets to sale price
- Current annual tax
- $12,738 · $1,062/mo
- Projected year-2 tax
- $12,738 · $1,062/mo
- Expected delta
- $0/yr ($0/mo · 0.0%)
ⓘ Screening estimate from a state-policy table — verify with the county assessor before closing.
Climate risk First Street
- Flood 10/10 Extreme FEMA zone AE · 99% chance over 30 yrs
- Wildfire 3/10 Moderate
- Heat 10/10 Extreme 7 d/yr ≥113°F today · 26 d/yr by 30 yrs out
- Wind 10/10 Extreme 99% chance of damaging wind over 30 yrs
- Air quality 2/10 Low 1 unhealthy d/yr today · 1 by 30 yrs out
Nearby sold comps map
Loading sold comps map…
Walkable amenities ~0.75 mi
Loading nearby amenities…
Taxation est. · year 1
- Rental income
- $149,460
- − Mortgage interest
- −$50,358
- − Property taxes
- −$12,738
- − Insurance
- −$9,614
- − Repairs & maintenance
- −$11,957
- − Management
- −$11,957
- − HOA
- −$276
- − Depreciation
- −$26,153
- Taxable income
- $26,408
- Est. tax owed @ 24.0%
- −$6,338
- After-tax cash flow
- $32,534/yr
For passive investors: Depreciation is non-cash, so a rental often shows a tax loss while cash-flowing — sheltering income. Rental losses are passive: they offset passive income freely, and up to $25,000/yr can offset ordinary (W-2) income if you actively participate and your MAGI is under $100k (phasing out to $0 by $150k); unused losses carry forward. On sale, claimed depreciation is recaptured at up to 25%, and gains may owe capital-gains tax (a 1031 exchange can defer both). Figures are a year-1 estimate at your 24.0% rate — not tax advice; consult a CPA.
Schools (NCES district)
- District
- Lee
- NCES district ID
- 1201080
- Math proficiency
- 47% ▼ -11.00%
- Reading proficiency
- 50% ▼ -4.00%
- Median HH income
- $49,518
- Composite
- 41.49/100
- National rank
- #3458
- State rank
- #42 of 73 in FL
Livability — Sanibel
- Score
- 67/100
- State rank
- #541
- US rank
- #10166
Category grades
Schools grade is shown separately in the Schools card above.
Census & demographics
- Census place
- Sanibel, FL
- City population
- 6,402
- Population (ZIP)
- 6,402
Population outlook (Lee County) Hauer SSP2
- Today (2025)
- 871,946 people
- By 2030
- 955,468 · +9.6%
- By 2040
- 1,113,587 · +27.7%
- By 2050
- 1,256,891 · +44.1%
- By 2075
- 1,560,270 · +78.9%
- By 2100
- 1,726,848 · +98.0%
Race, ethnicity, and origin ACS 2023
- Neighborhood character
- Predominantly White (95%)
- Race & ethnicity
- White 95% Two or more races 2% Asian 1%
- Common ancestry
- Italian 4% Romanian 4% Slovak 2%
- Foreign-born
- 5% · Canada, China
- Languages at home
- 96% English-only · German/W. Germanic 1% Spanish 1% French/Haitian/Cajun 1%
Political lean MEDSL · Lee
- 2024 margin
- Strong R (+28.4) · D 35.5% · R 63.9%
- 2008→2024 swing
- -18.0pp toward R · 2008: -10.4pp · 2024: -28.4pp
- All cycles
- 2024: R+28.4 2020: R+19.2 2016: R+20.4 2012: R+16.6 2008: R+10.4
Not yet ingested
- Civics
- —
Market trends
- HPI YoY
- ▼ -93.08%
- Current HPI
- 501.0
- Rent YoY
- —
- Metro
- —
- State GDP YoY
- ▲ 3.28%
- F500 in state
- 36
Industry mix (Fortune 500 HQ in FL)
| Industry | F500 HQs | Revenue |
|---|---|---|
| Industrial Technology | 2 | $29B |
|
||
| Insurance | 2 | $17B |
|
||
| Retail | 1 | $60B |
|
||
| Technology Distribution | 1 | $58B |
|
||
| Homebuilding | 1 | $35B |
|
||
| Technology Manufacturing | 1 | $35B |
|
||
Price history
+1098.7% since first listed21 events — show timeline
- 2026-04-09 Price Changed $899,000 FORTMLS
- 2025-12-01 Price Changed $999,000 FORTMLS
- 2025-10-15 Listed $1,199,000 FORTMLS
- 2025-04-30 Listing Removed — FORTMLS
- 2024-10-28 Listed $1,199,000 FORTMLS
- 2024-06-30 Listing Removed — FORTMLS
- 2024-01-02 Listed $1,295,000 FORTMLS
- 2023-06-09 Listing Removed — FORTMLS
- 2023-04-24 Listed $1,395,000 FORTMLS
- 2018-04-02 Sold (Public Records) $660,000 Public Records
- 2018-03-30 Sold (MLS) $660,000 FORTMLS
- 2018-02-12 Pending — FORTMLS
- 2018-01-26 Pending — FORTMLS
- 2018-01-17 Price Changed $729,000 FORTMLS
- 2017-12-13 Listed $779,000 FORTMLS
- 2017-06-16 Listing Removed — FORTMLS
- 2017-03-29 Price Changed $779,000 FORTMLS
- 2017-03-15 Listed $799,000 FORTMLS
- 2001-09-11 Sold (Public Records) $642,500 Public Records
- 1986-01-01 Sold (Public Records) $258,000 Public Records
- 1984-05-01 Sold (Public Records) $75,000 Public Records
Property tax history
+6.7%/yrLatest (2025): $12,738 · +3.1% YoY. Source: county tax records.
Cash-flow waterfall
monthlySold comps — $/sqft
last 12 mo · ≤1 miLoading sold comps…