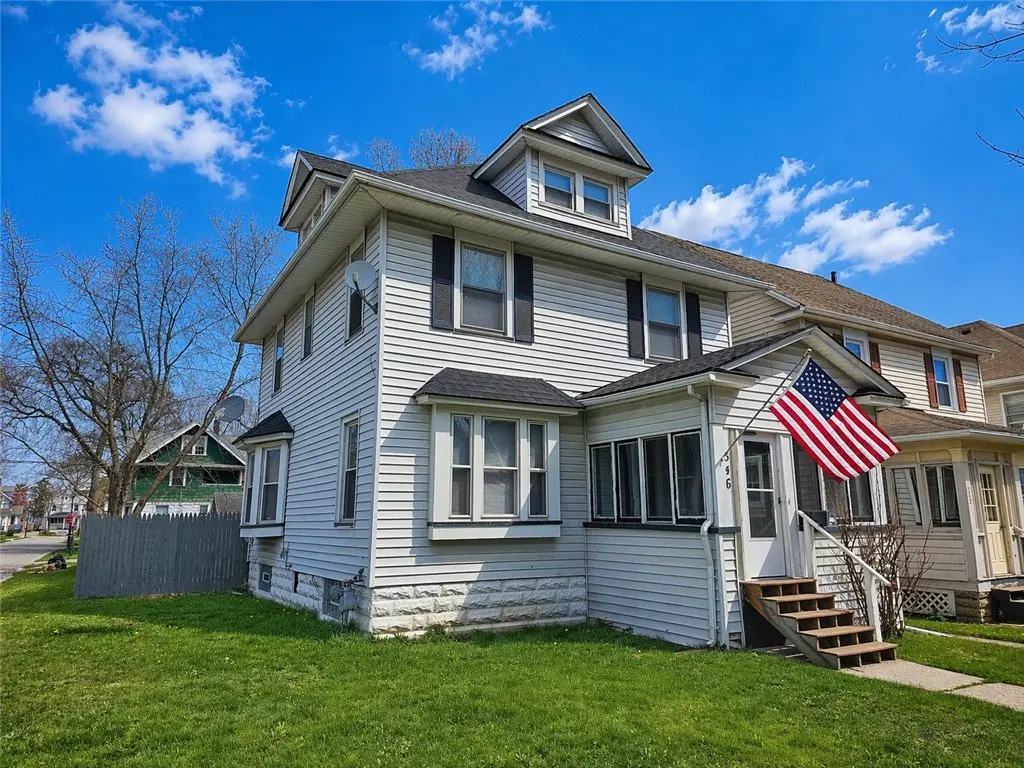
546 Magee Ave · Rochester, NY
Flood risk 1/10 · Minimal
- FEMA flood zone
- X (unshaded)
- Chance of flooding over 30 yrs
- 0.0%
- Est. flood insurance / yr
- $473 – $860
Fire risk 4/10 · Minor
- Est. fire insurance / yr
- $691 – $1,283
Heat risk 2/10 · Minimal
- Hot days now (above 96°F)
- 7 days/yr
- Hot days in 30 yrs
- 15 days/yr
Wind risk 1/10 · Minimal
- Chance of severe wind over 30 yrs
- —
Air-quality risk 2/10 · Minimal
- Unhealthy air days now
- 1 days/yr
- Unhealthy air days in 30 yrs
- 2 days/yr
Risk factors via First Street. Map © Google.
Why this score? — see what drove the B+ grade
The composite is a weighted blend of 9 inputs, each scored 0–100. Each bar is that input's sub-score; the figure is the points it added to the 100-point composite (weight × sub-score).
- Cash flow +30.0/30.0
- ARV discount +15.0/15.0
- 1% rule +10.0/10.0
- DSCR +10.0/10.0
- Livability +3.8/5.0
- Rent growth +2.5/5.0
- Condition / age +2.5/5.0
- Appreciation +2.2/10.0
- Schools +1.9/10.0
$110,000
🖨 Deal sheet 📄 Offer letter ✓ Due diligence
Listing remarks MLS
A HOME TO BEHOLD! This 4/5BR colonial has vinyl siding and a fully fenced(privacy) yard! Special features include: large enclosed front porch, GIGANTIC foyer, 9' ceilings, all appliances, remodeled bath w/ fiberglass tub & marble floor, hardwood floors, finished attic, BRAND NEW tear off roof, 150 amp. electric service, central air conditioning, & a STUNNING beamed ceiling in the formal dining room! You'd better hurry because MAPLEWOOD IS HOT RIGHT NOW!!!!
Key facts
- Expansive foyer
- Formal dining room
- Soaring ceilings
Tags
Neighborhood map
What this means for you Summary
Snapshot
- This is a 5-bed/1.0-bath single-family listed at $110k.
Deal economics
- At list price, monthly cash flow is $671 ($8k/yr) — positive.
- The deal already cash-flows at list — no discount required.
- Meets the 1% rule at list price ($2k rent vs $110k).
- Recommended offer: $107k (3.0% below list) — sets the bar for market timing.
- Cap rate 13.6% vs local median 9.3% in Rochester — top-decile yield for the area; either an underpriced asset or a hidden risk that comps aren't pricing in. Stress-test before assuming the spread holds.
Location & tenants
- Location reads 76/100 on livability (#222 in NY, #3,482 nationally) — a middle-class / working-renter tenant base. Strengths: commute A+, cost of living A+, housing A+; Watch: schools D+, crime F, employment F.
- Rochester City School District (urban): math 21% / reading 26% proficiency, ranked #589 of 590 in NY (top 100%) — low school quality limits family demand, transient renter base, plan for 1-2y turnover; 82% free/reduced lunch — lower-income household profile, screen leases tightly.
- Market conditions: 71 active listings in the ZIP; 1,169 units permitted in Monroe County in 2024 (591 in 5+ unit buildings).
Forward outlook
- Local home prices are declining (-3.0%/yr); year-one equity from $761 of loan paydown is wiped out by about $3k of value loss. Plan a longer hold.
- Monroe County population projected to shrink 6% by 2050 — rents likely to lag national; underwrite the cash flow, not the appreciation.
- At projected returns (-3.0% appreciation + 3.0% rent growth), your $31k cash investment doubles in ~5 years — after that, you're playing with house money.
Negotiation context
- It's been on market 44 days — a 3% lower offer ($107k) is reasonable based on typical stale-listing flexibility.
- 4 sale attempts since 13y ago with the ask held roughly flat each time — persistent listings suggest the price (not the market) is what's stuck; bring a comps-based counter.
- Current owner paid $61k; list at $110k implies a 80% gain — meaningful room to come down on a strong offer.
Risks & watch-outs
- Watch-outs: built in 1920 — expect roof / HVAC / electrical / plumbing capex.
Questions for the listing agent
- It's been on market 44 days. Have you received any prior offers? Is the seller open to a 3% concession, seller financing, or rate buy-down credit?
- Built in 1920 — when were the roof, HVAC, electrical panel, plumbing, and water heater last replaced?
- Is there a deadline driving the sale (1031 exchange, divorce, estate, relocation)? That informs how much negotiation room exists.
- Schools are D-rated, which usually means shorter tenancies and higher turnover. Who's the typical renter profile here, and what's been the actual vacancy rate?
- Crime grade is F in this area — have there been break-ins, vandalism, or insurance claims at this property in the last 3 years? What carrier currently insures it and at what premium?
- What's the average days-on-market for RENTAL listings here right now (not sales)? A rising rental-DOM trend means longer vacancies and softer asking-rent achievability than the comps imply.
- What's the recent tenant-quality profile in this submarket — average credit score on applications, eviction rate, late-payment / NSF rate, and stable-employment percentage? A property-management company in the area should have these aggregated.
- How much new for-sale + rental construction is in the pipeline within 1–3 miles? Heavy new supply typically softens prices + rents 12–24 months out; constrained supply supports both.
Investment metrics
- 1% rule
- 1.59% ✓
- Cap rate
- 13.61%
- Cash-on-cash
- 26.14%
- DSCR
- 2.16
- GRM
- 5.2
CMA / ARV
- ARV (on-the-fly)
- $213,408
- Comps found
- 12
Show comp detail 12 sales within ~0.75 mi
| Address | Dist | Beds/Ba | Sqft | Sold | Price | $/sf | Match |
|---|---|---|---|---|---|---|---|
| 377 Electric Ave | 0.05mi | 4/1.5 (-1) | 1,805 (-1%) | 7mo | $195,000 | $108 | 83 |
| 416 Augustine St | 0.30mi | 4/2.0 (-1) | 1,764 (-3%) | 1mo | $202,000 | $115 | 71 |
| 551 Magee Ave | 0.03mi | 4/1.5 (-1) | 1,572 (-14%) | 3mo | $166,500 | $106 | 66 |
| 505 Augustine St | 0.29mi | 4/1.0 (-1) | 1,678 (-8%) | 3mo | $160,000 | $95 | 66 |
| 205 Albemarle St | 0.48mi | 4/1.0 (-1) | 1,780 (-2%) | 6mo | $175,000 | $98 | 64 |
| 297 Knickerbocker Ave | 0.30mi | 4/1.5 (-1) | 1,618 (-11%) | 1mo | $202,500 | $125 | 59 |
| 200 Albemarle St | 0.48mi | 5/2.0 | 1,672 (-8%) | 2mo | $195,000 | $117 | 58 |
| 285 Magee Ave | 0.37mi | 4/1.5 (-1) | 1,620 (-11%) | 6mo | $80,000 | $49 | 52 |
| 135 Albemarle St | 0.58mi | 4/2.0 (-1) | 1,732 (-5%) | 4mo | $205,000 | $118 | 52 |
| 361 Augustine St | 0.36mi | 4/2.0 (-1) | 1,638 (-10%) | 6mo | $200,000 | $122 | 52 |
| 534 Ramona St | 0.27mi | 4/2.0 (-1) | 1,575 (-14%) | 6mo | $185,000 | $117 | 50 |
| 53 Holmes St | 0.68mi | 4/1.5 (-1) | 1,550 (-15%) | 7mo | $190,000 | $123 | 30 |
Match score weights: distance 35% · size 25% · config 20% · recency 20%. Top-matched comps best support the ARV.
Projected returns pro-forma
-3.0% appreciation · 3.0% rent growth · sell at horizon
- IRR
- 19.9%
- Equity multiple
- 1.81×
- Total profit
- $24,907
- Equity at exit
- $16,401
- IRR
- 28.1%
- Equity multiple
- 3.49×
- Total profit
- $76,709
- Equity at exit
- $9,511
Cash invested: $30,800 (down + closing). Projections, not guarantees.
Landlord ↔ Tenant lean methodology
- Overall (STATE)
- 15 Strongly Tenant-Friendly
- State New York
- 15 Strongly Tenant-Friendly · D+10
- County
- — inherits STATE
- City
- — inherits STATE
ZIP-level market 14613
- Home prices YoY
- -2.0%
- Active inventory
- 71
- Price-to-rent
- 5.2×
Monthly cashflow live
- Estimated rent
- $1,754 medium interval (Pro) →
- Mortgage (P&I)
- −$577
- Tax from tax record
- −$92 /mo · $1,107/yr
- Insurance
- −$46
- HOA
- −$0
- Vacancy / Maint / Mgmt
- −$368
- Net cashflow
- $671
Break-even live
UW: 25.0% down · 7.5% · 30yr · 1.5% tax · 5.0% vac · 8.0% maint · 8.0% mgmt
Financing live
Cash to close
- Down payment
- $27,500
- Closing costs
- $3,300
- Reserves months
- —
- Total cash needed
- —
Loan-product check · same deal, 3 products live
Conventional
25% down · 7.5% · 30yr
- Down + closing
- —
- Monthly P&I
- —
- Monthly cashflow
- —
- DSCR
- —
- Eligible?
- —
Personal DTI + credit; lowest rate.
DSCR
20% down · 8.5% · 30yr
- Down + closing
- —
- Monthly P&I
- —
- Monthly cashflow
- —
- DSCR
- —
- Eligible?
- —
No personal income docs; deal must DSCR.
Hard money
10% down · 12.0% · 12mo
- Down + closing
- —
- Monthly P&I
- —
- Monthly cashflow
- —
- DSCR
- —
- Eligible?
- —
Short-term bridge; refi at stabilization.
Listing history 10 events
-
2026-04-22historical Active Under Contract
-
2026-04-15$110,000 Active
-
2018-02-08soldstatus $61,000
-
2018-02-07soldstatus $61,000 Closed Sale or Rented 471-char remark
Show marketing remark (471 chars)
A HOME TO BEHOLD! This 4/5BR colonial has vinyl siding and a fully fenced(privacy) yard! Special features include: large enclosed front porch, GIGANTIC foyer, 9' ceilings, all appliances, remodeled bath w/ fiberglass tub & marble floor, hardwood floors, finished attic, BRAND NEW tear off roof, 150 amp. electric service, central air conditioning, & a STUNNING beamed ceiling in the formal dining room! You'd better hurry because MAPLEWOOD IS HOT RIGHT NOW!!!!
-
2017-12-04status Pending Sale 471-char remark
Show marketing remark (471 chars)
A HOME TO BEHOLD! This 4/5BR colonial has vinyl siding and a fully fenced(privacy) yard! Special features include: large enclosed front porch, GIGANTIC foyer, 9' ceilings, all appliances, remodeled bath w/ fiberglass tub & marble floor, hardwood floors, finished attic, BRAND NEW tear off roof, 150 amp. electric service, central air conditioning, & a STUNNING beamed ceiling in the formal dining room! You'd better hurry because MAPLEWOOD IS HOT RIGHT NOW!!!!
-
2017-11-18$64,900 Active 471-char remark
Show marketing remark (471 chars)
A HOME TO BEHOLD! This 4/5BR colonial has vinyl siding and a fully fenced(privacy) yard! Special features include: large enclosed front porch, GIGANTIC foyer, 9' ceilings, all appliances, remodeled bath w/ fiberglass tub & marble floor, hardwood floors, finished attic, BRAND NEW tear off roof, 150 amp. electric service, central air conditioning, & a STUNNING beamed ceiling in the formal dining room! You'd better hurry because MAPLEWOOD IS HOT RIGHT NOW!!!!
-
2013-05-24$59,900
-
2013-01-17$59,900
-
2005-06-24soldstatus $65,700
-
2002-02-21soldstatus $57,000
ⓘ Source: listings_history table (triggers on properties + properties_extension) + one-shot
backfill from property_details.listing_events for pre-trigger history.
Tax reassessment forecast NY · Partial reset (capped growth)
- Current annual tax
- $1,107 · $92/mo
- Projected year-2 tax
- $1,483 · $124/mo
- Expected delta
- +$376/yr (+$31/mo · 34.0%)
ⓘ Screening estimate from a state-policy table — verify with the county assessor before closing.
Climate risk First Street
- Flood 1/10 Low FEMA zone X (unshaded) · 0% chance over 30 yrs
- Wildfire 4/10 Moderate
- Heat 2/10 Low 7 d/yr ≥96°F today · 15 d/yr by 30 yrs out
- Wind 1/10 Low
- Air quality 2/10 Low 1 unhealthy d/yr today · 2 by 30 yrs out
Nearby sold comps map
Loading sold comps map…
Walkable amenities ~0.75 mi
Loading nearby amenities…
Taxation est. · year 1
- Rental income
- $21,052
- − Mortgage interest
- −$6,162
- − Property taxes
- −$1,107
- − Insurance
- −$550
- − Repairs & maintenance
- −$1,684
- − Management
- −$1,684
- − Depreciation
- −$3,200
- Taxable income
- $6,664
- Est. tax owed @ 24.0%
- −$1,599
- After-tax cash flow
- $6,452/yr
For passive investors: Depreciation is non-cash, so a rental often shows a tax loss while cash-flowing — sheltering income. Rental losses are passive: they offset passive income freely, and up to $25,000/yr can offset ordinary (W-2) income if you actively participate and your MAGI is under $100k (phasing out to $0 by $150k); unused losses carry forward. On sale, claimed depreciation is recaptured at up to 25%, and gains may owe capital-gains tax (a 1031 exchange can defer both). Figures are a year-1 estimate at your 24.0% rate — not tax advice; consult a CPA.
Schools (NCES district)
- District
- Rochester City School District
- NCES district ID
- 3624750
- Math proficiency
- 21% ▬ 0.00%
- Reading proficiency
- 26% ▲ 4.00%
- Median HH income
- $30,923
- Composite
- 18.98/100
- National rank
- #8850
- State rank
- #589 of 590 in NY
Livability — Rochester
- Score
- 76/100
- State rank
- #222
- US rank
- #3482
Category grades
Schools grade is shown separately in the Schools card above.
Census & demographics
- Census place
- Rochester, NY
- City population
- 432,803
- Population (ZIP)
- 14,740
Population outlook (Monroe County) Hauer SSP2
- Today (2025)
- 759,460 people
- By 2030
- 757,154 · -0.3%
- By 2040
- 740,644 · -2.5%
- By 2050
- 714,443 · -5.9%
- By 2075
- 645,883 · -15.0%
- By 2100
- 547,084 · -28.0%
Race, ethnicity, and origin ACS 2023
- Neighborhood character
- Highly diverse neighborhood (Simpson 0.70)
- Race & ethnicity
- Black 45% White 22% Hispanic / Latino 20% Two or more races 10% Asian 8% Pacific Islander 1%
- Hispanic origin (detail)
- Puerto Rican 16% Dominican 3%
- Common ancestry
- British 2% Serbian 1% Romanian 1%
- Foreign-born
- 13% · Canada, India, Philippines
- Languages at home
- 79% English-only · Spanish 12% Other Asian/Pacific 5% Other Indo-European 3%
Political lean MEDSL · Monroe
- 2024 margin
- D (+19.1) · D 59.5% · R 40.5%
- 2008→2024 swing
- +1.4pp toward D · 2008: 17.7pp · 2024: 19.1pp
- All cycles
- 2024: D+19.1 2020: D+21.0 2016: D+14.1 2012: D+17.4 2008: D+17.7
Not yet ingested
- Civics
- —
Market trends
- HPI YoY
- ▼ -5.56%
- Current HPI
- 274.2485
- Rent YoY
- —
- Metro
- —
- State GDP YoY
- ▲ 2.60%
- F500 in state
- 92
Industry mix (Fortune 500 HQ in NY)
| Industry | F500 HQs | Revenue |
|---|---|---|
| Financial Services | 10 | $950B |
|
||
| Consumer Goods | 9 | $162B |
|
||
| Insurance | 4 | $225B |
|
||
| Telecommunications | 2 | $144B |
|
||
| Pharmaceuticals | 2 | $112B |
|
||
| Media / Entertainment | 2 | $69B |
|
||
Price history
+93.0% since first listed10 events — show timeline
- 2026-04-22 Contingent — UNYREIS
- 2026-04-15 Listed $110,000 UNYREIS
- 2018-02-08 Sold (Public Records) $61,000 Public Records
- 2018-02-07 Sold (MLS) $61,000 UNYREIS
- 2017-12-04 Pending — UNYREIS
- 2017-11-18 Listed $64,900 UNYREIS
- 2013-05-24 Listed $59,900 UNYREIS
- 2013-01-17 Listed $59,900 UNYREIS
- 2005-06-24 Sold (Public Records) $65,700 Public Records
- 2002-02-21 Sold (Public Records) $57,000 Public Records
Property tax history
+2.2%/yrLatest (2025): $1,107 · +0.0% YoY. Source: county tax records.
Cash-flow waterfall
monthlySold comps — $/sqft
last 12 mo · ≤1 miLoading sold comps…