8 Erin Dr · Plainfield, CT
Flood risk No data
- FEMA flood zone
- —
- Chance of flooding over 30 yrs
- —
- Est. flood insurance / yr
- —
Fire risk No data
- Est. fire insurance / yr
- —
Heat risk No data
- Hot days now (above threshold)
- —
- Hot days in 30 yrs
- —
Wind risk No data
- Chance of severe wind over 30 yrs
- —
Air-quality risk No data
- Unhealthy air days now
- —
- Unhealthy air days in 30 yrs
- —
Risk factors via First Street. Map © Google.
Why this score? — see what drove the D- grade
The composite is a weighted blend of 9 inputs, each scored 0–100. Each bar is that input's sub-score; the figure is the points it added to the 100-point composite (weight × sub-score).
- ARV discount +7.5/15.0
- Cash flow +6.5/30.0
- 1% rule +6.5/10.0
- Appreciation +3.4/10.0
- Schools +2.9/10.0
- Rent growth +2.5/5.0
- Livability +2.5/5.0
- Condition / age +2.5/5.0
- DSCR +0.7/10.0
$104,000
🖨 Deal sheet 📄 Offer letter ✓ Due diligence
Listing remarks MLS
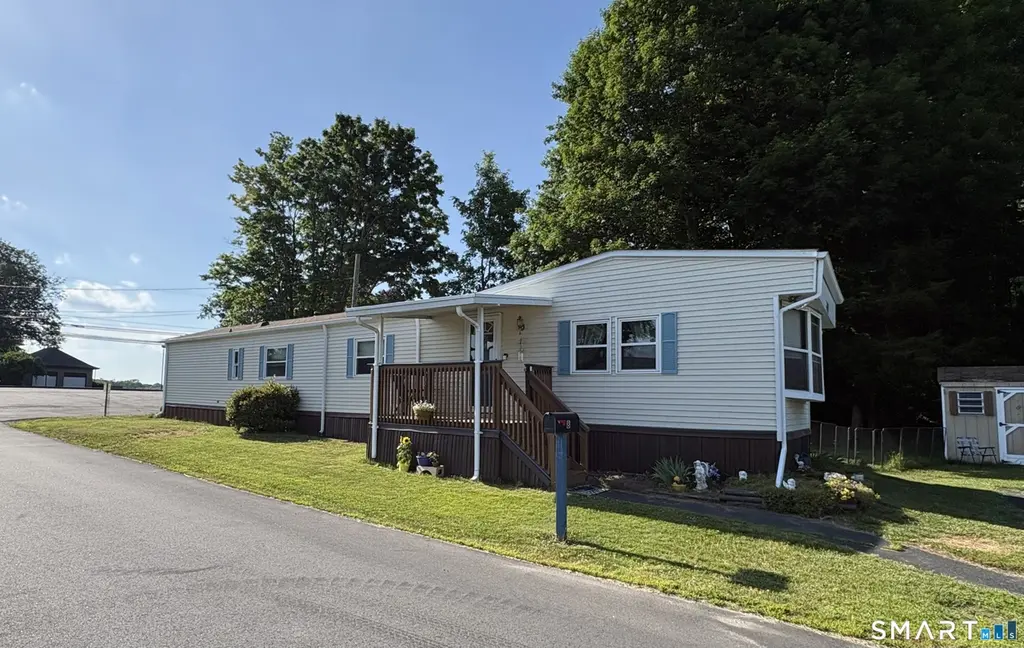
BEAUTIFUL mobile home in gorgeous mobile home park. Oversized 1040sqft, 2 bedrms, 2 FULL baths. Open floor plan with an adorable kitchen with hardwood floors, newer backsplash, corner nook and newer appliances. Large family room with lots of sunlight and vaulted ceilings. Nice size bedrms. Full bath with a walkin shower AND washer and dryer.Nice large family rm or sunroom surrounded by windows. Exterior door to your mud room. Plenty of parking in your paved driveway. Gorgeous corner lot and a shed for storage. So much to offer with Newer windows and CENTRAL AIR. Lot rent is 450 a month includes sewer, trash, road maintenance and plowing of the road. Owner is responsible for lawn, city water, and plowing of the driveway.. 1 cat and 1 dog allowed. ALl buyers must be approved by the park. WHY PAY RENT WHEN YOU CAN OWN THIS FOR LESS..ONLY 59,900.. Seller prefers a quick closing. Low taxes only 623 a year
Key facts
- 2 parking spots
- Built 1983
- Listed 5 days
Property features AI
Finance
- Other: Nearby: park and shopping/mall; Located in Windham County, Connecticut
- Financial info: Property managed by a professional off-site management company
- HOA & community: Homeowners association with monthly fee; HOA fee covers trash pickup, snow removal, and property management; Monthly HOA fee
Exterior
- Parking: Paved driveway; 2 parking spaces
- Utilities: Public water connected; Public sewer connected; Electric hot water; Natural gas for heat
- Home design: Single-family home; Located in a 55+ adult community; Prefab construction
- Construction: Aluminum siding; Asphalt shingle roof; Prefab construction; No foundation specified
- Exterior features: Level lot; Shed; Deck; Garden area; Private paved driveway
Interior
- Kitchen: Oven/Range; Refrigerator
- Bedrooms: 2 bedrooms
- Bathrooms: 1 full bathroom
- Heating & cooling: Hot air heating (natural gas); Central air conditioning
- Interior features: Central air conditioning; No basement
- Laundry & utility: Washer; Dryer; Electric hot water
Neighborhood map
What this means for you Summary
Snapshot
- This is a 2-bed/1.0-bath manufactured listed at $104k.
Deal economics
- At list price, monthly cash flow is $-178 ($-2k/yr) — negative.
- To cash-flow at today's rent, offer at most $73k (30.2% below list).
- Meets the 1% rule at list price ($1k rent vs $104k).
- Recommended offer: $73k (30.2% below list) — sets the bar for cash-flow.
Location & tenants
- Location reads: area grade D — affects rentability + tenant quality, not the cash-flow math above.
- Plainfield School District (town): math 24% / reading 41% proficiency, ranked #117 of 153 in CT (top 76%) — families likely to look elsewhere, expect single-tenant / working-renter base with shorter leases.
- Market conditions: 37 active listings in the ZIP; 1 comparable units currently listed for rent nearby; 149 units permitted in Northeastern Connecticut Planning Region in 2024 (0 in 5+ unit buildings).
Forward outlook
- Local home prices are declining (-3.0%/yr); year-one equity from $719 of loan paydown is wiped out by about $3k of value loss. Plan a longer hold.
Negotiation context
- Only 5 days on market — expect competitive offers; lowballing is unlikely to land.
- 3 sale attempts since 9y ago with the ask held roughly flat each time — persistent listings suggest the price (not the market) is what's stuck; bring a comps-based counter.
- Current owner paid $70k; 49% above their basis — modest negotiation headroom, anchor on the comps not their cost.
Risks & watch-outs
- Watch-outs: HOA is 40% of rent.
Questions for the listing agent
- What do current leases actually rent for vs. the listed asking? Can we see a recent rent roll and the last 12 months of T-12 income?
- What does the HOA fee cover, when was the last increase, and are there any pending special assessments or reserve-fund shortfalls?
- Is there a deadline driving the sale (1031 exchange, divorce, estate, relocation)? That informs how much negotiation room exists.
- The area grade is low — what's the realistic commute time and amenity access for the typical tenant pool here? Any planned neighborhood developments (good or bad) we should know about?
- What's the average days-on-market for RENTAL listings here right now (not sales)? A rising rental-DOM trend means longer vacancies and softer asking-rent achievability than the comps imply.
- What's the recent tenant-quality profile in this submarket — average credit score on applications, eviction rate, late-payment / NSF rate, and stable-employment percentage? A property-management company in the area should have these aggregated.
- How much new for-sale + rental construction is in the pipeline within 1–3 miles? Heavy new supply typically softens prices + rents 12–24 months out; constrained supply supports both.
Investment metrics
- 1% rule
- 1.15% ✓
- Cap rate
- 4.24%
- Cash-on-cash
- -7.32%
- DSCR
- 0.67
- GRM
- 7.2
CMA / ARV
No comps found within radius.
Projected returns pro-forma
-3.0% appreciation · 3.0% rent growth · sell at horizon
- IRR
- -28.6%
- Equity multiple
- 0.04×
- Total profit
- $-27,898
- Equity at exit
- $15,507
- IRR
- -26.8%
- Equity multiple
- -0.30×
- Total profit
- $-37,772
- Equity at exit
- $8,992
Cash invested: $29,120 (down + closing). Projections, not guarantees.
Landlord ↔ Tenant lean methodology
- Overall (STATE)
- 27 Tenant-Leaning
- State Connecticut
- 27 Tenant-Leaning · D+7
- County
- — inherits STATE
- City
- — inherits STATE
ZIP-level market 06374
- Home prices YoY
- -1.0%
- Active inventory
- 37
- Price-to-rent
- 7.2×
Monthly cashflow live
- Estimated rent
- $1,200 medium interval (Pro) →
- Mortgage (P&I)
- −$545
- Tax from tax record
- −$52 /mo · $623/yr
- Insurance
- −$43
- HOA
- −$485
- Vacancy / Maint / Mgmt
- −$252
- Net cashflow
- $-178
Break-even live
UW: 25.0% down · 7.5% · 30yr · 1.5% tax · 5.0% vac · 8.0% maint · 8.0% mgmt
Financing live
Cash to close
- Down payment
- $26,000
- Closing costs
- $3,120
- Reserves months
- —
- Total cash needed
- —
Loan-product check · same deal, 3 products live
Conventional
25% down · 7.5% · 30yr
- Down + closing
- —
- Monthly P&I
- —
- Monthly cashflow
- —
- DSCR
- —
- Eligible?
- —
Personal DTI + credit; lowest rate.
DSCR
20% down · 8.5% · 30yr
- Down + closing
- —
- Monthly P&I
- —
- Monthly cashflow
- —
- DSCR
- —
- Eligible?
- —
No personal income docs; deal must DSCR.
Hard money
10% down · 12.0% · 12mo
- Down + closing
- —
- Monthly P&I
- —
- Monthly cashflow
- —
- DSCR
- —
- Eligible?
- —
Short-term bridge; refi at stabilization.
Rent comps 1 comps
| Address | Beds | Baths | Sqft | Rent | $/sqft | DOM | Units | Dist |
|---|---|---|---|---|---|---|---|---|
| 20 Railroad Ave Apt 3 Plainfield, CT | 1.0 | 1.0 | 700 | $1,200 | $1.71 | 2d | 1 | 0.25mi |
HOA detail
- Monthly dues
- $485 · $5,820/yr
- Likely covers
- watersewertrash
Listing history 6 events
-
2026-06-18days on market $104,000 Active 5 DOM
-
2026-06-17days on market $104,000 Active 4 DOM
-
2026-06-16days on market $104,000 Active 3 DOM
-
2026-06-15days on market $104,000 Active 2 DOM
-
2026-06-14remarks 699-char remark
-
2026-06-14$104,000 Active 1 DOM
ⓘ Source: listings_history table (triggers on properties + properties_extension) + one-shot
backfill from property_details.listing_events for pre-trigger history.
Tax reassessment forecast CT · Partial reset (capped growth)
- Current annual tax
- $623 · $52/mo
- Projected year-2 tax
- $1,424 · $119/mo
- Expected delta
- +$801/yr (+$67/mo · 128.6%)
ⓘ Screening estimate from a state-policy table — verify with the county assessor before closing.
Nearby sold comps map
Loading sold comps map…
Walkable amenities ~0.75 mi
Loading nearby amenities…
Taxation est. · year 1
- Rental income
- $14,400
- − Mortgage interest
- −$5,826
- − Property taxes
- −$623
- − Insurance
- −$520
- − Repairs & maintenance
- −$1,152
- − Management
- −$1,152
- − HOA
- −$5,820
- − Depreciation
- −$3,025
- Taxable loss
- −$3,718
- Est. tax savings @ 24.0%
- +$892
- After-tax cash flow
- $-1,239/yr
For passive investors: Depreciation is non-cash, so a rental often shows a tax loss while cash-flowing — sheltering income. Rental losses are passive: they offset passive income freely, and up to $25,000/yr can offset ordinary (W-2) income if you actively participate and your MAGI is under $100k (phasing out to $0 by $150k); unused losses carry forward. On sale, claimed depreciation is recaptured at up to 25%, and gains may owe capital-gains tax (a 1031 exchange can defer both). Figures are a year-1 estimate at your 24.0% rate — not tax advice; consult a CPA.
Schools (NCES district)
- District
- Plainfield School District
- NCES district ID
- 0903270
- Math proficiency
- 24% ▼ -16.00%
- Reading proficiency
- 41% ▼ -17.00%
- Median HH income
- $62,056
- Composite
- 29.36/100
- National rank
- #6531
- State rank
- #117 of 153 in CT
Livability — Plainfield
No livability data for this city. (Only ~50 U.S. cities are tracked.)
Census & demographics
- Census place
- Plainfield Village, CT
- Population (ZIP)
- 7,884
Population outlook (Northeastern Connecticut County) Hauer SSP2
- By 2040
- 104,160
Race, ethnicity, and origin ACS 2023
- Neighborhood character
- Predominantly White (88%)
- Race & ethnicity
- White 88% Hispanic / Latino 6% Two or more races 4% Black 3%
- Hispanic origin (detail)
- Mexican 2% Puerto Rican 2%
- Common ancestry
- Lithuanian 18% Slovak 3% Romanian 3%
- Foreign-born
- 4% · Canada
- Languages at home
- 92% English-only · French/Haitian/Cajun 4% Spanish 2% Other Asian/Pacific 1%
Political lean MEDSL · Northeastern Connecticut
- 2024 margin
- R (+15.4) · D 41.5% · R 57.0% · Other 1.5%
- All cycles
- 2024: R+15.4
Not yet ingested
- Civics
- —
Market trends
- HPI YoY
- ▼ -3.18%
- Current HPI
- 311.7013
- Rent YoY
- —
- Metro
- —
- State GDP YoY
- ▲ 1.06%
- F500 in state
- 38
Industry mix (Fortune 500 HQ in CT)
| Industry | F500 HQs | Revenue |
|---|---|---|
| Industrial Machinery | 4 | $38B |
|
||
| Insurance | 3 | $71B |
|
||
| Financial Services | 2 | $25B |
|
||
| Transportation / Logistics | 2 | $18B |
|
||
| Healthcare | 1 | $247B |
|
||
| Telecommunications | 1 | $55B |
|
||
Price history
+197.1% since first listed7 events — show timeline
- 2026-06-13 Listed $104,000 Smart MLS
- 2023-07-18 Sold (MLS) $70,000 Smart MLS
- 2023-06-29 Pending — Smart MLS
- 2023-06-27 Listed $59,900 Smart MLS
- 2018-01-24 Sold (MLS) $28,000 Smart MLS
- 2018-01-21 Pending — Smart MLS
- 2017-08-24 Listed $35,000 Smart MLS
Property tax history
+0.8%/yrLatest (2022): $623 · -1.1% YoY. Source: county tax records.
Cash-flow waterfall
monthlySold comps — $/sqft
last 12 mo · ≤1 miLoading sold comps…