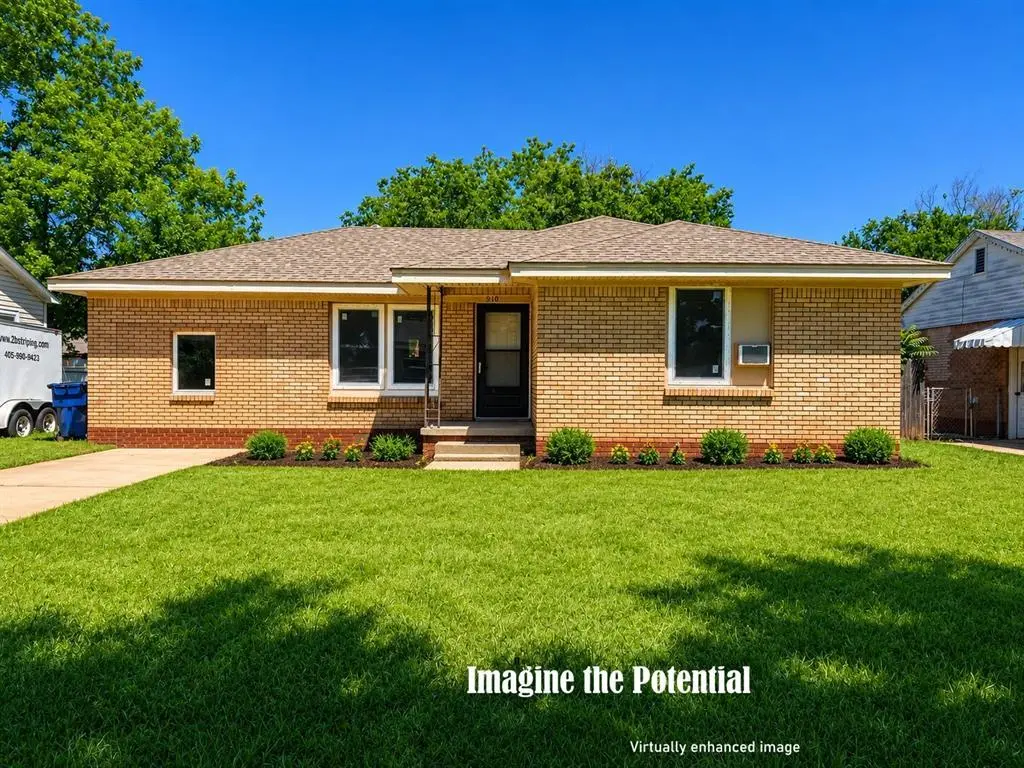
910 W Choctaw St · Lindsay, OK
Flood risk 1/10 · Minimal
- FEMA flood zone
- AE
- Chance of flooding over 30 yrs
- 0.0%
- Est. flood insurance / yr
- $1,737 – $8,500
Fire risk 5/10 · Moderate
- Est. fire insurance / yr
- $2,463 – $4,575
Heat risk 6/10 · Moderate
- Hot days now (above 109°F)
- 7 days/yr
- Hot days in 30 yrs
- 19 days/yr
Wind risk 3/10 · Minor
- Chance of severe wind over 30 yrs
- 6.0%
Air-quality risk 2/10 · Minimal
- Unhealthy air days now
- 1 days/yr
- Unhealthy air days in 30 yrs
- 1 days/yr
Risk factors via First Street. Map © Google.
Why this score? — see what drove the B- grade
The composite is a weighted blend of 9 inputs, each scored 0–100. Each bar is that input's sub-score; the figure is the points it added to the 100-point composite (weight × sub-score).
- Cash flow +30.0/30.0
- DSCR +10.0/10.0
- 1% rule +8.9/10.0
- Appreciation +8.6/10.0
- Livability +3.0/5.0
- Rent growth +2.5/5.0
- Condition / age +2.5/5.0
- Schools +2.0/10.0
- ARV discount +0.0/15.0
$72,000
🖨 Deal sheet (PDF) 📄 Offer letter ✓ Due diligence
Listing remarks
Investors & DIY dreamers — the hard part is already done! This charming home is nearly complete and is ready for you to bring the final vision to life. The layout has already been opened up for a modern feel, and the garage conversion adds valuable extra space with a bath, laundry area, and bonus room/study that could easily function as a 3rd bedroom. Updates include: - High efficiency, triple-pane insulated Low-E windows - New exterior doors & hardware - Textured walls, ceilings & paint - New lighting & ceiling fans - Laminate flooring (no carpet) - New dishwasher & gas range - 2019 roof - New bathroom vanities, toilets & bath/shower units - Large
Key facts
- Textured walls
- Laminate flooring
- Garage conversion
Tags
Property features AI
Finance
- Other: Homestead exempt; Vacant / not occupied
- Financial info: Sold/Offered as-is; Cash offers accepted; Not assumable
- HOA & community: No mandatory association dues
Exterior
- Parking: Concrete parking
- Security: Storm doors; Double glazed windows
- Utilities: Public utilities
- Home design: Single family residence; One level; Facing south; Existing property
- Construction: Brick construction; Composition roof (roof replaced in 2019); Low E, triple pane vinyl frame windows; Conventional foundation
- Exterior features: Covered porch; Open patio; Combination fencing; Interior lot
Interior
- Kitchen: Gas range (free standing); Gas oven (free standing); Dishwasher
- Bedrooms: 2 bedrooms
- Flooring: Laminate flooring
- Bathrooms: 2 full bathrooms
- Heating & cooling: Heating: Other; Cooling: Window units
- Interior features: Ceiling fan(s); Bonus room; Inside utility; Optional bedroom / flexible space
- Laundry & utility: Water heater; Inside utility room
Neighborhood map
What this means for you Summary
Snapshot
- This is a 2-bed/1.0-bath single-family listed at $72k.
Deal economics
- At list price, monthly cash flow is $-104 ($-1k/yr) — negative.
- To cash-flow at today's rent, offer at most $54k (25.6% below list).
- Meets the 1% rule at list price ($999 rent vs $72k).
- Recommended offer: $54k (25.6% below list) — sets the bar for cash-flow.
Location & tenants
- Location reads 59/100 on livability (#380 in OK) — a working-class tenant base; expect higher turnover. Strengths: cost of living A+, housing A+; Watch: crime C-, employment C-, amenities F.
- Lindsay (town): math 21% / reading 24% proficiency, ranked #141 of 270 in OK (top 52%) — low school quality limits family demand, transient renter base, plan for 1-2y turnover.
- Zoned schools: Lindsay Es (math 25% / reading 24%, grade F, #354 of 845 statewide, top 47%, 606 students, 0% FRL); Lindsay Ms (math 20% / reading 23%, grade F, #146 of 345 statewide, top 43%, 234 students, 0% FRL); Lindsay Hs (math 12% / reading 22%, grade F, #314 of 447 statewide, top 72%, 324 students, 0% FRL) — zoned schools average 0% FRL vs 46% district-wide (46 pts lower); this property's tenant base skews higher-income than the district average.
- Market conditions: 46 active listings in the ZIP; 1 units permitted in Garvin County in 2024 (0 in 5+ unit buildings).
Forward outlook
- In year one you build about $6k of equity ($498 loan paydown + $5k appreciation (7.2% local appreciation)).
- Garvin County population projected at +8% by 2050 — modest demand growth; plan on rents tracking national, not racing it.
- By year 6, paydown + projected appreciation supports a ~$31k cash-out refi (75% LTV) — recoverable capital for the next deal without selling this one.
Negotiation context
- It's been on market 40 days — a 3% lower offer ($70k) is reasonable based on typical stale-listing flexibility.
- Current owner paid $30k; list at $72k implies a 144% gain — meaningful room to come down on a strong offer.
Risks & watch-outs
- Watch-outs: flood insurance adds $427/mo.
- Climate carrying-cost: in FEMA flood zone AE (mandatory federal flood insurance); moderate wildfire risk; extreme-heat days projected 7→19/yr by 2055 (HVAC capex compounding) — expect insurance premiums to compound above CPI over the hold.
Questions for the listing agent
- What do current leases actually rent for vs. the listed asking? Can we see a recent rent roll and the last 12 months of T-12 income?
- It's been on market 40 days. Have you received any prior offers? Is the seller open to a 26% concession, seller financing, or rate buy-down credit?
- Built in 1970 — when were the roof, HVAC, electrical panel, plumbing, and water heater last replaced?
- What's the actual annual flood-insurance premium (NFIP or private), and is the property in a SFHA with mandatory coverage?
- Is there a deadline driving the sale (1031 exchange, divorce, estate, relocation)? That informs how much negotiation room exists.
- Schools are F-rated, which usually means shorter tenancies and higher turnover. Who's the typical renter profile here, and what's been the actual vacancy rate?
- What's the average days-on-market for RENTAL listings here right now (not sales)? A rising rental-DOM trend means longer vacancies and softer asking-rent achievability than the comps imply.
- What's the recent tenant-quality profile in this submarket — average credit score on applications, eviction rate, late-payment / NSF rate, and stable-employment percentage? A property-management company in the area should have these aggregated.
- How much new for-sale + rental construction is in the pipeline within 1–3 miles? Heavy new supply typically softens prices + rents 12–24 months out; constrained supply supports both.
Investment metrics
- 1% rule
- 1.39% ✓
- Cap rate
- 11.67%
- Cash-on-cash
- 19.19%
- DSCR
- 1.85
- GRM
- 6.0
CMA / ARV
- ARV (on-the-fly)
- $60,264
- Comps found
- 6
Show comp detail 6 sales within ~0.75 mi
| Address | Dist | Beds/Ba | Sqft | Sold | Price | $/sf | Match |
|---|---|---|---|---|---|---|---|
| 502 SE 2nd St | 0.34mi | 3/1.0 (+1) | 1,116 (0%) | 10mo | $97,000 | $87 | 71 |
| 610 W Apache St | 0.60mi | 2/1.0 | 1,160 (+4%) | 18mo | $40,000 | $34 | 50 |
| 606 SW 6th St | 0.58mi | 2/1.0 | 984 (-12%) | 10mo | $45,000 | $46 | 45 |
| 404 SW 6th | 0.66mi | 2/1.0 | 1,184 (+6%) | 21mo | $64,500 | $54 | 41 |
| 605 SW 6th St | 0.55mi | 2/1.0 | 956 (-14%) | 12mo | $82,000 | $86 | 41 |
| 406 W Comanche St | 0.50mi | 2/1.0 | 1,000 (-10%) | 24mo | $50,000 | $50 | 39 |
Match score weights: distance 35% · size 25% · config 20% · recency 20%. Top-matched comps best support the ARV.
Projected returns pro-forma
7.17% appreciation · 3.0% rent growth · sell at horizon
- IRR
- 13.5%
- Equity multiple
- 1.97×
- Total profit
- $19,516
- Equity at exit
- $50,695
- IRR
- 13.8%
- Equity multiple
- 4.08×
- Total profit
- $62,146
- Equity at exit
- $97,032
Cash invested: $20,160 (down + closing). Projections, not guarantees.
Landlord ↔ Tenant lean methodology
- Overall (STATE)
- 83 Strongly Landlord-Friendly
- State Oklahoma
- 83 Strongly Landlord-Friendly · R+20
- County
- — inherits STATE
- City
- — inherits STATE
ZIP-level market 73052
- Home prices YoY
- 3.2%
- Active inventory
- 46
- Price-to-rent
- 6.0×
Monthly cashflow live
- Estimated rent
- $999 medium interval (Pro) →
- Mortgage (P&I)
- −$378
- Tax from tax record
- −$59 /mo · $710/yr
- Insurance
- −$30
- Flood insurance flood zone
- −$427 /mo · $5,118/yr
- HOA
- −$0
- Vacancy / Maint / Mgmt
- −$210
- Net cashflow
- $-104
Break-even live
Sensitivity live
| Price | -10% $-63 | -5% $-84 | +0% $-104 | +5% $-125 | +10% $-145 |
|---|---|---|---|---|---|
| Rent | -10% $-183 | -5% $-144 | +0% $-104 | +5% $-65 | +10% $-25 |
| Rate | -1.0pp $-68 | -0.5pp $-86 | base $-104 | +0.5pp $-123 | +1.0pp $-142 |
UW: 25.0% down · 7.5% · 30yr · 1.5% tax · 5.0% vac · 8.0% maint · 8.0% mgmt
Financing live
Cash to close
- Down payment
- $18,000
- Closing costs
- $2,160
- Reserves months
- —
- Total cash needed
- —
Loan-product check · same deal, 3 products live
Conventional
25% down · 7.5% · 30yr
- Down + closing
- —
- Monthly P&I
- —
- Monthly cashflow
- —
- DSCR
- —
- Eligible?
- —
Personal DTI + credit; lowest rate.
DSCR
20% down · 8.5% · 30yr
- Down + closing
- —
- Monthly P&I
- —
- Monthly cashflow
- —
- DSCR
- —
- Eligible?
- —
No personal income docs; deal must DSCR.
Hard money
10% down · 12.0% · 12mo
- Down + closing
- —
- Monthly P&I
- —
- Monthly cashflow
- —
- DSCR
- —
- Eligible?
- —
Short-term bridge; refi at stabilization.
Listing history 15 events
-
2026-06-21days on market $72,000 Active 40 DOM
-
2026-06-18days on market $72,000 Active 37 DOM
-
2026-06-17days on market $72,000 Active 36 DOM
-
2026-06-16days on market $72,000 Active 35 DOM
-
2026-06-15days on market $72,000 Active 34 DOM
-
2026-06-13days on market $72,000 Active 32 DOM
-
2026-06-09days on market $72,000 Active 28 DOM
-
2026-06-08days on market $72,000 Active 27 DOM
-
2026-06-07days on market $72,000 Active 26 DOM
-
2026-06-03pricedays on market $72,000 Active 22 DOM
-
2026-06-02days on market $75,000 Active 21 DOM
-
2026-06-01days on market $75,000 Active 20 DOM
-
2026-05-31days on market $75,000 Active 19 DOM
-
2026-05-11$75,000 Active
-
2002-03-12soldstatus $29,500
ⓘ Source: listings_history table (triggers on properties + properties_extension) + one-shot
backfill from property_details.listing_events for pre-trigger history.
Tax reassessment forecast OK · Resets to sale price
- Current annual tax
- $710 · $59/mo
- Projected year-2 tax
- $710 · $59/mo
- Expected delta
- $0/yr ($0/mo · 0.0%)
ⓘ Screening estimate from a state-policy table — verify with the county assessor before closing.
Climate risk First Street
- Flood 1/10 Low FEMA zone AE · 0% chance over 30 yrs
- Wildfire 5/10 Major
- Heat 6/10 Major 7 d/yr ≥109°F today · 19 d/yr by 30 yrs out
- Wind 3/10 Moderate 6% chance of damaging wind over 30 yrs
- Air quality 2/10 Low 1 unhealthy d/yr today · 1 by 30 yrs out
Nearby sold comps map
Loading sold comps map…
Walkable amenities ~0.75 mi
Loading nearby amenities…
Taxation est. · year 1
- Rental income
- $11,986
- − Mortgage interest
- −$4,033
- − Property taxes
- −$710
- − Insurance
- −$5,478
- − Repairs & maintenance
- −$959
- − Management
- −$959
- − Depreciation
- −$2,095
- Taxable loss
- −$2,248
- Est. tax savings @ 24.0%
- +$540
- After-tax cash flow
- $-711/yr
For passive investors: Depreciation is non-cash, so a rental often shows a tax loss while cash-flowing — sheltering income. Rental losses are passive: they offset passive income freely, and up to $25,000/yr can offset ordinary (W-2) income if you actively participate and your MAGI is under $100k (phasing out to $0 by $150k); unused losses carry forward. On sale, claimed depreciation is recaptured at up to 25%, and gains may owe capital-gains tax (a 1031 exchange can defer both). Figures are a year-1 estimate at your 24.0% rate — not tax advice; consult a CPA.
Schools (NCES district)
- District
- Lindsay
- NCES district ID
- 4017850
- Math proficiency
- 21% ▼ -11.00%
- Reading proficiency
- 24% ▼ -11.00%
- Median HH income
- $45,406
- Composite
- 19.54/100
- National rank
- #8763
- State rank
- #141 of 270 in OK
Livability — Lindsay
- Score
- 59/100
- State rank
- #380
- US rank
- #19934
Category grades
Schools grade is shown separately in the Schools card above.
Census & demographics
- Census place
- Lindsay, OK
- City population
- 6,289
- Population (ZIP)
- 6,289
Population outlook (Garvin County) Hauer SSP2
- Today (2025)
- 28,277 people
- By 2030
- 28,619 · +1.2%
- By 2040
- 29,478 · +4.2%
- By 2050
- 30,384 · +7.5%
- By 2075
- 34,074 · +20.5%
- By 2100
- 36,099 · +27.7%
Race, ethnicity, and origin ACS 2023
- Neighborhood character
- Predominantly White (77%)
- Race & ethnicity
- White 77% Two or more races 12% Hispanic / Latino 11% Native American 4%
- Hispanic origin (detail)
- Mexican 9%
- Common ancestry
- Lithuanian 2% Iranian 1% Hungarian 1%
- Foreign-born
- 4% · Canada
- Languages at home
- 93% English-only · Spanish 7%
Political lean MEDSL · Garvin
- 2024 margin
- Solid R (+66.1) · D 16.4% · R 82.5% · Other 1.1%
- 2008→2024 swing
- -22.5pp toward R · 2008: -43.6pp · 2024: -66.1pp
- All cycles
- 2024: R+66.1 2020: R+64.2 2016: R+60.7 2012: R+46.1 2008: R+43.6
Not yet ingested
- Civics
- —
Market trends
- HPI YoY
- ▲ 7.17%
- Current HPI
- 234.17
- Rent YoY
- —
- Metro
- —
- State GDP YoY
- ▲ 1.55%
- F500 in state
- 6
Industry mix (Fortune 500 HQ in OK)
| Industry | F500 HQs | Revenue |
|---|---|---|
| Energy | 3 | $48B |
|
||
Price history
+154.2% since first listed2 events — show timeline
- 2026-05-11 Listed $75,000 MLSOK
- 2002-03-12 Sold (Public Records) $29,500 Public Records
Property tax history
+7.0%/yrLatest (2025): $710 · +53.0% YoY. Source: county tax records.
Cash-flow waterfall
monthlySold comps — $/sqft
last 12 mo · ≤1 miLoading sold comps…