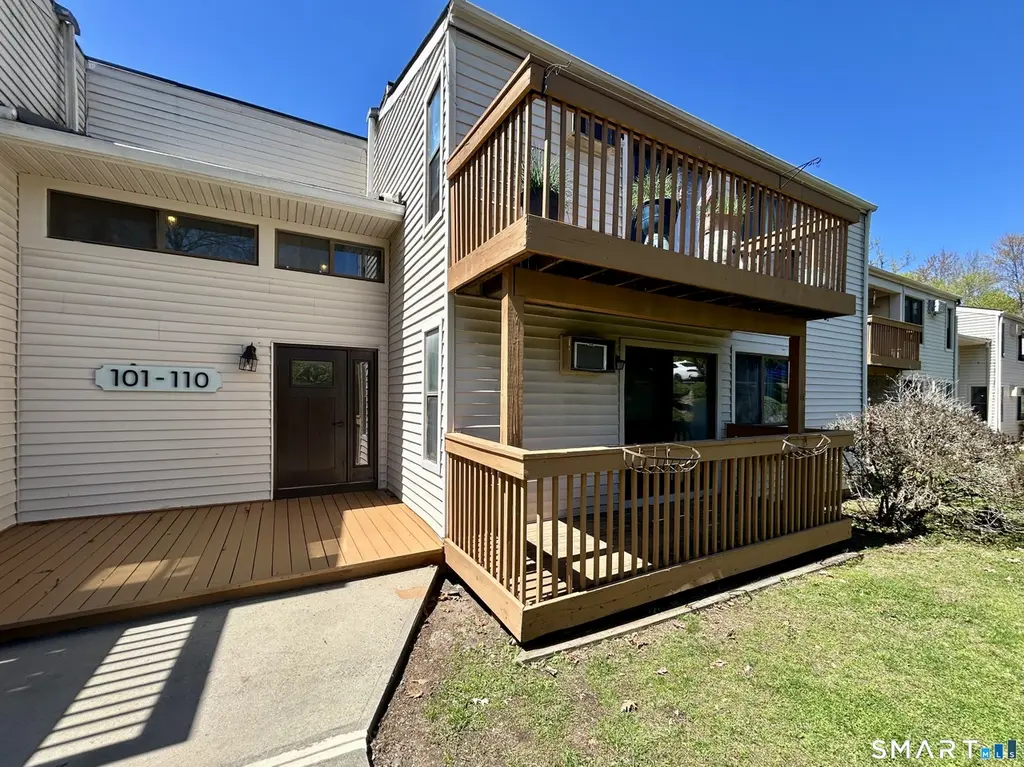
104 Woodland Dr #104 · Middletown, CT
Flood risk No data
- FEMA flood zone
- —
- Chance of flooding over 30 yrs
- —
- Est. flood insurance / yr
- —
Fire risk No data
- Est. fire insurance / yr
- —
Heat risk No data
- Hot days now (above threshold)
- —
- Hot days in 30 yrs
- —
Wind risk No data
- Chance of severe wind over 30 yrs
- —
Air-quality risk No data
- Unhealthy air days now
- —
- Unhealthy air days in 30 yrs
- —
Risk factors via First Street. Map © Google.
Why this score? — see what drove the C- grade
The composite is a weighted blend of 9 inputs, each scored 0–100. Each bar is that input's sub-score; the figure is the points it added to the 100-point composite (weight × sub-score).
- Cash flow +17.7/30.0
- ARV discount +7.5/15.0
- 1% rule +7.1/10.0
- DSCR +5.6/10.0
- Schools +4.9/10.0
- Livability +4.0/5.0
- Rent growth +2.5/5.0
- Condition / age +2.2/5.0
- Appreciation +0.0/10.0
$165,000
🖨 Deal sheet 📄 Offer letter ✓ Due diligence
Listing remarks
Easy access first floor, ranch style , one bedroom condo now available at an amazingly affordable price. Come bring your vision and make this unit your own. With heat and hot water included in the association fees, and a convenient location near shopping, dining, and easy highway access, this property is perfect for an owner of any needs wether first time home owner or downsizing. Scheduled your showings today.
Key facts
- Near dining
- Near shopping
- First floor
Tags
Property features AI
Finance
- Other: Pets allowed (association rules apply); Part of a 224-unit community
- Financial info: Monthly HOA fee of $297
- HOA & community: Homeowners association with monthly fee; Association covers heat, hot water and water; Association provides property management (professional on site)
Exterior
- Parking: Paved off-street parking; Assigned parking space; 1 parking space
- Utilities: Public water; Public sewer; Domestic hot water
- Home design: Condominium; Part of the Woodland Heights complex
- Construction: Frame construction
- Exterior features: Vinyl siding; In-ground swimming pool; Clubhouse; Grounds maintenance; Trash pickup; Snow removal
Interior
- Kitchen: Oven/Range; Refrigerator; Dishwasher
- Bedrooms: 1 bedroom (all on one level)
- Bathrooms: 1 full bathroom
- Heating & cooling: Baseboard and hot water heat; Natural gas heat; Ceiling fans; Wall unit cooling
- Interior features: Ceiling fans; Wall air-conditioning unit; Common laundry area
- Laundry & utility: Laundry in lower level (common area)
Neighborhood map
What this means for you Summary
Snapshot
- This is a 1-bed/1.0-bath condo listed at $165k. Condition is rated fair.
Deal economics
- At list price, monthly cash flow is $134 ($2k/yr) — positive.
- The deal already cash-flows at list — no discount required.
- Meets the 1% rule at list price ($2k rent vs $165k).
- Cap rate 7.3% vs local median 3.7% in Middletown — top-decile yield for the area; either an underpriced asset or a hidden risk that comps aren't pricing in. Stress-test before assuming the spread holds.
Location & tenants
- Location reads 81/100 on livability (#17 in CT, #1,390 nationally) — a professional / high-income tenant draw. Strengths: crime A+, amenities A+, health & safety A+; Watch: commute F.
- Cromwell School District (suburban): math 51% / reading 58% proficiency, ranked #63 of 153 in CT (top 41%) — acceptable for families but not a draw, mixed tenant base, ~2y average lease; only 14% free/reduced lunch — higher-income household profile.
- Zoned schools: Edna C. Stevens School (473 students, 27% FRL); Cromwell High School (math 52% / reading 67%, grade C+, #45 of 194 statewide, top 25%, 536 students, 25% FRL).
- Market conditions: 58 active listings in the ZIP; high-income renter base; 278 units permitted in Lower Connecticut River Valley Planning Region in 2024 (89 in 5+ unit buildings).
Forward outlook
- Local home prices are declining (-3.0%/yr); year-one equity from $1k of loan paydown is wiped out by about $5k of value loss. Plan a longer hold.
Negotiation context
- Only 5 days on market — expect competitive offers; lowballing is unlikely to land.
- 2 sale attempts since 19y ago with the ask held roughly flat each time — persistent listings suggest the price (not the market) is what's stuck; bring a comps-based counter.
- Current owner paid $86k; list at $165k implies a 92% gain — meaningful room to come down on a strong offer.
Questions for the listing agent
- Have any recent inspections been done? Can we get a copy of the seller's disclosures and any deferred-maintenance estimates?
- Built in 1974 — when were the roof, HVAC, electrical panel, plumbing, and water heater last replaced?
- What does the HOA fee cover, when was the last increase, and are there any pending special assessments or reserve-fund shortfalls?
- Any open or pending special assessments — roof, HVAC, plumbing, elevator, façade? What's the per-unit balance and payoff schedule, and is the seller paying it off at close or rolling it to the buyer?
- Is there a deadline driving the sale (1031 exchange, divorce, estate, relocation)? That informs how much negotiation room exists.
- What's the average days-on-market for RENTAL listings here right now (not sales)? A rising rental-DOM trend means longer vacancies and softer asking-rent achievability than the comps imply.
- What's the recent tenant-quality profile in this submarket — average credit score on applications, eviction rate, late-payment / NSF rate, and stable-employment percentage? A property-management company in the area should have these aggregated.
- How much new apartment / multifamily construction is in the pipeline within 1–3 miles? Heavy new supply (>2% of stock underway) typically softens rents 12–24 months out; light construction supports rent growth.
Investment metrics
- 1% rule
- 1.21% ✓
- Cap rate
- 7.27%
- Cash-on-cash
- 3.49%
- DSCR
- 1.16
- GRM
- 6.9
CMA / ARV
No comps found within radius.
Projected returns pro-forma
-3.0% appreciation · 3.0% rent growth · sell at horizon
- IRR
- -10.7%
- Equity multiple
- 0.61×
- Total profit
- $-17,974
- Equity at exit
- $24,602
- IRR
- -1.2%
- Equity multiple
- 0.92×
- Total profit
- $-3,779
- Equity at exit
- $14,266
Cash invested: $46,200 (down + closing). Projections, not guarantees.
Landlord ↔ Tenant lean methodology
- Overall (STATE)
- 27 Tenant-Leaning
- State Connecticut
- 27 Tenant-Leaning · D+7
- County
- — inherits STATE
- City
- — inherits STATE
ZIP-level market 06416
- Home prices YoY
- -16.0%
- Active inventory
- 58
- Price-to-rent
- 6.9×
Monthly cashflow live
- Estimated rent
- $1,989 medium interval (Pro) →
- Mortgage (P&I)
- −$865
- Tax est. 1.5%
- −$206 /mo · $2,475/yr
- Insurance
- −$69
- HOA
- −$297
- Vacancy / Maint / Mgmt
- −$418
- Net cashflow
- $134
Break-even live
UW: 25.0% down · 7.5% · 30yr · 1.5% tax · 5.0% vac · 8.0% maint · 8.0% mgmt
Financing live
Cash to close
- Down payment
- $41,250
- Closing costs
- $4,950
- Reserves months
- —
- Total cash needed
- —
Loan-product check · same deal, 3 products live
Conventional
25% down · 7.5% · 30yr
- Down + closing
- —
- Monthly P&I
- —
- Monthly cashflow
- —
- DSCR
- —
- Eligible?
- —
Personal DTI + credit; lowest rate.
DSCR
20% down · 8.5% · 30yr
- Down + closing
- —
- Monthly P&I
- —
- Monthly cashflow
- —
- DSCR
- —
- Eligible?
- —
No personal income docs; deal must DSCR.
Hard money
10% down · 12.0% · 12mo
- Down + closing
- —
- Monthly P&I
- —
- Monthly cashflow
- —
- DSCR
- —
- Eligible?
- —
Short-term bridge; refi at stabilization.
HOA detail condo
- Monthly dues
- $297 · $3,564/yr
- Likely covers
- water
- Assessments
- None detected in remarks — confirm with the listing agent.
Listing history 4 events
-
2026-04-29status Under Contract
-
2026-04-24$165,000 Active
-
2008-05-28soldstatus $86,000
-
2007-10-31$86,000
ⓘ Source: listings_history table (triggers on properties + properties_extension) + one-shot
backfill from property_details.listing_events for pre-trigger history.
Nearby sold comps map
Loading sold comps map…
Walkable amenities ~0.75 mi
Loading nearby amenities…
Taxation est. · year 1
- Rental income
- $23,871
- − Mortgage interest
- −$9,243
- − Property taxes
- −$2,475
- − Insurance
- −$825
- − Repairs & maintenance
- −$1,910
- − Management
- −$1,910
- − HOA
- −$3,564
- − Depreciation
- −$4,800
- Taxable loss
- −$855
- Est. tax savings @ 24.0%
- +$205
- After-tax cash flow
- $1,816/yr
For passive investors: Depreciation is non-cash, so a rental often shows a tax loss while cash-flowing — sheltering income. Rental losses are passive: they offset passive income freely, and up to $25,000/yr can offset ordinary (W-2) income if you actively participate and your MAGI is under $100k (phasing out to $0 by $150k); unused losses carry forward. On sale, claimed depreciation is recaptured at up to 25%, and gains may owe capital-gains tax (a 1031 exchange can defer both). Figures are a year-1 estimate at your 24.0% rate — not tax advice; consult a CPA.
Condition & rehab AI · 13 photos
The home is in fair condition with some minor repairs and maintenance needed. It has a good location and is move-in ready.
Repairs flagged
- Minor Paint touch-ups — There is some minor discoloration and wear visible on the siding and interior walls.
- Minor Carpet cleaning — The carpet in the living room and kitchen appears to be in fair condition, with some wear visible.
Value-add opportunities
- Resale Paint touch-ups — Paint touch-ups can improve the overall appearance of the home and make it more appealing to potential buyers.
- Rental Carpet cleaning — Clean carpets can make the home more attractive to renters and can help maintain a good impression of the property.
- Both Landscaping maintenance — Maintaining the landscaping can improve the curb appeal of the home and make it more attractive to both buyers and renters.
Renovation cost estimate screening
| Repair item | Severity | Est. cost |
|---|---|---|
| Paint touch-ups · There is some minor discoloration and wear visible on the siding and interior walls. | Minor | $500–3,000 |
| Carpet cleaning · The carpet in the living room and kitchen appears to be in fair condition, with some wear visible. | Minor | $500–3,000 |
| Total estimated repair cost · 2 items | $1,000–6,000 |
Value-add ROI direction
- Resale Paint touch-ups — Paint touch-ups can improve the overall appearance of the home and make it more appealing to potential buyers. ↑
- Rental Carpet cleaning — Clean carpets can make the home more attractive to renters and can help maintain a good impression of the property. ↑
- Both Landscaping maintenance — Maintaining the landscaping can improve the curb appeal of the home and make it more attractive to both buyers and renters. ↑
ⓘ Cost ranges are severity-bucket heuristics (US national rule-of-thumb). Get contractor quotes + a written scope before underwriting a rehab budget.
Schools (NCES district)
- District
- Cromwell School District
- NCES district ID
- 0900990
- Math proficiency
- 51% ▼ -7.00%
- Reading proficiency
- 58% ▼ -9.00%
- Median HH income
- $80,252
- Composite
- 49.39/100
- National rank
- #2013
- State rank
- #63 of 153 in CT
Livability — Middletown
- Score
- 81/100
- State rank
- #17
- US rank
- #1390
Category grades
Schools grade is shown separately in the Schools card above.
Census & demographics
- County
- Middlesex County · 63,941 people
- City population
- 46,720
- Metro
- Hartford-East Hartford-Middletown, CT
- Population (ZIP)
- 14,334
- Household income
- $110,596
- Rent vs Own
- Severe rent burden
- 188.0
Population outlook (Lower Connecticut River Valley County) Hauer SSP2
- By 2040
- 188,651
Race, ethnicity, and origin ACS 2023
- Neighborhood character
- Predominantly White (74%)
- Race & ethnicity
- White 74% Two or more races 12% Hispanic / Latino 9% Asian 6% Black 6%
- Hispanic origin (detail)
- Puerto Rican 5%
- Common ancestry
- Romanian 11% Lithuanian 5% Italian 1%
- Foreign-born
- 10% · Canada, China, South Korea
- Languages at home
- 87% English-only · Spanish 4% Other Indo-European 2% Russian/Polish/Slavic 2%
Political lean MEDSL · Lower Connecticut River Valley
- 2024 margin
- D (+13.4) · D 55.9% · R 42.4% · Other 1.7%
- All cycles
- 2024: D+13.4
Not yet ingested
- Civics
- —
Market trends
- HPI YoY
- ▼ -49.38%
- Current HPI
- 259.9702
- Rent YoY
- —
- Metro
- Hartford-East Hartford-Middletown, CT
- State GDP YoY
- ▲ 1.06%
- F500 in state
- 38
Industry mix (Fortune 500 HQ in CT)
| Industry | F500 HQs | Revenue |
|---|---|---|
| Industrial Machinery | 4 | $38B |
|
||
| Insurance | 3 | $71B |
|
||
| Financial Services | 2 | $25B |
|
||
| Transportation / Logistics | 2 | $18B |
|
||
| Healthcare | 1 | $247B |
|
||
| Telecommunications | 1 | $55B |
|
||
Price history
+91.9% since first listed4 events — show timeline
- 2026-04-29 Pending — Smart MLS
- 2026-04-24 Listed $165,000 Smart MLS
- 2008-05-28 Sold (MLS) $86,000 Smart MLS
- 2007-10-31 Listed $86,000 Smart MLS
Cash-flow waterfall
monthlySold comps — $/sqft
last 12 mo · ≤1 miLoading sold comps…