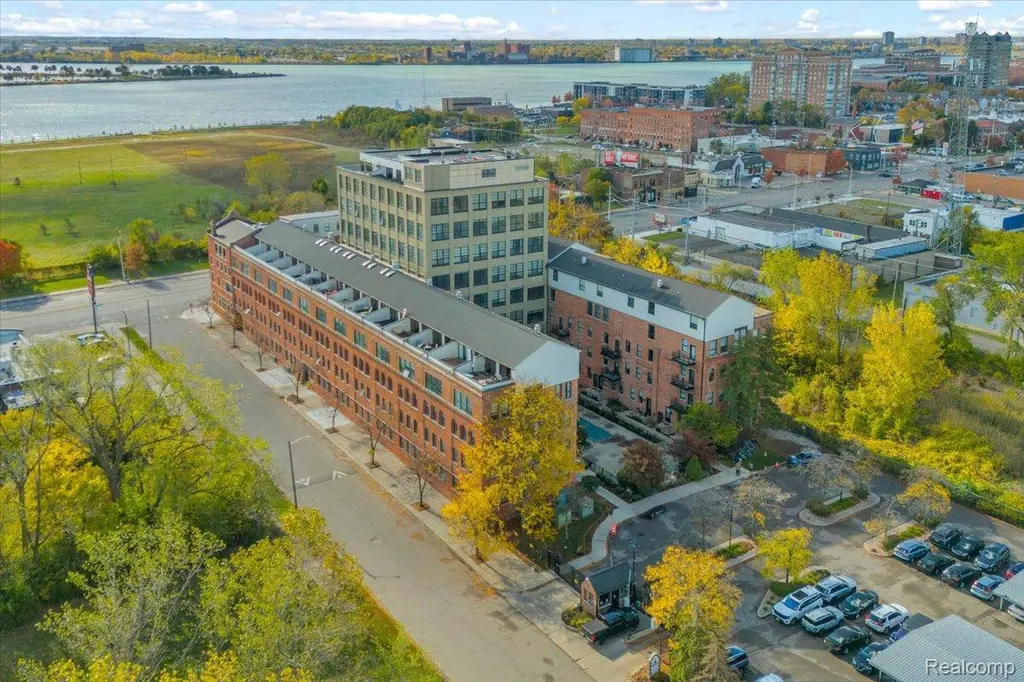
6533 E Jefferson Ave Unit 230T · Detroit, MI
Flood risk No data
- FEMA flood zone
- —
- Chance of flooding over 30 yrs
- —
- Est. flood insurance / yr
- —
Fire risk No data
- Est. fire insurance / yr
- —
Heat risk No data
- Hot days now (above threshold)
- —
- Hot days in 30 yrs
- —
Wind risk No data
- Chance of severe wind over 30 yrs
- —
Air-quality risk No data
- Unhealthy air days now
- —
- Unhealthy air days in 30 yrs
- —
Risk factors via First Street. Map © Google.
Why this score? — see what drove the D grade
The composite is a weighted blend of 9 inputs, each scored 0–100. Each bar is that input's sub-score; the figure is the points it added to the 100-point composite (weight × sub-score).
- ARV discount +15.0/15.0
- 1% rule +8.4/10.0
- Cash flow +4.5/30.0
- Livability +3.7/5.0
- Appreciation +3.6/10.0
- Rent growth +3.4/5.0
- Condition / age +2.5/5.0
- Schools +1.3/10.0
- DSCR +0.0/10.0
$124,000
🖨 Deal sheet 📄 Offer letter ✓ Due diligence
Listing remarks MLS
BACK ON THE MARKET NO FAULT TO SELLER! Experience urban living at its finest in this spacious 2-bedroom loft, perfectly situated in a gated community with covered parking for added convenience and security. This modern residence combines open-concept design with industrial charm - featuring high ceilings, and expansive windows. Just outside the highly sought-after Island View neighborhood, this loft offers the best of both worlds: vibrant city living with quick access to scenic green spaces. Enjoy being close to Detroit's dining, entertainment, and waterfront attractions such as the River Walk, Eastern Market, West Village and Belle Isle while coming home to a private, well-maintained community that offers comfort and peace of mind. Whether you're a professional, creator, or savvy investor, this property delivers the perfect balance of style, location, and lifestyle in the heart of Detroit's growing downtown corridor. BATVAI
Key facts
- Gated community
- Open-concept design
- Covered parking
Tags
Neighborhood map
What this means for you Summary
Snapshot
- This is a 2-bed/2.0-bath condo listed at $124k.
Deal economics
- At list price, monthly cash flow is $-318 ($-4k/yr) — negative.
- To cash-flow at today's rent, offer at most $78k (37.1% below list).
- Meets the 1% rule at list price ($2k rent vs $124k).
- Recommended offer: $78k (37.1% below list) — sets the bar for cash-flow.
- Cap rate 3.2% vs local median 10.2% in Detroit — below-typical yield; the buyer is paying a premium for something (appreciation thesis, condition, location) that the cap rate doesn't capture.
Location & tenants
- Location reads 73/100 on livability (#218 in MI) — a middle-class / working-renter tenant base. Strengths: amenities A+, commute A+, cost of living A+; Watch: schools F, crime F, employment F.
- Detroit Public Schools Community District (urban): math 10% / reading 24% proficiency, ranked #499 of 540 in MI (top 92%) — low school quality limits family demand, transient renter base, plan for 1-2y turnover; 90% free/reduced lunch — lower-income household profile, screen leases tightly.
- Market conditions: Rents rising (+3.5%/yr); 244 active listings in the ZIP; 40 comparable units currently listed for rent nearby; rentals lingering (median 44d on market — plan ~5-8 weeks vacancy on turnover, expect pricing pressure); 50% of comp listings sitting > 30 days — soft ceiling on asking rent; 2,639 units permitted in Wayne County in 2024 (1,216 in 5+ unit buildings).
- This rent runs 42% of the median local income ($48k/yr) — at the standard rent-burdened threshold; future hikes will face affordability resistance.
Forward outlook
- Local home prices are declining (-2.8%/yr); year-one equity from $857 of loan paydown is wiped out by about $3k of value loss. Plan a longer hold.
- Wayne County population projected at -17% by 2050 — secular population decline; favor cash flow + early exit over multi-decade hold.
Negotiation context
- It's been on market 84 days — a 6% lower offer ($117k) is reasonable based on typical stale-listing flexibility.
- 4 sale attempts; this cycle's ask has dropped $11k (8%) from the opening price — seller is motivated, your offer sets the floor, not the list.
- Current owner paid $27k; list at $124k implies a 364% gain — meaningful room to come down on a strong offer.
Risks & watch-outs
- Watch-outs: HOA is 47% of rent; built in 1906 — expect roof / HVAC / electrical / plumbing capex.
Questions for the listing agent
- What do current leases actually rent for vs. the listed asking? Can we see a recent rent roll and the last 12 months of T-12 income?
- It's been on market 84 days. Have you received any prior offers? Is the seller open to a 37% concession, seller financing, or rate buy-down credit?
- Built in 1906 — when were the roof, HVAC, electrical panel, plumbing, and water heater last replaced?
- What does the HOA fee cover, when was the last increase, and are there any pending special assessments or reserve-fund shortfalls?
- Any open or pending special assessments — roof, HVAC, plumbing, elevator, façade? What's the per-unit balance and payoff schedule, and is the seller paying it off at close or rolling it to the buyer?
- Why hasn't it sold? Are there any deal-killer items the seller is aware of (foundation, flood, title, zoning, code violations)?
- Is there a deadline driving the sale (1031 exchange, divorce, estate, relocation)? That informs how much negotiation room exists.
- Schools are F-rated, which usually means shorter tenancies and higher turnover. Who's the typical renter profile here, and what's been the actual vacancy rate?
- Crime grade is F in this area — have there been break-ins, vandalism, or insurance claims at this property in the last 3 years? What carrier currently insures it and at what premium?
- The area grade is low — what's the realistic commute time and amenity access for the typical tenant pool here? Any planned neighborhood developments (good or bad) we should know about?
- What's the average days-on-market for RENTAL listings here right now (not sales)? A rising rental-DOM trend means longer vacancies and softer asking-rent achievability than the comps imply.
- What's the recent tenant-quality profile in this submarket — average credit score on applications, eviction rate, late-payment / NSF rate, and stable-employment percentage? A property-management company in the area should have these aggregated.
- How much new apartment / multifamily construction is in the pipeline within 1–3 miles? Heavy new supply (>2% of stock underway) typically softens rents 12–24 months out; light construction supports rent growth.
Investment metrics
- 1% rule
- 1.34% ✓
- Cap rate
- 3.22%
- Cash-on-cash
- -10.98%
- DSCR
- 0.51
- GRM
- 6.2
CMA / ARV
- ARV (median comp)
- $155,437
- List price
- $124,000
- Delta
- -20.22%
- Verdict
- UNDERPRICED
- Comps
- 20 within 1.0 mi
Projected returns pro-forma
-2.79% appreciation · 3.53% rent growth · sell at horizon
- IRR
- -32.0%
- Equity multiple
- -0.09×
- Total profit
- $-37,839
- Equity at exit
- $19,645
- IRR
- -28.3%
- Equity multiple
- -0.51×
- Total profit
- $-52,327
- Equity at exit
- $12,717
Cash invested: $34,720 (down + closing). Projections, not guarantees.
Landlord ↔ Tenant lean methodology
- Overall (STATE)
- 62 Landlord-Friendly
- State Michigan
- 62 Landlord-Friendly · EVEN
- County
- — inherits STATE
- City
- — inherits STATE
ZIP-level market 48207
- Home prices YoY
- -2.0%
- Rents YoY
- 3.5%
- Active inventory
- 244
- Price-to-rent
- 6.2×
Monthly cashflow live
- Estimated rent
- $1,664 high interval (Pro) →
- Mortgage (P&I)
- −$650
- Tax est. 1.5%
- −$155 /mo · $1,860/yr
- Insurance
- −$52
- HOA
- −$775
- Vacancy / Maint / Mgmt
- −$349
- Net cashflow
- $-318
Break-even live
UW: 25.0% down · 7.5% · 30yr · 1.5% tax · 5.0% vac · 8.0% maint · 8.0% mgmt
Financing live
Cash to close
- Down payment
- $31,000
- Closing costs
- $3,720
- Reserves months
- —
- Total cash needed
- —
Loan-product check · same deal, 3 products live
Conventional
25% down · 7.5% · 30yr
- Down + closing
- —
- Monthly P&I
- —
- Monthly cashflow
- —
- DSCR
- —
- Eligible?
- —
Personal DTI + credit; lowest rate.
DSCR
20% down · 8.5% · 30yr
- Down + closing
- —
- Monthly P&I
- —
- Monthly cashflow
- —
- DSCR
- —
- Eligible?
- —
No personal income docs; deal must DSCR.
Hard money
10% down · 12.0% · 12mo
- Down + closing
- —
- Monthly P&I
- —
- Monthly cashflow
- —
- DSCR
- —
- Eligible?
- —
Short-term bridge; refi at stabilization.
Rent comps 40 comps
| Address | Beds | Baths | Sqft | Rent | $/sqft | DOM | Units | Dist |
|---|---|---|---|---|---|---|---|---|
| 6533 E Jefferson Ave Detroit, MI | 2.0 | 1.0–2.0 | 1181 | $1,500 | $1.27 | 24d | 3 | 0.02mi |
| 6533 E Jefferson Ave Detroit, MI | 2.0 | 1.0–2.0 | 1094 | $1,500 | $1.37 | 17d | 2 | 0.02mi |
| 6533 E Jefferson Ave #421 Detroit, MI | 2.0 | 1.0 | 1063 | $2,200 | $2.07 | 15d | 1 | 0.02mi |
| 200 Mount Elliott St Detroit, MI | 1.0 | 1.0 | 1050 | $2,000 | $1.90 | 43d | 1 | 0.24mi |
| 1440 Robert Bradby Dr Detroit, MI | 2.0 | 2.0 | 1250 | $1,472 | $1.18 | 43d | 1 | 0.33mi |
| 625 Field St Detroit, MI | 3.0 | 1.5 | 900 | $882 | $0.98 | 18d | 1 | 0.36mi |
| 3500 E Jefferson Detroit, MI | 1.0–2.0 | 1.0–2.0 | 1012 | $2,560 | $2.53 | 1d | 5 | 0.43mi |
| 3320 Spinnaker Ln Detroit, MI | 1.0 | 1.0 | 740 | $1,550 | $2.09 | 43d | 1 | 0.49mi |
| 7700 E Jefferson Ave Detroit, MI | 2.0 | 1.0 | 877 | $1,795 | $2.05 | 43d | 1 | 0.56mi |
| 374 E Grand Blvd Unit 2A Detroit, MI | 2.0 | 2.0 | 1450 | $2,750 | $1.90 | 43d | 1 | 0.57mi |
| 7800 E Jefferson Ave Detroit, MI | 1.0–2.0 | 1.0 | 625 | $899 | $1.44 | 17d | 1 | 0.63mi |
| 1454 Townsend St #101 Detroit, MI | 2.0 | 2.0 | 1268 | $2,500 | $1.97 | 3d | 1 | 0.66mi |
| 7918 E Lafayette St #4 Detroit, MI | 3.0 | 1.0 | 1150 | $1,800 | $1.57 | 18d | 1 | 0.69mi |
| 7410 Kercheval Ave Unit 212 Detroit, MI | 2.0 | 2.0 | 1017 | $1,950 | $1.92 | 43d | 1 | 0.74mi |
| 1000 Van Dyke St Detroit, MI | 1.0–2.0 | 1.0 | 751 | $1,295 | $1.72 | 43d | 4 | 0.77mi |
| 1000 Van Dyke St Unit 205 Detroit, MI | 2.0 | 1.0 | 863 | $1,495 | $1.73 | 15d | 1 | 0.77mi |
| 1000 Van Dyke St Unit B02 Detroit, MI | 2.0 | 1.0 | 871 | $1,295 | $1.49 | 24d | 1 | 0.77mi |
| 500 River Pl Dr Detroit, MI | 1.0–3.0 | 1.0–2.0 | 950 | $1,625 | $1.71 | 43d | 1 | 0.79mi |
| 8100 E Jefferson Ave Detroit, MI | 3.0 | 1.0–3.0 | 1089 | $1,712 | $1.57 | 19d | 20 | 0.80mi |
| 2928 Prince Hall Dr Detroit, MI | 2.0 | 2.0 | 1425 | $2,000 | $1.40 | 5d | 1 | 0.90mi |
| 8001 Kercheval Ave Detroit, MI | 1.0–2.0 | 1.0–2.0 | 984 | $2,270 | $2.31 | 1d | 3 | 0.96mi |
| 1941 Chene Ct Detroit, MI | 1.0–2.0 | 1.0–2.0 | 795 | $1,200 | $1.51 | 12d | 4 | 1.01mi |
| 2001 Chene St Detroit, MI | 2.0 | 1.0 | 950 | $1,069 | $1.13 | 43d | 1 | 1.07mi |
| 2972 Field St Detroit, MI | 3.0 | 1.0 | 1225 | $1,395 | $1.14 | 17d | 1 | 1.10mi |
| 3511 Concord Ave Detroit, MI | 2.0 | 1.0 | 750 | $1,100 | $1.47 | 43d | 1 | 1.21mi |
| 1341 Crane St Detroit, MI | 1.0 | 1.0 | 750 | $995 | $1.33 | 1d | 1 | 1.24mi |
| 3460 Field St Detroit, MI | 2.0 | 1.0 | 1000 | $1,260 | $1.26 | 5d | 1 | 1.25mi |
| 8845 E Jefferson Apt 208 Detroit, MI | 2.0 | 1.5 | 992 | $1,635 | $1.65 | 43d | 1 | 1.26mi |
| 8845 E Jefferson Ave Unit 203 Detroit, MI | 2.0 | 1.5 | 1024 | $1,515 | $1.48 | 43d | 1 | 1.26mi |
| 8845 E Jefferson Ave Unit 102 Detroit, MI | 1.0 | 1.5 | 800 | $1,350 | $1.69 | 43d | 1 | 1.26mi |
| 8845 E Jefferson Ave Unit 207 Detroit, MI | 2.0 | 1.5 | 1500 | $1,695 | $1.13 | 43d | 1 | 1.26mi |
| 8845 E Jefferson Ave Unit 205 Detroit, MI | 2.0 | 1.5 | 960 | $1,425 | $1.48 | 43d | 1 | 1.26mi |
| 8845 E Jefferson Ave Unit 206 Detroit, MI | 2.0 | 1.5 | 1230 | $1,660 | $1.35 | 43d | 1 | 1.26mi |
| 8845 E Jefferson Ave Unit 302 Detroit, MI | 2.0 | 2.0 | 885 | $1,460 | $1.65 | 43d | 1 | 1.26mi |
| 8845 E Jefferson Ave Unit 204 Detroit, MI | 2.0 | 1.5 | 1150 | $2,350 | $2.04 | 43d | 1 | 1.26mi |
| 2280 E Vernor Hwy Detroit, MI | 1.0–3.0 | 1.0–2.0 | 872 | $919 | $1.05 | 20d | 1 | 1.28mi |
| 8925 E Jefferson Ave Detroit, MI | 1.0–2.0 | 1.0–2.0 | 1050 | $1,945 | $1.85 | 43d | 9 | 1.30mi |
| 1130 Holcomb St Detroit, MI | 2.0 | 1.0 | 550 | $1,095 | $1.99 | 1d | 18 | 1.35mi |
| 1575 Cherboneau Pl #61 Detroit, MI | 1.0 | 1.0 | 720 | $1,300 | $1.81 | 3d | 1 | 1.37mi |
| 1575 Cherboneau Pl Unit D-56 Detroit, MI | 1.0 | 1.0 | 800 | $1,375 | $1.72 | 43d | 1 | 1.37mi |
HOA detail condo
- Monthly dues
- $775 · $9,300/yr
- Likely covers
- watersecurity
- Assessments
- None detected in remarks — confirm with the listing agent.
Listing history 29 events
-
2026-06-18days on market $124,000 Active 84 DOM
-
2026-06-17days on market $124,000 Active 83 DOM
-
2026-06-15days on market $124,000 Active 81 DOM
-
2026-06-13days on market $124,000 Active 79 DOM
-
2026-06-13days on market $124,000 Active 78 DOM
-
2026-06-09pricedays on market $124,000 Active 75 DOM
-
2026-06-08days on market $125,000 Active 74 DOM
-
2026-06-07days on market $125,000 Active 73 DOM
-
2026-06-04days on market $125,000 Active 70 DOM
-
2026-06-03days on market $125,000 Active 69 DOM
-
2026-06-02days on market $125,000 Active 68 DOM
-
2026-06-01days on market $125,000 Active 67 DOM
-
2026-05-31days on market $125,000 Active 66 DOM
-
2026-04-09price $125,000 938-char remark
Show marketing remark (960 chars)
BACK ON THE MARKET NO FAULT TO SELLER! Experience urban living at its finest in this spacious 2-bedroom loft, perfectly situated in a gated community with covered parking for added convenience and security. This modern residence combines open-concept design with industrial charm—featuring high ceilings, and expansive windows. Just outside the highly sought-after Island View neighborhood, this loft offers the best of both worlds: vibrant city living with quick access to scenic green spaces. Enjoy being close to Detroit’s dining, entertainment, and waterfront attractions such as the River Walk, Eastern Market, West Village and Belle Isle while coming home to a private, well-maintained community that offers comfort and peace of mind. Whether you’re a professional, creator, or savvy investor, this property delivers the perfect balance of style, location, and lifestyle in the heart of Detroit’s growing downtown corridor. BATVAI
-
2026-04-09price $125,000 960-char remark
Show marketing remark (960 chars)
BACK ON THE MARKET NO FAULT TO SELLER! Experience urban living at its finest in this spacious 2-bedroom loft, perfectly situated in a gated community with covered parking for added convenience and security. This modern residence combines open-concept design with industrial charm—featuring high ceilings, and expansive windows. Just outside the highly sought-after Island View neighborhood, this loft offers the best of both worlds: vibrant city living with quick access to scenic green spaces. Enjoy being close to Detroit’s dining, entertainment, and waterfront attractions such as the River Walk, Eastern Market, West Village and Belle Isle while coming home to a private, well-maintained community that offers comfort and peace of mind. Whether you’re a professional, creator, or savvy investor, this property delivers the perfect balance of style, location, and lifestyle in the heart of Detroit’s growing downtown corridor. BATVAI
-
2026-03-26$135,000 Active 938-char remark
Show marketing remark (960 chars)
BACK ON THE MARKET NO FAULT TO SELLER! Experience urban living at its finest in this spacious 2-bedroom loft, perfectly situated in a gated community with covered parking for added convenience and security. This modern residence combines open-concept design with industrial charm—featuring high ceilings, and expansive windows. Just outside the highly sought-after Island View neighborhood, this loft offers the best of both worlds: vibrant city living with quick access to scenic green spaces. Enjoy being close to Detroit’s dining, entertainment, and waterfront attractions such as the River Walk, Eastern Market, West Village and Belle Isle while coming home to a private, well-maintained community that offers comfort and peace of mind. Whether you’re a professional, creator, or savvy investor, this property delivers the perfect balance of style, location, and lifestyle in the heart of Detroit’s growing downtown corridor. BATVAI
-
2026-03-26$135,000 Active 960-char remark
Show marketing remark (960 chars)
BACK ON THE MARKET NO FAULT TO SELLER! Experience urban living at its finest in this spacious 2-bedroom loft, perfectly situated in a gated community with covered parking for added convenience and security. This modern residence combines open-concept design with industrial charm—featuring high ceilings, and expansive windows. Just outside the highly sought-after Island View neighborhood, this loft offers the best of both worlds: vibrant city living with quick access to scenic green spaces. Enjoy being close to Detroit’s dining, entertainment, and waterfront attractions such as the River Walk, Eastern Market, West Village and Belle Isle while coming home to a private, well-maintained community that offers comfort and peace of mind. Whether you’re a professional, creator, or savvy investor, this property delivers the perfect balance of style, location, and lifestyle in the heart of Detroit’s growing downtown corridor. BATVAI
-
2026-03-01historical
-
2026-03-01historical
-
2026-01-18price $142,999
-
2026-01-18price $142,999
-
2025-11-17price $145,000
-
2025-11-17price $145,000
-
2025-11-10price $149,000
-
2025-11-10price $149,000
-
2025-10-22$149,999 Active
-
2025-10-22$149,999 Active
-
2010-09-07soldstatus $26,731
-
2009-08-13soldstatus $152,262
ⓘ Source: listings_history table (triggers on properties + properties_extension) + one-shot
backfill from property_details.listing_events for pre-trigger history.
Nearby sold comps map
Loading sold comps map…
Walkable amenities ~0.75 mi
Loading nearby amenities…
Taxation est. · year 1
- Rental income
- $19,965
- − Mortgage interest
- −$6,946
- − Property taxes
- −$1,860
- − Insurance
- −$620
- − Repairs & maintenance
- −$1,597
- − Management
- −$1,597
- − HOA
- −$9,300
- − Depreciation
- −$3,607
- Taxable loss
- −$5,562
- Est. tax savings @ 24.0%
- +$1,335
- After-tax cash flow
- $-2,476/yr
For passive investors: Depreciation is non-cash, so a rental often shows a tax loss while cash-flowing — sheltering income. Rental losses are passive: they offset passive income freely, and up to $25,000/yr can offset ordinary (W-2) income if you actively participate and your MAGI is under $100k (phasing out to $0 by $150k); unused losses carry forward. On sale, claimed depreciation is recaptured at up to 25%, and gains may owe capital-gains tax (a 1031 exchange can defer both). Figures are a year-1 estimate at your 24.0% rate — not tax advice; consult a CPA.
Schools (NCES district)
- District
- Detroit Public Schools Community District
- NCES district ID
- 2601103
- Math proficiency
- 10% ▼ -2.00%
- Reading proficiency
- 24% ▲ 6.00%
- Median HH income
- $25,815
- Composite
- 13.06/100
- National rank
- #9564
- State rank
- #499 of 540 in MI
Livability — Detroit
- Score
- 73/100
- State rank
- #218
- US rank
- #5427
Category grades
Schools grade is shown separately in the Schools card above.
Census & demographics
- Census place
- Detroit, MI
- County
- Wayne County · 1,562,939 people
- City population
- 572,865
- Metro
- Detroit-Warren-Dearborn, MI
- Population (ZIP)
- 20,848
- Household income
- $47,831
- Rent vs Own
- Severe rent burden
- 2017.0
Population outlook (Wayne County) Hauer SSP2
- Today (2025)
- 1,675,273 people
- By 2030
- 1,620,300 · -3.3%
- By 2040
- 1,502,341 · -10.3%
- By 2050
- 1,384,039 · -17.4%
- By 2075
- 1,124,592 · -32.9%
- By 2100
- 881,193 · -47.4%
Race, ethnicity, and origin ACS 2023
- Neighborhood character
- Predominantly Black (74%)
- Race & ethnicity
- Black 74% White 18% Two or more races 4% Asian 3% Hispanic / Latino 2%
- Common ancestry
- Romanian 2% Italian 1% Lithuanian 1%
- Foreign-born
- 5% · Canada, South Korea
- Languages at home
- 94% English-only · Spanish 2% Other Indo-European 1% Arabic 1%
Political lean MEDSL · Wayne
- 2024 margin
- Strong D (+29.0) · D 62.7% · R 33.7% · Other 3.6%
- 2008→2024 swing
- -20.5pp toward R · 2008: 49.5pp · 2024: 29.0pp
- All cycles
- 2024: D+29.0 2020: D+38.1 2016: D+37.3 2012: D+46.9 2008: D+49.5
Not yet ingested
- Civics
- —
Market trends
- HPI YoY
- ▼ -2.79%
- Current HPI
- 136.6328
- Rent YoY
- ▲ 3.53%
- Metro
- Detroit-Warren-Dearborn, MI
- State GDP YoY
- ▲ 1.37%
- F500 in state
- 28
Industry mix (Fortune 500 HQ in MI)
| Industry | F500 HQs | Revenue |
|---|---|---|
| Automotive Parts | 3 | $48B |
|
||
| Automotive | 2 | $372B |
|
||
| Chemicals | 1 | $45B |
|
||
| Automotive Retail | 1 | $29B |
|
||
| Healthcare / Medical Devices | 1 | $23B |
|
||
| Automotive Technology | 1 | $20B |
|
||
Price history
-17.9% since first listed16 events — show timeline
- 2026-04-09 Price Changed $125,000 MiRealSource-MiMLS
- 2026-04-09 Price Changed $125,000 REALCOMP
- 2026-03-26 Listed $135,000 REALCOMP
- 2026-03-26 Listed $135,000 MiRealSource-MiMLS
- 2026-03-01 Listing Removed — REALCOMP
- 2026-03-01 Listing Removed — MiRealSource-MiMLS
- 2026-01-18 Price Changed $142,999 MiRealSource-MiMLS
- 2026-01-18 Price Changed $142,999 REALCOMP
- 2025-11-17 Price Changed $145,000 MiRealSource-MiMLS
- 2025-11-17 Price Changed $145,000 REALCOMP
- 2025-11-10 Price Changed $149,000 MiRealSource-MiMLS
- 2025-11-10 Price Changed $149,000 REALCOMP
- 2025-10-22 Listed $149,999 REALCOMP
- 2025-10-22 Listed $149,999 MiRealSource-MiMLS
- 2010-09-07 Sold (Public Records) $26,731 Public Records
- 2009-08-13 Sold (Public Records) $152,262 Public Records
Property tax history
+27.4%/yrLatest (2025): $7,662 · +23.0% YoY. Source: county tax records.
Cash-flow waterfall
monthlySold comps — $/sqft
last 12 mo · ≤1 miLoading sold comps…