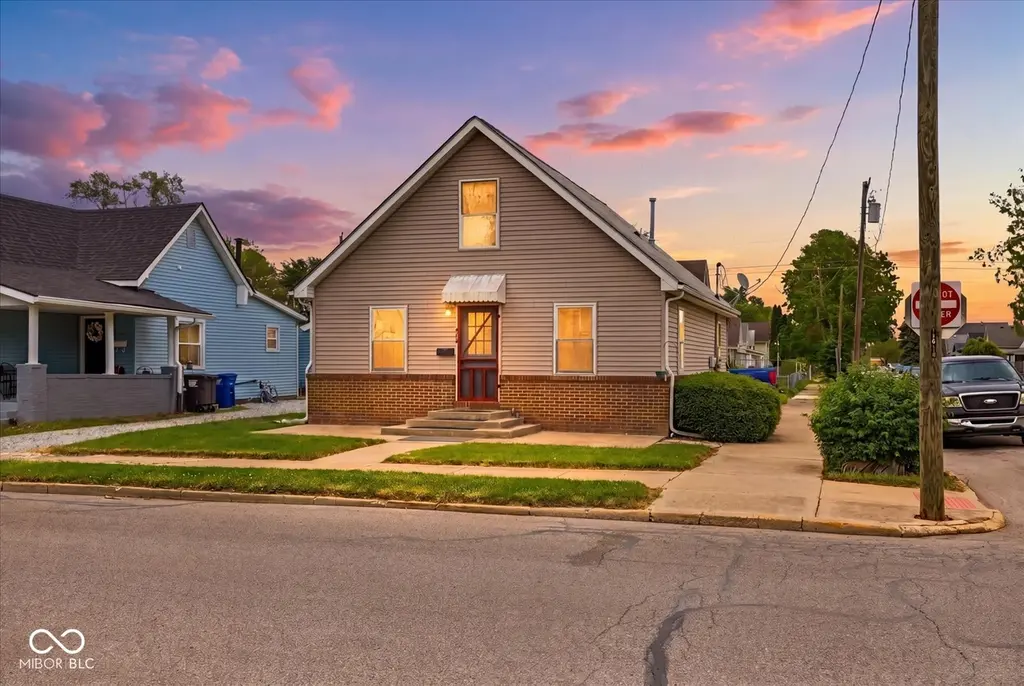
416 Montgomery St · Shelbyville, IN
Flood risk 1/10 · Minimal
- FEMA flood zone
- X (unshaded)
- Chance of flooding over 30 yrs
- 0.0%
- Est. flood insurance / yr
- $507 – $1,088
Fire risk 1/10 · Minimal
- Est. fire insurance / yr
- $717 – $1,331
Heat risk 4/10 · Minor
- Hot days now (above 102°F)
- 7 days/yr
- Hot days in 30 yrs
- 20 days/yr
Wind risk 2/10 · Minimal
- Chance of severe wind over 30 yrs
- 1.0%
Air-quality risk 2/10 · Minimal
- Unhealthy air days now
- 1 days/yr
- Unhealthy air days in 30 yrs
- 2 days/yr
Risk factors via First Street. Map © Google.
Why this score? — see what drove the B grade
The composite is a weighted blend of 9 inputs, each scored 0–100. Each bar is that input's sub-score; the figure is the points it added to the 100-point composite (weight × sub-score).
- Cash flow +29.8/30.0
- ARV discount +15.0/15.0
- DSCR +10.0/10.0
- 1% rule +7.6/10.0
- Schools +3.4/10.0
- Livability +3.2/5.0
- Rent growth +2.5/5.0
- Condition / age +2.5/5.0
- Appreciation +0.0/10.0
$139,900
🖨 Deal sheet 📄 Offer letter ✓ Due diligence
Listing remarks
This 4-bedroom, 2-bath home offers a great opportunity for an investor or buyer looking to build some sweat equity. Built in 2001 by Habitat for Humanity, this home features an eat-in kitchen with patio access to the backyard, a spacious living room with staircase, and two bedrooms conveniently located on the main level. Upstairs you'll find two additional bedrooms and a second full bath. With a little TLC and a good cleaning, this property has the potential to truly shine again. Home is being sold as-is and will require some repairs and updates, making it a great chance to add your own personal touches or investment improvements.
Key facts
- Eat-in kitchen
- Second full bath
- Patio access
Tags
Property features AI
Exterior
- Utilities: Public water; Municipal sewer connected; Electricity connected (200+ amp service); Natural gas connected
- Home design: Single-family residence; One-and-a-half stories; Facing west; Condition: fixer
- Construction: Vinyl siding; Crawl space foundation with block; Built/constructed by Habitat for Humanity
- Exterior features: Patio; Porch; Partial fencing; Corner lot with sidewalks; Has a view
Interior
- Kitchen: Dishwasher; Microwave with hood; Electric oven
- Bedrooms: Four bedrooms total — two on the main level and two on the upper level
- Bathrooms: Two full bathrooms — one on the main level and one on the upper level
- Heating & cooling: Forced air heating (natural gas); Central air conditioning
- Interior features: Eat-in kitchen; Formal living room; Utility room; Main-level laundry
- Laundry & utility: Main-level laundry
Neighborhood map
What this means for you Summary
Snapshot
- This is a 4-bed/2.0-bath single-family listed at $140k.
Deal economics
- At list price, monthly cash flow is $515 ($6k/yr) — positive.
- The deal already cash-flows at list — no discount required.
- Meets the 1% rule at list price ($2k rent vs $140k).
- Recommended offer: $136k (3.0% below list) — sets the bar for market timing.
- Cap rate 10.7% vs local median 4.3% in Shelbyville — top-decile yield for the area; either an underpriced asset or a hidden risk that comps aren't pricing in. Stress-test before assuming the spread holds.
Location & tenants
- Location reads 63/100 on livability (#450 in IN) — a middle-class / working-renter tenant base. Strengths: cost of living A+, housing A+, crime B; Watch: employment C-, amenities F, commute F.
- Shelbyville Central Schools (town): math 40% / reading 39% proficiency, ranked #148 of 301 in IN (top 49%) — families likely to look elsewhere, expect single-tenant / working-renter base with shorter leases.
- Zoned schools: Shelbyville Sr High School (math 31% / reading 60%, grade D-, #164 of 369 statewide, top 45%, 1,101 students, 57% FRL).
- Market conditions: 229 active listings in the ZIP; 1 comparable units currently listed for rent nearby; 285 units permitted in Shelby County in 2024 (147 in 5+ unit buildings).
- This rent runs 33% of the median local income ($65k/yr) — at the standard rent-burdened threshold; future hikes will face affordability resistance.
Forward outlook
- Local home prices are declining (-3.0%/yr); year-one equity from $967 of loan paydown is wiped out by about $4k of value loss. Plan a longer hold.
- Shelby County population projected to shrink 6% by 2050 — rents likely to lag national; underwrite the cash flow, not the appreciation.
- At projected returns (-3.0% appreciation + 3.0% rent growth), your $39k cash investment doubles in ~8 years — after that, you're playing with house money.
Negotiation context
- It's been on market 40 days — a 3% lower offer ($136k) is reasonable based on typical stale-listing flexibility.
- 3 sale attempts since 3y ago; this cycle's ask has dropped $18k (11%) from the opening price — seller is motivated, your offer sets the floor, not the list.
Questions for the listing agent
- It's been on market 40 days. Have you received any prior offers? Is the seller open to a 3% concession, seller financing, or rate buy-down credit?
- Is there a deadline driving the sale (1031 exchange, divorce, estate, relocation)? That informs how much negotiation room exists.
- Schools are D-rated, which usually means shorter tenancies and higher turnover. Who's the typical renter profile here, and what's been the actual vacancy rate?
- What's the average days-on-market for RENTAL listings here right now (not sales)? A rising rental-DOM trend means longer vacancies and softer asking-rent achievability than the comps imply.
- What's the recent tenant-quality profile in this submarket — average credit score on applications, eviction rate, late-payment / NSF rate, and stable-employment percentage? A property-management company in the area should have these aggregated.
- How much new for-sale + rental construction is in the pipeline within 1–3 miles? Heavy new supply typically softens prices + rents 12–24 months out; constrained supply supports both.
Investment metrics
- 1% rule
- 1.26% ✓
- Cap rate
- 10.71%
- Cash-on-cash
- 15.77%
- DSCR
- 1.70
- GRM
- 6.6
CMA / ARV
- ARV (median comp)
- $174,344
- List price
- $139,900
- Delta
- -19.76%
- Verdict
- UNDERPRICED
- Comps
- 20 within 1.0 mi
Show comp detail 12 sales within ~0.75 mi
| Address | Dist | Beds/Ba | Sqft | Sold | Price | $/sf | Match |
|---|---|---|---|---|---|---|---|
| 637 W South St | 0.09mi | 3/2.0 (-1) | 1,578 (-6%) | 5mo | $183,000 | $116 | 77 |
| 714 W Washington St | 0.19mi | 3/2.0 (-1) | 1,553 (-8%) | 5mo | $160,000 | $103 | 69 |
| 633 W Franklin St | 0.21mi | 3/1.5 (-1) | 1,626 (-3%) | 18mo | $140,000 | $86 | 63 |
| 618 Miller Ave | 0.19mi | 3/1.0 (-1) | 1,792 (+7%) | 12mo | $175,000 | $98 | 61 |
| 265 W South St | 0.35mi | 3/1.5 (-1) | 1,811 (+8%) | 6mo | $65,000 | $36 | 59 |
| 555 W Pennsylvania St | 0.38mi | 3/1.5 (-1) | 1,764 (+5%) | 10mo | $185,000 | $105 | 59 |
| 547 W Taylor St | 0.07mi | 3/1.0 (-1) | 1,482 (-12%) | 11mo | $187,000 | $126 | 59 |
| 614 S West St | 0.37mi | 3/1.5 (-1) | 1,626 (-3%) | 18mo | $165,900 | $102 | 55 |
| 31 W South St | 0.51mi | 3/2.0 (-1) | 1,585 (-6%) | 15mo | $168,500 | $106 | 49 |
| 206 W Boggstown Rd | 0.73mi | 4/2.0 | 1,845 (+10%) | 19mo | $400,000 | $217 | 34 |
| 50 W Pennsylvania St | 0.64mi | 4/2.0 | 1,920 (+14%) | 17mo | $195,000 | $102 | 33 |
| 225 E Taylor St | 0.74mi | 3/2.0 (-1) | 1,548 (-8%) | 18mo | $160,000 | $103 | 32 |
Match score weights: distance 35% · size 25% · config 20% · recency 20%. Top-matched comps best support the ARV.
Projected returns pro-forma
-3.0% appreciation · 3.0% rent growth · sell at horizon
- IRR
- 6.6%
- Equity multiple
- 1.26×
- Total profit
- $10,086
- Equity at exit
- $20,860
- IRR
- 15.9%
- Equity multiple
- 2.30×
- Total profit
- $50,891
- Equity at exit
- $12,096
Cash invested: $39,172 (down + closing). Projections, not guarantees.
Landlord ↔ Tenant lean methodology
- Overall (STATE)
- 90 Strongly Landlord-Friendly
- State Indiana
- 90 Strongly Landlord-Friendly · R+11
- County
- — inherits STATE
- City
- — inherits STATE
ZIP-level market 46176
- Home prices YoY
- -33.9%
- Active inventory
- 229
- Price-to-rent
- 6.6×
Monthly cashflow live
- Estimated rent
- $1,768 medium interval (Pro) →
- Mortgage (P&I)
- −$734
- Tax from tax record
- −$90 /mo · $1,081/yr
- Insurance
- −$58
- HOA
- −$0
- Vacancy / Maint / Mgmt
- −$371
- Net cashflow
- $515
Break-even live
UW: 25.0% down · 7.5% · 30yr · 1.5% tax · 5.0% vac · 8.0% maint · 8.0% mgmt
Financing live
Cash to close
- Down payment
- $34,975
- Closing costs
- $4,197
- Reserves months
- —
- Total cash needed
- —
Loan-product check · same deal, 3 products live
Conventional
25% down · 7.5% · 30yr
- Down + closing
- —
- Monthly P&I
- —
- Monthly cashflow
- —
- DSCR
- —
- Eligible?
- —
Personal DTI + credit; lowest rate.
DSCR
20% down · 8.5% · 30yr
- Down + closing
- —
- Monthly P&I
- —
- Monthly cashflow
- —
- DSCR
- —
- Eligible?
- —
No personal income docs; deal must DSCR.
Hard money
10% down · 12.0% · 12mo
- Down + closing
- —
- Monthly P&I
- —
- Monthly cashflow
- —
- DSCR
- —
- Eligible?
- —
Short-term bridge; refi at stabilization.
Rent comps 1 comps
| Address | Beds | Baths | Sqft | Rent | $/sqft | DOM | Units | Dist |
|---|---|---|---|---|---|---|---|---|
| 425 N Harrison St Shelbyville, IN | 3.0 | 1.0–2.0 | 909 | $1,882 | $2.07 | 1d | 7 | 0.74mi |
Listing history 18 events
-
2026-06-18days on market $139,900 Active 40 DOM
-
2026-06-17days on market $139,900 Active 39 DOM
-
2026-06-16days on market $139,900 Active 38 DOM
-
2026-06-15days on market $139,900 Active 37 DOM
-
2026-06-13days on market $139,900 Active 35 DOM
-
2026-06-13days on market $139,900 Active 34 DOM
-
2026-06-09pricedays on market $139,900 Active 31 DOM
-
2026-06-08days on market $158,000 Active 30 DOM
-
2026-06-07days on market $158,000 Active 29 DOM
-
2026-06-03days on market $158,000 Active 25 DOM
-
2026-06-02days on market $158,000 Active 24 DOM
-
2026-06-01days on market $158,000 Active 23 DOM
-
2026-05-31days on market $158,000 Active 22 DOM
-
2026-05-08$158,000 Active 641-char remark
-
2023-08-02status Active
-
2023-06-29status Pending
-
2023-06-22price $141,600
-
2023-06-06$151,600 Active
ⓘ Source: listings_history table (triggers on properties + properties_extension) + one-shot
backfill from property_details.listing_events for pre-trigger history.
Tax reassessment forecast IN · Partial reset (capped growth)
- Current annual tax
- $1,081 · $90/mo
- Projected year-2 tax
- $1,135 · $95/mo
- Expected delta
- +$54/yr (+$5/mo · 5.0%)
ⓘ Screening estimate from a state-policy table — verify with the county assessor before closing.
Climate risk First Street
- Flood 1/10 Low FEMA zone X (unshaded) · 0% chance over 30 yrs
- Wildfire 1/10 Low
- Heat 4/10 Moderate 7 d/yr ≥102°F today · 20 d/yr by 30 yrs out
- Wind 2/10 Low 100% chance of damaging wind over 30 yrs
- Air quality 2/10 Low 1 unhealthy d/yr today · 2 by 30 yrs out
Nearby sold comps map
Loading sold comps map…
Walkable amenities ~0.75 mi
Loading nearby amenities…
Taxation est. · year 1
- Rental income
- $21,216
- − Mortgage interest
- −$7,837
- − Property taxes
- −$1,081
- − Insurance
- −$700
- − Repairs & maintenance
- −$1,697
- − Management
- −$1,697
- − Depreciation
- −$4,070
- Taxable income
- $4,135
- Est. tax owed @ 24.0%
- −$992
- After-tax cash flow
- $5,184/yr
For passive investors: Depreciation is non-cash, so a rental often shows a tax loss while cash-flowing — sheltering income. Rental losses are passive: they offset passive income freely, and up to $25,000/yr can offset ordinary (W-2) income if you actively participate and your MAGI is under $100k (phasing out to $0 by $150k); unused losses carry forward. On sale, claimed depreciation is recaptured at up to 25%, and gains may owe capital-gains tax (a 1031 exchange can defer both). Figures are a year-1 estimate at your 24.0% rate — not tax advice; consult a CPA.
Schools (NCES district)
- District
- Shelbyville Central Schools
- NCES district ID
- 1810140
- Math proficiency
- 40% ▼ -10.00%
- Reading proficiency
- 39% ▼ -9.00%
- Median HH income
- $45,199
- Composite
- 33.63/100
- National rank
- #5402
- State rank
- #148 of 301 in IN
Livability — Shelbyville
- Score
- 63/100
- State rank
- #450
- US rank
- #16051
Category grades
Schools grade is shown separately in the Schools card above.
Census & demographics
- Census place
- Shelbyville, IN
- County
- Shelby County · 28,782 people
- City population
- 28,782
- Metro
- Indianapolis-Carmel-Anderson, IN
- Population (ZIP)
- 28,782
- Household income
- $65,182
- Rent vs Own
- Severe rent burden
- 921.0
Population outlook (Shelby County) Hauer SSP2
- Today (2025)
- 45,020 people
- By 2030
- 44,962 · -0.1%
- By 2040
- 44,126 · -2.0%
- By 2050
- 42,110 · -6.5%
- By 2075
- 37,131 · -17.5%
- By 2100
- 29,714 · -34.0%
Race, ethnicity, and origin ACS 2023
- Neighborhood character
- Predominantly White (88%)
- Race & ethnicity
- White 88% Hispanic / Latino 7% Two or more races 4% Black 2% Asian 1%
- Hispanic origin (detail)
- Mexican 5%
- Common ancestry
- Italian 2% Slovak 1% Lithuanian 1%
- Foreign-born
- 5% · Canada
- Languages at home
- 92% English-only · Spanish 5% German/W. Germanic 1% Other Asian/Pacific 1%
Political lean MEDSL · Shelby
- 2024 margin
- Solid R (+48.0) · D 25.1% · R 73.1% · Other 1.8%
- 2008→2024 swing
- -29.0pp toward R · 2008: -19.0pp · 2024: -48.0pp
- All cycles
- 2024: R+48.0 2020: R+47.7 2016: R+47.2 2012: R+33.5 2008: R+19.0
Not yet ingested
- Civics
- —
Market trends
- HPI YoY
- ▼ -116.59%
- Current HPI
- 227.6747
- Rent YoY
- —
- Metro
- Indianapolis-Carmel-Anderson, IN
- State GDP YoY
- ▲ 2.90%
- F500 in state
- 18
Industry mix (Fortune 500 HQ in IN)
| Industry | F500 HQs | Revenue |
|---|---|---|
| Industrial Machinery | 2 | $37B |
|
||
| Healthcare | 1 | $177B |
|
||
| Pharmaceuticals | 1 | $45B |
|
||
| Metals / Steel | 1 | $18B |
|
||
| Agriculture | 1 | $17B |
|
||
| Packaging | 1 | $12B |
|
||
Price history
-7.7% since first listed6 events — show timeline
- 2026-06-09 Price Changed $139,900 MIBOR as Distributed by MLS Grid
- 2026-05-08 Listed $158,000 MIBOR as Distributed by MLS Grid
- 2023-08-02 Relisted — MIBOR as Distributed by MLS Grid
- 2023-06-29 Pending — MIBOR as Distributed by MLS Grid
- 2023-06-22 Price Changed $141,600 MIBOR as Distributed by MLS Grid
- 2023-06-06 Listed $151,600 MIBOR as Distributed by MLS Grid
Property tax history
+1.4%/yrLatest (2025): $1,081 · -6.2% YoY. Source: county tax records.
Cash-flow waterfall
monthlySold comps — $/sqft
last 12 mo · ≤1 miLoading sold comps…