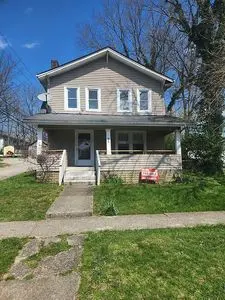
65 Fitch Ave · Winchester, KY
Flood risk 1/10 · Minimal
- FEMA flood zone
- X (unshaded)
- Chance of flooding over 30 yrs
- 0.0%
- Est. flood insurance / yr
- $507 – $1,088
Fire risk 3/10 · Minor
- Est. fire insurance / yr
- $839 – $1,559
Heat risk 4/10 · Minor
- Hot days now (above 101°F)
- 7 days/yr
- Hot days in 30 yrs
- 19 days/yr
Wind risk 2/10 · Minimal
- Chance of severe wind over 30 yrs
- 3.0%
Air-quality risk 2/10 · Minimal
- Unhealthy air days now
- 0 days/yr
- Unhealthy air days in 30 yrs
- 1 days/yr
Risk factors via First Street. Map © Google.
Why this score? — see what drove the C- grade
The composite is a weighted blend of 9 inputs, each scored 0–100. Each bar is that input's sub-score; the figure is the points it added to the 100-point composite (weight × sub-score).
- Cash flow +21.5/30.0
- ARV discount +7.5/15.0
- DSCR +6.9/10.0
- 1% rule +5.2/10.0
- Schools +3.0/10.0
- Livability +3.0/5.0
- Rent growth +2.5/5.0
- Condition / age +2.5/5.0
- Appreciation +0.0/10.0
$152,500
🖨 Deal sheet 📄 Offer letter ✓ Due diligence
Listing remarks
Lovely older home, located witin waking distance to collage park whice offers Pickle Ball, Pool, Tennis, play gound and Walking Trail, also walking distance to Historic Downtown Winchester, with a little love house brings large rooms and a nostlogic atmosphire, take a look, view today, this a a great price for 3 bedrooms, 1 1/2 baths, nice back yard, with parking, call today! Selling "AS IS", inspections welcome, the are no utilties on at the present, Estate Please make sure all doors are locked when you leave, buyer to verifye size of home & Lot
Key facts
- Large rooms
- Parking
- Nice back yard
Tags
Neighborhood map
What this means for you Summary
Snapshot
- This is a 3-bed/1.5-bath other listed at $152k.
Deal economics
- At list price, monthly cash flow is $230 ($3k/yr) — positive.
- The deal already cash-flows at list — no discount required.
- Meets the 1% rule at list price ($2k rent vs $152k).
- Cap rate 8.1% vs local median 4.0% in Winchester — top-decile yield for the area; either an underpriced asset or a hidden risk that comps aren't pricing in. Stress-test before assuming the spread holds.
Location & tenants
- Location reads 60/100 on livability (#393 in KY) — a middle-class / working-renter tenant base. Strengths: cost of living A+, housing A+; Watch: schools D+, amenities F, commute F.
- Clark County (town): math 28% / reading 41% proficiency, ranked #64 of 165 in KY (top 39%) — families likely to look elsewhere, expect single-tenant / working-renter base with shorter leases.
- Market conditions: 291 active listings in the ZIP; 10 comparable units currently listed for rent nearby; rentals at typical pace (median 14d on market — plan ~3-4 weeks tenant-placement turnaround); 160 units permitted in Clark County in 2024 (61 in 5+ unit buildings).
Forward outlook
- Local home prices are declining (-3.0%/yr); year-one equity from $1k of loan paydown is wiped out by about $5k of value loss. Plan a longer hold.
- Clark County population projected to shrink 7% by 2050 — rents likely to lag national; underwrite the cash flow, not the appreciation.
Negotiation context
- Only 2 days on market — expect competitive offers; lowballing is unlikely to land.
Risks & watch-outs
- Watch-outs: built in 1937 — expect roof / HVAC / electrical / plumbing capex.
Questions for the listing agent
- Built in 1937 — when were the roof, HVAC, electrical panel, plumbing, and water heater last replaced?
- Is there a deadline driving the sale (1031 exchange, divorce, estate, relocation)? That informs how much negotiation room exists.
- Schools are D-rated, which usually means shorter tenancies and higher turnover. Who's the typical renter profile here, and what's been the actual vacancy rate?
- What's the average days-on-market for RENTAL listings here right now (not sales)? A rising rental-DOM trend means longer vacancies and softer asking-rent achievability than the comps imply.
- What's the recent tenant-quality profile in this submarket — average credit score on applications, eviction rate, late-payment / NSF rate, and stable-employment percentage? A property-management company in the area should have these aggregated.
- How much new for-sale + rental construction is in the pipeline within 1–3 miles? Heavy new supply typically softens prices + rents 12–24 months out; constrained supply supports both.
Investment metrics
- 1% rule
- 1.02% ✓
- Cap rate
- 8.10%
- Cash-on-cash
- 6.47%
- DSCR
- 1.29
- GRM
- 8.2
CMA / ARV
No comps found within radius.
Projected returns pro-forma
-3.0% appreciation · 3.0% rent growth · sell at horizon
- IRR
- -6.4%
- Equity multiple
- 0.76×
- Total profit
- $-10,065
- Equity at exit
- $22,738
- IRR
- 3.3%
- Equity multiple
- 1.24×
- Total profit
- $10,069
- Equity at exit
- $13,185
Cash invested: $42,700 (down + closing). Projections, not guarantees.
Landlord ↔ Tenant lean methodology
- Overall (STATE)
- 83 Strongly Landlord-Friendly
- State Kentucky
- 83 Strongly Landlord-Friendly · R+16
- County
- — inherits STATE
- City
- — inherits STATE
ZIP-level market 40391
- Home prices YoY
- -17.0%
- Active inventory
- 291
- Price-to-rent
- 8.2×
Monthly cashflow live
- Estimated rent
- $1,557 high interval (Pro) →
- Mortgage (P&I)
- −$800
- Tax from tax record
- −$137 /mo · $1,643/yr
- Insurance
- −$64
- HOA
- −$0
- Vacancy / Maint / Mgmt
- −$327
- Net cashflow
- $230
Break-even live
UW: 25.0% down · 7.5% · 30yr · 1.5% tax · 5.0% vac · 8.0% maint · 8.0% mgmt
Financing live
Cash to close
- Down payment
- $38,125
- Closing costs
- $4,575
- Reserves months
- —
- Total cash needed
- —
Loan-product check · same deal, 3 products live
Conventional
25% down · 7.5% · 30yr
- Down + closing
- —
- Monthly P&I
- —
- Monthly cashflow
- —
- DSCR
- —
- Eligible?
- —
Personal DTI + credit; lowest rate.
DSCR
20% down · 8.5% · 30yr
- Down + closing
- —
- Monthly P&I
- —
- Monthly cashflow
- —
- DSCR
- —
- Eligible?
- —
No personal income docs; deal must DSCR.
Hard money
10% down · 12.0% · 12mo
- Down + closing
- —
- Monthly P&I
- —
- Monthly cashflow
- —
- DSCR
- —
- Eligible?
- —
Short-term bridge; refi at stabilization.
Rent comps 10 comps
| Address | Beds | Baths | Sqft | Rent | $/sqft | DOM | Units | Dist |
|---|---|---|---|---|---|---|---|---|
| 161 Milwood Dr Unit Na Winchester, KY | 3.0 | 2.0 | 1750 | $1,650 | $0.94 | 14d | 1 | 0.08mi |
| 25 Hays St Winchester, KY | 2.0 | 2.0 | 1250 | $1,300 | $1.04 | 23d | 1 | 0.16mi |
| 308 Graves St Winchester, KY | 3.0 | 1.5 | 1670 | $1,549 | $0.93 | 23d | 1 | 0.18mi |
| 204 S Maple St Winchester, KY | 2.0 | 1.0 | 1400 | $1,395 | $1.00 | 14d | 1 | 0.47mi |
| 136 Alabama St Winchester, KY | 3.0 | 1.0 | 1974 | $1,795 | $0.91 | 14d | 1 | 0.71mi |
| 502 Evans St Unit 3 Winchester, KY | 3.0 | 1.0 | 1200 | $1,400 | $1.17 | 23d | 1 | 0.72mi |
| 1071 Two Mile Rd Winchester, KY | 2.0 | 2.5 | 1100 | $1,299 | $1.18 | 14d | 1 | 0.96mi |
| 100 Sam Winston Way Winchester, KY | 2.0 | 2.5 | 1100 | $1,499 | $1.36 | 14d | 1 | 1.02mi |
| 135 Winn Ave Unit A Winchester, KY | 3.0 | 2.0 | 1600 | $1,800 | $1.12 | 14d | 1 | 1.07mi |
| 1419 Westwood Dr Winchester, KY | 3.0 | 2.5 | 1255 | $1,450 | $1.16 | 14d | 1 | 1.29mi |
Listing history 17 events
-
2026-06-18days on market $152,500 Active 2 DOM
-
2026-06-16remarks 565-char remark
-
2026-06-16pricedays on market $152,500 Active 1 DOM
-
2026-06-15days on market $179,900 Active 34 DOM
-
2026-06-14days on market $179,900 Active 32 DOM
-
2026-06-13days on market $179,900 Active 31 DOM
-
2026-06-10days on market $179,900 Active 29 DOM
-
2026-06-09days on market $179,900 Active 28 DOM
-
2026-06-08days on market $179,900 Active 27 DOM
-
2026-06-07days on market $179,900 Active 26 DOM
-
2026-06-05days on market $179,900 Active 23 DOM
-
2026-06-03days on market $179,900 Active 22 DOM
-
2026-06-02days on market $179,900 Active 21 DOM
-
2026-06-01days on market $179,900 Active 20 DOM
-
2026-05-31days on market $179,900 Active 19 DOM
-
2026-05-31days on market $179,900 Active 18 DOM
-
2026-05-12$179,900 Active
ⓘ Source: listings_history table (triggers on properties + properties_extension) + one-shot
backfill from property_details.listing_events for pre-trigger history.
Tax reassessment forecast KY · Resets to sale price
- Current annual tax
- $1,643 · $137/mo
- Projected year-2 tax
- $1,643 · $137/mo
- Expected delta
- $0/yr ($0/mo · 0.0%)
ⓘ Screening estimate from a state-policy table — verify with the county assessor before closing.
Climate risk First Street
- Flood 1/10 Low FEMA zone X (unshaded) · 0% chance over 30 yrs
- Wildfire 3/10 Moderate
- Heat 4/10 Moderate 7 d/yr ≥101°F today · 19 d/yr by 30 yrs out
- Wind 2/10 Low 3% chance of damaging wind over 30 yrs
- Air quality 2/10 Low 0 unhealthy d/yr today · 1 by 30 yrs out
Nearby sold comps map
Loading sold comps map…
Walkable amenities ~0.75 mi
Loading nearby amenities…
Taxation est. · year 1
- Rental income
- $18,688
- − Mortgage interest
- −$8,542
- − Property taxes
- −$1,643
- − Insurance
- −$762
- − Repairs & maintenance
- −$1,495
- − Management
- −$1,495
- − Depreciation
- −$4,436
- Taxable income
- $314
- Est. tax owed @ 24.0%
- −$75
- After-tax cash flow
- $2,686/yr
For passive investors: Depreciation is non-cash, so a rental often shows a tax loss while cash-flowing — sheltering income. Rental losses are passive: they offset passive income freely, and up to $25,000/yr can offset ordinary (W-2) income if you actively participate and your MAGI is under $100k (phasing out to $0 by $150k); unused losses carry forward. On sale, claimed depreciation is recaptured at up to 25%, and gains may owe capital-gains tax (a 1031 exchange can defer both). Figures are a year-1 estimate at your 24.0% rate — not tax advice; consult a CPA.
Schools (NCES district)
- District
- Clark County
- NCES district ID
- 2101200
- Math proficiency
- 28% ▼ -25.00%
- Reading proficiency
- 41% ▼ -18.00%
- Median HH income
- $47,282
- Composite
- 29.63/100
- National rank
- #6469
- State rank
- #64 of 165 in KY
Livability — Winchester
- Score
- 60/100
- State rank
- #393
- US rank
- #18931
Category grades
Schools grade is shown separately in the Schools card above.
Census & demographics
- Census place
- Winchester, KY
- County
- Clark County · 36,796 people
- City population
- 36,796
- Metro
- Lexington-Fayette, KY
- Population (ZIP)
- 36,796
- Household income
- $64,144
- Rent vs Own
- Severe rent burden
- 854.0
Population outlook (Clark County) Hauer SSP2
- Today (2025)
- 35,849 people
- By 2030
- 35,616 · -0.6%
- By 2040
- 34,727 · -3.1%
- By 2050
- 33,195 · -7.4%
- By 2075
- 29,439 · -17.9%
- By 2100
- 24,744 · -31.0%
Race, ethnicity, and origin ACS 2023
- Neighborhood character
- Predominantly White (88%)
- Race & ethnicity
- White 88% Black 4% Hispanic / Latino 4% Two or more races 3%
- Common ancestry
- Slovak 3% Italian 2% Serbian 2%
- Foreign-born
- 2% · Canada
- Languages at home
- 97% English-only · Spanish 2%
Political lean MEDSL · Clark
- 2024 margin
- Solid R (+35.3) · D 31.6% · R 66.9% · Other 1.6%
- 2008→2024 swing
- -10.3pp toward R · 2008: -25.1pp · 2024: -35.3pp
- All cycles
- 2024: R+35.3 2020: R+32.0 2016: R+37.1 2012: R+30.5 2008: R+25.1
Not yet ingested
- Civics
- —
Market trends
- HPI YoY
- ▼ -58.24%
- Current HPI
- 283.7839
- Rent YoY
- —
- Metro
- Lexington-Fayette, KY
- State GDP YoY
- ▲ 1.81%
- F500 in state
- 4
Industry mix (Fortune 500 HQ in KY)
| Industry | F500 HQs | Revenue |
|---|---|---|
| Healthcare | 1 | $118B |
|
||
| Food / Beverage | 1 | $7B |
|
||
Price history
1 event — show timeline
- 2026-05-12 Listed $179,900 FSBO.com
Property tax history
+7.7%/yrLatest (2025): $1,643 · +135.2% YoY. Source: county tax records.
Cash-flow waterfall
monthlySold comps — $/sqft
last 12 mo · ≤1 miLoading sold comps…