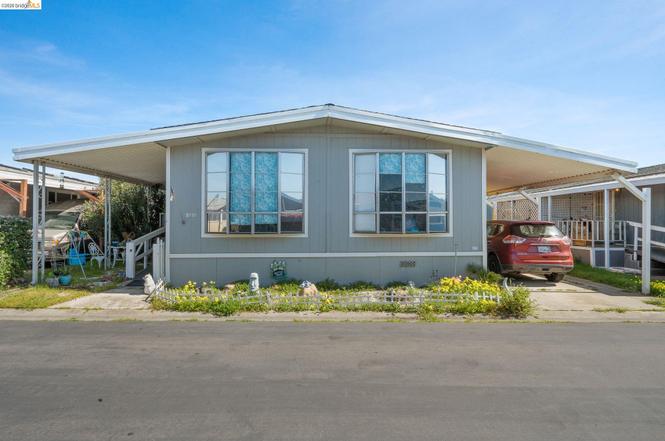
3701 Porter Cir · Bethel Island, CA
Flood risk 1/10 · Minimal
- FEMA flood zone
- AE
- Chance of flooding over 30 yrs
- 0.0%
- Est. flood insurance / yr
- $1,737 – $8,500
Fire risk 4/10 · Minor
- Est. fire insurance / yr
- $659 – $1,223
Heat risk 6/10 · Moderate
- Hot days now (above 101°F)
- 7 days/yr
- Hot days in 30 yrs
- 14 days/yr
Wind risk 1/10 · Minimal
- Chance of severe wind over 30 yrs
- —
Air-quality risk 10/10 · Severe
- Unhealthy air days now
- 21 days/yr
- Unhealthy air days in 30 yrs
- 23 days/yr
Risk factors via First Street. Map © Google.
Why this score? — see what drove the A- grade
The composite is a weighted blend of 9 inputs, each scored 0–100. Each bar is that input's sub-score; the figure is the points it added to the 100-point composite (weight × sub-score).
- Cash flow +30.0/30.0
- 1% rule +10.0/10.0
- DSCR +10.0/10.0
- Appreciation +10.0/10.0
- ARV discount +9.2/15.0
- Schools +3.4/10.0
- Rent growth +2.5/5.0
- Livability +2.5/5.0
- Condition / age +2.5/5.0
$175,999
🖨 Deal sheet 📄 Offer letter ✓ Due diligence
Listing remarks
Price Drop Spacious and well-maintained mobile home in a desirable waterfront, family-friendly park. Offering 1,536 sq ft of living space plus two enclosed bonus rooms, this home provides flexible options for a hobby room, workshop, or additional storage—with plenty of potential to customize to your needs. Functional floor plan with two large bedrooms on opposite ends for added privacy. Currently configured as a 3-bedroom, utilizing one of the enclosed sunrooms as an additional sleeping area. The oversized front bedroom features abundant natural light, mirrored closet doors, an attached bathroom, and a bonus area with potential to be partitioned to create a fourth bedroom if desired.
Key facts
- Attached bathroom
- Enclosed bonus rooms
- Ensuite bathroom
Tags
Property features AI
Finance
- HOA & community: Pets allowed upon approval; Community clubhouse; Community pool; Park name: THE WILLOWS
Exterior
- Parking: Awning for car
- Utilities: Public sewer
- Home design: Manufactured in park (mobile home); Double wide
- Construction: Wood siding
- Exterior features: Back yard; Side yard; Storage; Level lot
Interior
- Kitchen: Double oven; Gas range / cooktop
- Bedrooms: 2 bedrooms (street level)
- Flooring: Carpet
- Bathrooms: 2 full bathrooms
- Heating & cooling: Forced air heating; Central air; Ceiling fans
- Interior features: Bonus/plus room; Den; Window coverings; Mirrored closet doors
- Laundry & utility: Laundry room; Laundry facility (street level)
Neighborhood map
What this means for you Summary
Snapshot
- This is a 3-bed/2.0-bath manufactured listed at $176k.
Deal economics
- At list price, monthly cash flow is $2k ($24k/yr) — positive.
- The deal already cash-flows at list — no discount required.
- Meets the 1% rule at list price ($5k rent vs $176k).
- Recommended offer: $160k (9.0% below list) — sets the bar for market timing.
- Cap rate 23.0% vs local median 2.9% in Bethel Island — top-decile yield for the area; either an underpriced asset or a hidden risk that comps aren't pricing in. Stress-test before assuming the spread holds.
Location & tenants
- Location reads 49/100 on livability (#1,166 in CA) — a working-class tenant base; expect higher turnover. Strengths: crime A-; Watch: employment C-, schools F, amenities F.
- Oakley Union Elementary (suburban): math 26% / reading 40% proficiency, ranked #837 of 1,400 in CA (top 60%) — families likely to look elsewhere, expect single-tenant / working-renter base with shorter leases.
- Market conditions: 78 active listings in the ZIP; 2,169 units permitted in Contra Costa County in 2024 (896 in 5+ unit buildings).
Forward outlook
- In year one you build about $19k of equity ($1k loan paydown + $18k appreciation (10.0% local appreciation)).
- Contra Costa County population projected at +26% by 2050 — long-run rental-demand tailwind backs the buy-and-hold thesis.
- At projected returns (10.0% appreciation + 3.0% rent growth), your $49k cash investment doubles in ~2 years — after that, you're playing with house money.
- By year 2, paydown + projected appreciation supports a ~$30k cash-out refi (75% LTV) — recoverable capital for the next deal without selling this one.
Negotiation context
- It's been on market 109 days — a 9% lower offer ($160k) is reasonable based on typical stale-listing flexibility.
Risks & watch-outs
- Watch-outs: flood insurance adds $427/mo.
- Climate carrying-cost: in FEMA flood zone AE (mandatory federal flood insurance); extreme-heat days projected 7→14/yr by 2055 (HVAC capex compounding) — expect insurance premiums to compound above CPI over the hold.
Questions for the listing agent
- It's been on market 109 days. Have you received any prior offers? Is the seller open to a 9% concession, seller financing, or rate buy-down credit?
- What's the actual annual flood-insurance premium (NFIP or private), and is the property in a SFHA with mandatory coverage?
- Why hasn't it sold? Are there any deal-killer items the seller is aware of (foundation, flood, title, zoning, code violations)?
- Is there a deadline driving the sale (1031 exchange, divorce, estate, relocation)? That informs how much negotiation room exists.
- Schools are F-rated, which usually means shorter tenancies and higher turnover. Who's the typical renter profile here, and what's been the actual vacancy rate?
- What's the average days-on-market for RENTAL listings here right now (not sales)? A rising rental-DOM trend means longer vacancies and softer asking-rent achievability than the comps imply.
- What's the recent tenant-quality profile in this submarket — average credit score on applications, eviction rate, late-payment / NSF rate, and stable-employment percentage? A property-management company in the area should have these aggregated.
- How much new for-sale + rental construction is in the pipeline within 1–3 miles? Heavy new supply typically softens prices + rents 12–24 months out; constrained supply supports both.
Investment metrics
- 1% rule
- 2.64% ✓
- Cap rate
- 23.02%
- Cash-on-cash
- 59.73%
- DSCR
- 3.66
- GRM
- 3.2
CMA / ARV
- ARV (on-the-fly)
- $182,784
- Comps found
- 8
Show comp detail 8 sales within ~0.75 mi
| Address | Dist | Beds/Ba | Sqft | Sold | Price | $/sf | Match |
|---|---|---|---|---|---|---|---|
| 3513 Alcott Cir #134 | 0.04mi | 2/2.0 (-1) | 1,559 (+2%) | 15mo | $195,000 | $125 | 78 |
| 3702 Hawthorne | 0.05mi | 2/2.0 (-1) | 1,640 (+7%) | 5mo | $40,000 | $24 | 77 |
| 336 Alcott Ct #170 | 0.04mi | 3/2.0 | 1,344 (-12%) | 1mo | $129,000 | $96 | 77 |
| 3705 Hawthorne Dr #12 | 0.13mi | 3/2.0 | 1,648 (+7%) | 12mo | $215,000 | $130 | 72 |
| 3760 Porter Cir | 0.04mi | 3/2.0 | 1,344 (-12%) | 15mo | $159,900 | $119 | 64 |
| 3764 Porter Cir #22 | 0.48mi | 2/2.0 (-1) | 1,564 (+2%) | 9mo | $198,800 | $127 | 62 |
| 3621 Hawthorne Dr #110 | 0.18mi | 2/2.0 (-1) | 1,440 (-6%) | 19mo | $130,000 | $90 | 60 |
| 3757 Porter Cir #69 | 0.13mi | 3/2.0 | 1,344 (-12%) | 22mo | $80,000 | $60 | 55 |
Match score weights: distance 35% · size 25% · config 20% · recency 20%. Top-matched comps best support the ARV.
Projected returns pro-forma
10.0% appreciation · 3.0% rent growth · sell at horizon
- IRR
- 63.1%
- Equity multiple
- 5.57×
- Total profit
- $225,240
- Equity at exit
- $158,554
- IRR
- 56.7%
- Equity multiple
- 12.41×
- Total profit
- $562,467
- Equity at exit
- $341,927
Cash invested: $49,280 (down + closing). Projections, not guarantees.
Landlord ↔ Tenant lean methodology
- Overall (STATE)
- 18 Strongly Tenant-Friendly
- State California
- 18 Strongly Tenant-Friendly · D+13
- County
- — inherits STATE
- City
- — inherits STATE
ZIP-level market 94511
- Home prices YoY
- 4.6%
- Active inventory
- 78
- Price-to-rent
- 3.2×
Monthly cashflow live
- Estimated rent
- $4,644 medium interval (Pro) →
- Mortgage (P&I)
- −$923
- Tax est. 1.5%
- −$220 /mo · $2,640/yr
- Insurance
- −$73
- Flood insurance flood zone
- −$427 /mo · $5,118/yr
- HOA
- −$0
- Vacancy / Maint / Mgmt
- −$975
- Net cashflow
- $2,026
Break-even live
UW: 25.0% down · 7.5% · 30yr · 1.5% tax · 5.0% vac · 8.0% maint · 8.0% mgmt
Financing live
Cash to close
- Down payment
- $44,000
- Closing costs
- $5,280
- Reserves months
- —
- Total cash needed
- —
Loan-product check · same deal, 3 products live
Conventional
25% down · 7.5% · 30yr
- Down + closing
- —
- Monthly P&I
- —
- Monthly cashflow
- —
- DSCR
- —
- Eligible?
- —
Personal DTI + credit; lowest rate.
DSCR
20% down · 8.5% · 30yr
- Down + closing
- —
- Monthly P&I
- —
- Monthly cashflow
- —
- DSCR
- —
- Eligible?
- —
No personal income docs; deal must DSCR.
Hard money
10% down · 12.0% · 12mo
- Down + closing
- —
- Monthly P&I
- —
- Monthly cashflow
- —
- DSCR
- —
- Eligible?
- —
Short-term bridge; refi at stabilization.
Listing history 17 events
-
2026-06-18days on market $175,999 Active 109 DOM
-
2026-06-17days on market $175,999 Active 108 DOM
-
2026-06-16days on market $175,999 Active 107 DOM
-
2026-06-15days on market $175,999 Active 106 DOM
-
2026-06-13days on market $175,999 Active 104 DOM
-
2026-06-13days on market $175,999 Active 103 DOM
-
2026-06-09days on market $175,999 Active 100 DOM
-
2026-06-08days on market $175,999 Active 99 DOM
-
2026-06-07days on market $175,999 Active 98 DOM
-
2026-06-04days on market $175,999 Active 95 DOM
-
2026-06-03days on market $175,999 Active 94 DOM
-
2026-06-02days on market $175,999 Active 93 DOM
-
2026-06-01days on market $175,999 Active 92 DOM
-
2026-05-31days on market $175,999 Active 91 DOM
-
2026-05-22price $175,999
-
2026-04-06price $179,999
-
2026-03-02$185,000 Active
ⓘ Source: listings_history table (triggers on properties + properties_extension) + one-shot
backfill from property_details.listing_events for pre-trigger history.
Climate risk First Street
- Flood 1/10 Low FEMA zone AE · 0% chance over 30 yrs
- Wildfire 4/10 Moderate
- Heat 6/10 Major 7 d/yr ≥101°F today · 14 d/yr by 30 yrs out
- Wind 1/10 Low
- Air quality 10/10 Extreme 21 unhealthy d/yr today · 23 by 30 yrs out
Nearby sold comps map
Loading sold comps map…
Walkable amenities ~0.75 mi
Loading nearby amenities…
Taxation est. · year 1
- Rental income
- $55,733
- − Mortgage interest
- −$9,859
- − Property taxes
- −$2,640
- − Insurance
- −$5,998
- − Repairs & maintenance
- −$4,459
- − Management
- −$4,459
- − Depreciation
- −$5,120
- Taxable income
- $23,199
- Est. tax owed @ 24.0%
- −$5,568
- After-tax cash flow
- $18,747/yr
For passive investors: Depreciation is non-cash, so a rental often shows a tax loss while cash-flowing — sheltering income. Rental losses are passive: they offset passive income freely, and up to $25,000/yr can offset ordinary (W-2) income if you actively participate and your MAGI is under $100k (phasing out to $0 by $150k); unused losses carry forward. On sale, claimed depreciation is recaptured at up to 25%, and gains may owe capital-gains tax (a 1031 exchange can defer both). Figures are a year-1 estimate at your 24.0% rate — not tax advice; consult a CPA.
Schools (NCES district)
- District
- Oakley Union Elementary
- NCES district ID
- 0628080
- Math proficiency
- 26% ▬ 0.00%
- Reading proficiency
- 40% ▲ 1.00%
- Median HH income
- $77,903
- Composite
- 34.04/100
- National rank
- #10301
- State rank
- #837 of 1400 in CA
Livability — Bethel Island
- Score
- 49/100
- State rank
- #1166
- US rank
- #25883
Category grades
Schools grade is shown separately in the Schools card above.
Census & demographics
- Census place
- Bethel Island, CA
- City population
- 2,144
- Population (ZIP)
- 2,144
Population outlook (Contra Costa County) Hauer SSP2
- Today (2025)
- 1,287,720 people
- By 2030
- 1,364,937 · +6.0%
- By 2040
- 1,506,209 · +17.0%
- By 2050
- 1,624,373 · +26.1%
- By 2075
- 1,853,193 · +43.9%
- By 2100
- 1,901,231 · +47.6%
Race, ethnicity, and origin ACS 2023
- Neighborhood character
- Predominantly White (67%)
- Race & ethnicity
- White 67% Hispanic / Latino 25% Asian 6% Two or more races 3% Pacific Islander 2%
- Hispanic origin (detail)
- Mexican 25%
- Common ancestry
- Slovak 5% Serbian 2% Portuguese 2%
- Foreign-born
- 27% · Canada, South Korea, China
- Languages at home
- 77% English-only · Spanish 20% Other Asian/Pacific 2% Chinese 1%
Political lean MEDSL · Contra Costa
- 2024 margin
- Solid D (+38.0) · D 67.3% · R 29.4% · Other 3.3%
- 2008→2024 swing
- +0.2pp no change · 2008: 37.8pp · 2024: 38.0pp
- All cycles
- 2024: D+38.0 2020: D+45.3 2016: D+43.5 2012: D+33.7 2008: D+37.8
Not yet ingested
- Civics
- —
Market trends
- HPI YoY
- ▲ 13.77%
- Current HPI
- 312.0698
- Rent YoY
- —
- Metro
- —
- State GDP YoY
- ▲ 3.21%
- F500 in state
- 116
Industry mix (Fortune 500 HQ in CA)
| Industry | F500 HQs | Revenue |
|---|---|---|
| Technology | 27 | $1,492B |
|
||
| Financial Services | 3 | $174B |
|
||
| Retail | 3 | $44B |
|
||
| Insurance | 3 | $26B |
|
||
| Media / Entertainment | 2 | $115B |
|
||
| Pharmaceuticals / Biotech | 2 | $62B |
|
||
Price history
-4.9% since first listed3 events — show timeline
- 2026-05-22 Price Changed $175,999 bridgeMLS, Bay East AOR, or Contra Costa AOR
- 2026-04-06 Price Changed $179,999 bridgeMLS, Bay East AOR, or Contra Costa AOR
- 2026-03-02 Listed $185,000 bridgeMLS, Bay East AOR, or Contra Costa AOR
Property tax history
+0.8%/yrLatest (2025): $297 · +2.8% YoY. Source: county tax records.
Cash-flow waterfall
monthlySold comps — $/sqft
last 12 mo · ≤1 miLoading sold comps…