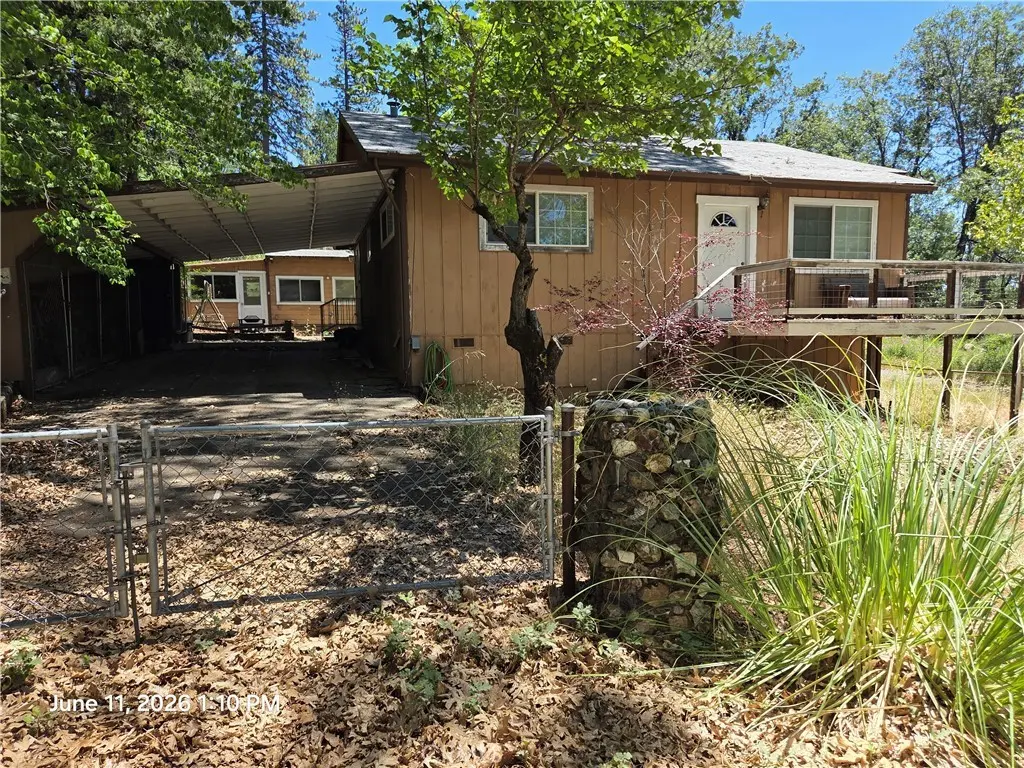
10498 Redwood Rd · Cobb, CA
Flood risk 1/10 · Minimal
- FEMA flood zone
- D
- Chance of flooding over 30 yrs
- 0.0%
- Est. flood insurance / yr
- $544 – $1,084
Fire risk 10/10 · Severe
- Est. fire insurance / yr
- $659 – $1,223
Heat risk 3/10 · Minor
- Hot days now (above 97°F)
- 7 days/yr
- Hot days in 30 yrs
- 13 days/yr
Wind risk 1/10 · Minimal
- Chance of severe wind over 30 yrs
- —
Air-quality risk 10/10 · Severe
- Unhealthy air days now
- 32 days/yr
- Unhealthy air days in 30 yrs
- 34 days/yr
Risk factors via First Street. Map © Google.
Why this score? — see what drove the C- grade
The composite is a weighted blend of 9 inputs, each scored 0–100. Each bar is that input's sub-score; the figure is the points it added to the 100-point composite (weight × sub-score).
- Cash flow +15.6/30.0
- ARV discount +15.0/15.0
- DSCR +4.8/10.0
- Appreciation +4.7/10.0
- 1% rule +3.2/10.0
- Livability +3.0/5.0
- Rent growth +2.5/5.0
- Schools +2.5/10.0
- Condition / age +2.5/5.0
$250,000
🖨 Deal sheet 📄 Offer letter ✓ Due diligence
Listing remarks
Loch Lomond vacation home with additional cottage. Needs some work but priced right. Live in one and rent the other. Close to Loch Lomond pool and restaurant.
Key facts
- 7,841 sq ft lot
- Built 1966
- Listed 11 days
Property features AI
Exterior
- Parking: Driveway-level parking; Attached carport
- Utilities: Septic tank
- Home design: Cabin-style property; Single-story; Property includes an accessory dwelling unit (ADU); total of 2 units; Has a view
- Construction: Guest house on the property
- Exterior features: Corner lot; Lot level with street; Flat/level lot; Recreational community features nearby including watersports, golf, biking, hiking, access to BLM/National Forest and a lake; No pool
Interior
- Kitchen: Electric range
- Bedrooms: 3 bedrooms on the main level
- Bathrooms: 2 full bathrooms on the main level
- Heating & cooling: Wood stove heating; Baseboard heating
- Interior features: One-level layout; All bedrooms on the main level; Living room; Entry from the carport; Has fireplace in the living room; Main level includes 2 bathrooms
- Laundry & utility: Indoor laundry with washer hookup; Electric dryer hookup
Neighborhood map
What this means for you Summary
Snapshot
- This is a 1-bed/1.0-bath single-family listed at $250k.
Deal economics
- At list price, monthly cash flow is $104 ($1k/yr) — positive.
- The deal already cash-flows at list — no discount required.
- To meet the 1% rule (rent ≥ 1% of price), the offer needs to be $204k (18.3% below list).
- Recommended offer: $204k (18.3% below list) — sets the bar for 1% rule.
- Cap rate 6.8% vs local median 5.3% in Cobb — meaningfully above typical; check what's discounted (condition, days-on-market, listing class) to confirm the premium yield is real.
Location & tenants
- Location reads 60/100 on livability (#589 in CA) — a middle-class / working-renter tenant base. Strengths: housing A+, employment A-; Watch: health & safety C-, crime F, amenities F.
- Kelseyville Unified (town): math 18% / reading 33% proficiency, ranked #1,150 of 1,400 in CA (top 82%) — low school quality limits family demand, transient renter base, plan for 1-2y turnover; 68% free/reduced lunch — lower-income household profile, screen leases tightly.
- Market conditions: 65 active listings in the ZIP; 107 units permitted in Lake County in 2024 (40 in 5+ unit buildings).
Forward outlook
- In year one you build about $147 of equity ($2k loan paydown + $-2k appreciation (-0.6% local appreciation)).
- Lake County population projected at -15% by 2050 — secular population decline; favor cash flow + early exit over multi-decade hold.
Negotiation context
- Only 12 days on market — expect competitive offers; lowballing is unlikely to land.
Risks & watch-outs
- Climate carrying-cost: severe wildfire risk — expect insurance premiums to compound above CPI over the hold.
Questions for the listing agent
- Built in 1966 — when were the roof, HVAC, electrical panel, plumbing, and water heater last replaced?
- Is there a deadline driving the sale (1031 exchange, divorce, estate, relocation)? That informs how much negotiation room exists.
- Crime grade is F in this area — have there been break-ins, vandalism, or insurance claims at this property in the last 3 years? What carrier currently insures it and at what premium?
- What's the average days-on-market for RENTAL listings here right now (not sales)? A rising rental-DOM trend means longer vacancies and softer asking-rent achievability than the comps imply.
- What's the recent tenant-quality profile in this submarket — average credit score on applications, eviction rate, late-payment / NSF rate, and stable-employment percentage? A property-management company in the area should have these aggregated.
- How much new for-sale + rental construction is in the pipeline within 1–3 miles? Heavy new supply typically softens prices + rents 12–24 months out; constrained supply supports both.
Investment metrics
- 1% rule
- 0.82% ✗
- Cap rate
- 6.79%
- Cash-on-cash
- 1.78%
- DSCR
- 1.08
- GRM
- 10.2
CMA / ARV
- ARV (on-the-fly)
- $301,056
- Comps found
- 1
Show comp detail 1 sale within ~0.75 mi
| Address | Dist | Beds/Ba | Sqft | Sold | Price | $/sf | Match |
|---|---|---|---|---|---|---|---|
| 12236 Western Pne | 0.43mi | 2/2.0 (+1) | 950 (-7%) | 2mo | $279,000 | $294 | 57 |
Match score weights: distance 35% · size 25% · config 20% · recency 20%. Top-matched comps best support the ARV.
Projected returns pro-forma
-0.63% appreciation · 3.0% rent growth · sell at horizon
- IRR
- -2.6%
- Equity multiple
- 0.88×
- Total profit
- $-8,125
- Equity at exit
- $64,787
- IRR
- 3.7%
- Equity multiple
- 1.37×
- Total profit
- $25,783
- Equity at exit
- $71,892
Cash invested: $70,000 (down + closing). Projections, not guarantees.
Landlord ↔ Tenant lean methodology
- Overall (STATE)
- 18 Strongly Tenant-Friendly
- State California
- 18 Strongly Tenant-Friendly · D+13
- County
- — inherits STATE
- City
- — inherits STATE
ZIP-level market 95426
- Home prices YoY
- -0.4%
- Active inventory
- 65
- Price-to-rent
- 10.2×
Monthly cashflow live
- Estimated rent
- $2,043 medium interval (Pro) →
- Mortgage (P&I)
- −$1,311
- Tax from tax record
- −$95 /mo · $1,136/yr
- Insurance
- −$104
- HOA
- −$0
- Vacancy / Maint / Mgmt
- −$429
- Net cashflow
- $104
Break-even live
UW: 25.0% down · 7.5% · 30yr · 1.5% tax · 5.0% vac · 8.0% maint · 8.0% mgmt
Financing live
Cash to close
- Down payment
- $62,500
- Closing costs
- $7,500
- Reserves months
- —
- Total cash needed
- —
Loan-product check · same deal, 3 products live
Conventional
25% down · 7.5% · 30yr
- Down + closing
- —
- Monthly P&I
- —
- Monthly cashflow
- —
- DSCR
- —
- Eligible?
- —
Personal DTI + credit; lowest rate.
DSCR
20% down · 8.5% · 30yr
- Down + closing
- —
- Monthly P&I
- —
- Monthly cashflow
- —
- DSCR
- —
- Eligible?
- —
No personal income docs; deal must DSCR.
Hard money
10% down · 12.0% · 12mo
- Down + closing
- —
- Monthly P&I
- —
- Monthly cashflow
- —
- DSCR
- —
- Eligible?
- —
Short-term bridge; refi at stabilization.
Listing history 10 events
-
2026-06-19days on market $250,000 Coming Soon 12 DOM
-
2026-06-18days on market $250,000 Coming Soon 11 DOM
-
2026-06-17days on market $250,000 Coming Soon 10 DOM
-
2026-06-16days on market $250,000 Coming Soon 9 DOM
-
2026-06-15days on market $250,000 Coming Soon 8 DOM
-
2026-06-14days on market $250,000 Coming Soon 6 DOM
-
2026-06-12days on market $250,000 Coming Soon 5 DOM
-
2026-06-09days on market $250,000 Coming Soon 2 DOM
-
2026-06-07remarks 158-char remark
-
2026-06-07$250,000 Coming Soon 1 DOM
ⓘ Source: listings_history table (triggers on properties + properties_extension) + one-shot
backfill from property_details.listing_events for pre-trigger history.
Tax reassessment forecast CA · Resets to sale price
- Current annual tax
- $1,136 · $95/mo
- Projected year-2 tax
- $1,900 · $158/mo
- Expected delta
- +$764/yr (+$64/mo · 67.2%)
ⓘ Screening estimate from a state-policy table — verify with the county assessor before closing.
Climate risk First Street
- Flood 1/10 Low FEMA zone D · 0% chance over 30 yrs
- Wildfire 10/10 Extreme
- Heat 3/10 Moderate 7 d/yr ≥97°F today · 13 d/yr by 30 yrs out
- Wind 1/10 Low
- Air quality 10/10 Extreme 32 unhealthy d/yr today · 34 by 30 yrs out
Nearby sold comps map
Loading sold comps map…
Walkable amenities ~0.75 mi
Loading nearby amenities…
Taxation est. · year 1
- Rental income
- $24,516
- − Mortgage interest
- −$14,004
- − Property taxes
- −$1,136
- − Insurance
- −$1,250
- − Repairs & maintenance
- −$1,961
- − Management
- −$1,961
- − Depreciation
- −$7,273
- Taxable loss
- −$3,070
- Est. tax savings @ 24.0%
- +$737
- After-tax cash flow
- $1,986/yr
For passive investors: Depreciation is non-cash, so a rental often shows a tax loss while cash-flowing — sheltering income. Rental losses are passive: they offset passive income freely, and up to $25,000/yr can offset ordinary (W-2) income if you actively participate and your MAGI is under $100k (phasing out to $0 by $150k); unused losses carry forward. On sale, claimed depreciation is recaptured at up to 25%, and gains may owe capital-gains tax (a 1031 exchange can defer both). Figures are a year-1 estimate at your 24.0% rate — not tax advice; consult a CPA.
Schools (NCES district)
- District
- Kelseyville Unified
- NCES district ID
- 0619320
- Math proficiency
- 18% ▼ -1.00%
- Reading proficiency
- 33% ▲ 4.00%
- Median HH income
- $47,210
- Composite
- 25.19/100
- National rank
- #12920
- State rank
- #1150 of 1400 in CA
Livability — Cobb
- Score
- 60/100
- State rank
- #589
- US rank
- #19147
Category grades
Schools grade is shown separately in the Schools card above.
Census & demographics
- City population
- 1,265
- Population (ZIP)
- 1,265
Population outlook (Lake County) Hauer SSP2
- Today (2025)
- 62,396 people
- By 2030
- 60,626 · -2.8%
- By 2040
- 56,453 · -9.5%
- By 2050
- 53,054 · -15.0%
- By 2075
- 47,663 · -23.6%
- By 2100
- 41,804 · -33.0%
Race, ethnicity, and origin ACS 2023
- Neighborhood character
- Predominantly White (91%)
- Race & ethnicity
- White 91% Hispanic / Latino 6% Pacific Islander 3%
- Hispanic origin (detail)
- Mexican 6%
- Common ancestry
- Lithuanian 11% Iranian 4% Italian 2%
- Foreign-born
- 5%
- Languages at home
- 91% English-only · Spanish 6% Other Asian/Pacific 3%
Political lean MEDSL · Lake
- 2024 margin
- Toss-up / Even · D 47.8% · R 49.2% · Other 3.0%
- 2008→2024 swing
- -20.6pp toward R · 2008: 19.3pp · 2024: -1.4pp
- All cycles
- 2024: R+1.4 2020: D+6.3 2016: D+3.7 2012: D+16.5 2008: D+19.3
Not yet ingested
- Civics
- —
Market trends
- HPI YoY
- ▼ -0.63%
- Current HPI
- 145.2378
- Rent YoY
- —
- Metro
- —
- State GDP YoY
- ▲ 3.21%
- F500 in state
- 116
Industry mix (Fortune 500 HQ in CA)
| Industry | F500 HQs | Revenue |
|---|---|---|
| Technology | 27 | $1,492B |
|
||
| Financial Services | 3 | $174B |
|
||
| Retail | 3 | $44B |
|
||
| Insurance | 3 | $26B |
|
||
| Media / Entertainment | 2 | $115B |
|
||
| Pharmaceuticals / Biotech | 2 | $62B |
|
||
Price history
1 event — show timeline
- 2026-06-07 Coming Soon $250,000 CRMLS
Property tax history
+3.4%/yrLatest (2025): $1,136 · +1.9% YoY. Source: county tax records.
Cash-flow waterfall
monthlySold comps — $/sqft
last 12 mo · ≤1 miLoading sold comps…