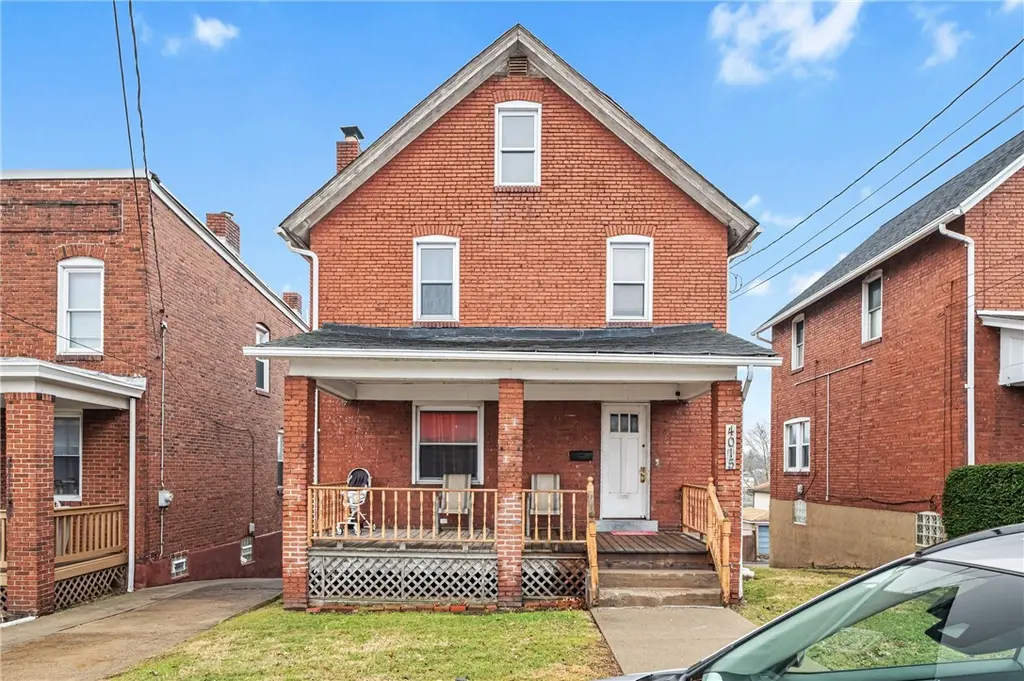
4015 Center Ave · Munhall, PA
Flood risk 1/10 · Minimal
- FEMA flood zone
- X (unshaded)
- Chance of flooding over 30 yrs
- 0.0%
- Est. flood insurance / yr
- $473 – $860
Fire risk 1/10 · Minimal
- Est. fire insurance / yr
- $511 – $949
Heat risk 4/10 · Minor
- Hot days now (above 96°F)
- 7 days/yr
- Hot days in 30 yrs
- 17 days/yr
Wind risk 2/10 · Minimal
- Chance of severe wind over 30 yrs
- 0.0%
Air-quality risk 4/10 · Minor
- Unhealthy air days now
- 4 days/yr
- Unhealthy air days in 30 yrs
- 5 days/yr
Risk factors via First Street. Map © Google.
Why this score? — see what drove the B- grade
The composite is a weighted blend of 9 inputs, each scored 0–100. Each bar is that input's sub-score; the figure is the points it added to the 100-point composite (weight × sub-score).
- Cash flow +25.1/30.0
- ARV discount +15.0/15.0
- DSCR +8.2/10.0
- 1% rule +7.1/10.0
- Livability +3.9/5.0
- Rent growth +3.5/5.0
- Schools +3.1/10.0
- Condition / age +2.5/5.0
- Appreciation +0.0/10.0
$149,900
🖨 Deal sheet 📄 Offer letter ✓ Due diligence
Listing remarks MLS
2 story brick with full covered front porch, 2 car detached garage and rear fenced yard. Livingroom features decorative stone fireplace.
Key facts
- Covered front porch
- Off street parking
- Fenced rear yard
Tags
Property features AI
Exterior
- Parking: Off-street parking for 2 vehicles
- Utilities: Public water; Public sewer
- Home design: 2 stories; Resale property; Brick construction
- Construction: Brick exterior
- Exterior features: Public transportation access
Interior
- Flooring: Carpet; Laminate
- Bathrooms: 1 full bathroom
- Heating & cooling: Forced air heating (gas); Central air conditioning
- Interior features: Decorative fireplace (1); Basement
Neighborhood map
What this means for you Summary
Snapshot
- This is a 4-bed/1.5-bath single-family listed at $150k.
Deal economics
- At list price, monthly cash flow is $332 ($4k/yr) — positive.
- The deal already cash-flows at list — no discount required.
- Meets the 1% rule at list price ($2k rent vs $150k).
- Recommended offer: $148k (1.5% below list) — sets the bar for market timing.
- Cap rate 8.9% vs local median 7.3% in Munhall — meaningfully above typical; check what's discounted (condition, days-on-market, listing class) to confirm the premium yield is real.
Location & tenants
- Location reads 78/100 on livability (#308 in PA, #2,734 nationally) — a middle-class / working-renter tenant base. Strengths: cost of living A+, housing A+, crime A; Watch: employment D+, amenities F.
- Steel Valley SD (suburban): math 29% / reading 45% proficiency, ranked #403 of 539 in PA (top 75%) — families likely to look elsewhere, expect single-tenant / working-renter base with shorter leases.
- Market conditions: Rents rising fast (+4.1%/yr); 92 active listings in the ZIP; 4 comparable units currently listed for rent nearby; rentals at typical pace (median 21d on market — plan ~3-4 weeks tenant-placement turnaround); 2,996 units permitted in Allegheny County in 2024 (1,588 in 5+ unit buildings).
- This rent runs 39% of the median local income ($56k/yr) — at the standard rent-burdened threshold; future hikes will face affordability resistance.
Forward outlook
- Local home prices are declining (-3.0%/yr); year-one equity from $1k of loan paydown is wiped out by about $4k of value loss. Plan a longer hold.
- At projected returns (-3.0% appreciation + 4.1% rent growth), your $42k cash investment doubles in ~10 years — after that, you're playing with house money.
Negotiation context
- It's been on market 28 days — a 2% lower offer ($148k) is reasonable based on typical stale-listing flexibility.
- 4 sale attempts since 27y ago with the ask held roughly flat each time — persistent listings suggest the price (not the market) is what's stuck; bring a comps-based counter.
- Current owner paid $47k; list at $150k implies a 219% gain — meaningful room to come down on a strong offer.
Risks & watch-outs
- Watch-outs: built in 1920 — expect roof / HVAC / electrical / plumbing capex.
Questions for the listing agent
- Built in 1920 — when were the roof, HVAC, electrical panel, plumbing, and water heater last replaced?
- Is there a deadline driving the sale (1031 exchange, divorce, estate, relocation)? That informs how much negotiation room exists.
- Schools are B-rated — typically a magnet for longer-tenancy family renters. What's the average tenant stay here, and is there a school-zone premium baked into asking?
- What's the average days-on-market for RENTAL listings here right now (not sales)? A rising rental-DOM trend means longer vacancies and softer asking-rent achievability than the comps imply.
- What's the recent tenant-quality profile in this submarket — average credit score on applications, eviction rate, late-payment / NSF rate, and stable-employment percentage? A property-management company in the area should have these aggregated.
- How much new for-sale + rental construction is in the pipeline within 1–3 miles? Heavy new supply typically softens prices + rents 12–24 months out; constrained supply supports both.
Investment metrics
- 1% rule
- 1.21% ✓
- Cap rate
- 8.95%
- Cash-on-cash
- 9.48%
- DSCR
- 1.42
- GRM
- 6.9
CMA / ARV
- ARV (on-the-fly)
- $255,535
- Comps found
- 12
Show comp detail 12 sales within ~0.75 mi
| Address | Dist | Beds/Ba | Sqft | Sold | Price | $/sf | Match |
|---|---|---|---|---|---|---|---|
| 4635 Main St | 0.39mi | 4/2.5 | 1,760 (+3%) | 6mo | $250,000 | $142 | 69 |
| 3508 Cambria St | 0.35mi | 3/1.0 (-1) | 1,600 (-7%) | 3mo | $157,500 | $98 | 63 |
| 517 Brierly Ln | 0.43mi | 3/2.5 (-1) | 1,544 (-10%) | 3mo | $279,900 | $181 | 52 |
| 2806 Main St | 0.67mi | 4/2.0 | 1,869 (+9%) | 0mo | $257,500 | $138 | 52 |
| 4803 Aspen St | 0.53mi | 3/2.0 (-1) | 1,541 (-10%) | 3mo | $250,000 | $162 | 49 |
| 252 Gates Dr | 0.70mi | 3/2.0 (-1) | 1,780 (+4%) | 7mo | $350,000 | $197 | 48 |
| 4374 Homestead Duquesne Rd | 0.54mi | 3/2.5 (-1) | 1,534 (-11%) | 1mo | $218,000 | $142 | 48 |
| 4839 Lougean Ave | 0.62mi | 3/2.5 (-1) | 1,548 (-10%) | 4mo | $225,000 | $145 | 43 |
| 418 Diller Ave | 0.59mi | 3/2.0 (-1) | 1,492 (-13%) | 1mo | $255,000 | $171 | 43 |
| 409 Victoria St | 0.72mi | 3/1.0 (-1) | 1,545 (-10%) | 1mo | $230,000 | $149 | 42 |
| 127 Marham Rd | 0.74mi | 3/2.5 (-1) | 1,579 (-8%) | 4mo | $220,000 | $139 | 40 |
| 145 Marham Rd | 0.73mi | 4/2.0 | 1,488 (-13%) | 3mo | $235,000 | $158 | 39 |
Match score weights: distance 35% · size 25% · config 20% · recency 20%. Top-matched comps best support the ARV.
Projected returns pro-forma
-3.0% appreciation · 4.06% rent growth · sell at horizon
- IRR
- -0.7%
- Equity multiple
- 0.97×
- Total profit
- $-1,155
- Equity at exit
- $22,351
- IRR
- 10.1%
- Equity multiple
- 1.83×
- Total profit
- $34,649
- Equity at exit
- $12,961
Cash invested: $41,972 (down + closing). Projections, not guarantees.
Landlord ↔ Tenant lean methodology
- Overall (STATE)
- 62 Landlord-Friendly
- State Pennsylvania
- 62 Landlord-Friendly · EVEN
- County
- — inherits STATE
- City
- — inherits STATE
ZIP-level market 15120
- Home prices YoY
- -16.9%
- Rents YoY
- 4.1%
- Active inventory
- 92
- Price-to-rent
- 6.9×
Monthly cashflow live
- Estimated rent
- $1,813 medium interval (Pro) →
- Mortgage (P&I)
- −$786
- Tax from tax record
- −$252 /mo · $3,028/yr
- Insurance
- −$62
- HOA
- −$0
- Vacancy / Maint / Mgmt
- −$381
- Net cashflow
- $332
Break-even live
UW: 25.0% down · 7.5% · 30yr · 1.5% tax · 5.0% vac · 8.0% maint · 8.0% mgmt
Financing live
Cash to close
- Down payment
- $37,475
- Closing costs
- $4,497
- Reserves months
- —
- Total cash needed
- —
Loan-product check · same deal, 3 products live
Conventional
25% down · 7.5% · 30yr
- Down + closing
- —
- Monthly P&I
- —
- Monthly cashflow
- —
- DSCR
- —
- Eligible?
- —
Personal DTI + credit; lowest rate.
DSCR
20% down · 8.5% · 30yr
- Down + closing
- —
- Monthly P&I
- —
- Monthly cashflow
- —
- DSCR
- —
- Eligible?
- —
No personal income docs; deal must DSCR.
Hard money
10% down · 12.0% · 12mo
- Down + closing
- —
- Monthly P&I
- —
- Monthly cashflow
- —
- DSCR
- —
- Eligible?
- —
Short-term bridge; refi at stabilization.
Rent comps 4 comps
| Address | Beds | Baths | Sqft | Rent | $/sqft | DOM | Units | Dist |
|---|---|---|---|---|---|---|---|---|
| 218 Mary St Homestead, PA | 3.0 | 1.0 | 1776 | $1,400 | $0.79 | 21d | 1 | 0.88mi |
| 308 Lea St Homestead, PA | 4.0 | 2.0 | 1480 | $1,490 | $1.01 | 3d | 1 | 0.88mi |
| 1254 Edgewood Dr Homestead, PA | 3.0 | 1.0 | 1144 | $1,725 | $1.51 | 43d | 1 | 0.89mi |
| 351 W 12th Ave Homestead, PA | 5.0 | 2.0 | 1856 | $2,300 | $1.24 | 1d | 1 | 1.39mi |
Listing history 23 events
-
2026-06-18days on market $149,900 Active 28 DOM
-
2026-06-17days on market $149,900 Active 27 DOM
-
2026-06-16days on market $149,900 Active 26 DOM
-
2026-06-15days on market $149,900 Active 25 DOM
-
2026-06-13days on market $149,900 Active 23 DOM
-
2026-06-09days on market $149,900 Active 19 DOM
-
2026-06-08days on market $149,900 Active 18 DOM
-
2026-06-07days on market $149,900 Active 17 DOM
-
2026-06-05days on market $149,900 Active 14 DOM
-
2026-06-03days on market $149,900 Active 13 DOM
-
2026-06-02days on market $149,900 Active 12 DOM
-
2026-06-01days on market $149,900 Active 11 DOM
-
2026-05-31days on market $149,900 Active 10 DOM
-
2026-05-18$149,900 Active
-
2014-05-19soldstatus $47,000
-
2014-01-03price $26,000 136-char remark
Show marketing remark (136 chars)
2 story brick with full covered front porch, 2 car detached garage and rear fenced yard. Livingroom features decorative stone fireplace.
-
2013-12-24price $34,900 136-char remark
Show marketing remark (136 chars)
2 story brick with full covered front porch, 2 car detached garage and rear fenced yard. Livingroom features decorative stone fireplace.
-
2013-12-24soldstatus $26,000 136-char remark
Show marketing remark (136 chars)
2 story brick with full covered front porch, 2 car detached garage and rear fenced yard. Livingroom features decorative stone fireplace.
-
2013-09-26$34,900 136-char remark
Show marketing remark (136 chars)
2 story brick with full covered front porch, 2 car detached garage and rear fenced yard. Livingroom features decorative stone fireplace.
-
2013-08-14$39,900 165-char remark
Show marketing remark (165 chars)
2 story brick with full covered front porch, fenced-in rear yard, & 2 car garage. Decorative stone fireplace in the livingroom. Large room sizes. 1st floor den.
-
1999-06-03soldstatus $41,000
-
1999-05-27soldstatus $41,000
-
1999-03-29$42,900
ⓘ Source: listings_history table (triggers on properties + properties_extension) + one-shot
backfill from property_details.listing_events for pre-trigger history.
Tax reassessment forecast PA · Partial reset (capped growth)
- Current annual tax
- $3,028 · $252/mo
- Projected year-2 tax
- $3,028 · $252/mo
- Expected delta
- $0/yr ($0/mo · 0.0%)
ⓘ Screening estimate from a state-policy table — verify with the county assessor before closing.
Climate risk First Street
- Flood 1/10 Low FEMA zone X (unshaded) · 0% chance over 30 yrs
- Wildfire 1/10 Low
- Heat 4/10 Moderate 7 d/yr ≥96°F today · 17 d/yr by 30 yrs out
- Wind 2/10 Low 0% chance of damaging wind over 30 yrs
- Air quality 4/10 Moderate 4 unhealthy d/yr today · 5 by 30 yrs out
Nearby sold comps map
Loading sold comps map…
Walkable amenities ~0.75 mi
Loading nearby amenities…
Taxation est. · year 1
- Rental income
- $21,758
- − Mortgage interest
- −$8,397
- − Property taxes
- −$3,028
- − Insurance
- −$750
- − Repairs & maintenance
- −$1,741
- − Management
- −$1,741
- − Depreciation
- −$4,361
- Taxable income
- $1,742
- Est. tax owed @ 24.0%
- −$418
- After-tax cash flow
- $3,560/yr
For passive investors: Depreciation is non-cash, so a rental often shows a tax loss while cash-flowing — sheltering income. Rental losses are passive: they offset passive income freely, and up to $25,000/yr can offset ordinary (W-2) income if you actively participate and your MAGI is under $100k (phasing out to $0 by $150k); unused losses carry forward. On sale, claimed depreciation is recaptured at up to 25%, and gains may owe capital-gains tax (a 1031 exchange can defer both). Figures are a year-1 estimate at your 24.0% rate — not tax advice; consult a CPA.
Schools (NCES district)
- District
- Steel Valley SD
- NCES district ID
- 4222790
- Math proficiency
- 29% ▼ -1.00%
- Reading proficiency
- 45% ▼ -4.00%
- Median HH income
- $39,505
- Composite
- 30.94/100
- National rank
- #6111
- State rank
- #403 of 539 in PA
Livability — Munhall
- Score
- 78/100
- State rank
- #308
- US rank
- #2734
Category grades
Schools grade is shown separately in the Schools card above.
Census & demographics
- Census place
- Munhall, PA
- County
- Allegheny County · 1,022,028 people
- City population
- 18,029
- Metro
- Pittsburgh, PA
- Population (ZIP)
- 18,029
- Household income
- $55,714
- Rent vs Own
- Severe rent burden
- 669.0
Population outlook (Allegheny County) Hauer SSP2
- Today (2025)
- 1,250,282 people
- By 2030
- 1,256,482 · +0.5%
- By 2040
- 1,256,318 · +0.5%
- By 2050
- 1,244,169 · -0.5%
- By 2075
- 1,197,693 · -4.2%
- By 2100
- 1,093,187 · -12.6%
Race, ethnicity, and origin ACS 2023
- Neighborhood character
- Predominantly White (74%)
- Race & ethnicity
- White 74% Black 20% Two or more races 4% Hispanic / Latino 2%
- Common ancestry
- Romanian 6% Lithuanian 1% Scotch-Irish 1%
- Foreign-born
- 3% · South Korea, Canada
- Languages at home
- 95% English-only · Spanish 3% Russian/Polish/Slavic 1%
Political lean MEDSL · Allegheny
- 2024 margin
- Strong D (+20.3) · D 59.7% · R 39.4%
- 2008→2024 swing
- +4.8pp toward D · 2008: 15.5pp · 2024: 20.3pp
- All cycles
- 2024: D+20.3 2020: D+20.4 2016: D+16.4 2012: D+14.4 2008: D+15.5
Not yet ingested
- Civics
- —
Market trends
- HPI YoY
- ▼ -59.52%
- Current HPI
- 292.5607
- Rent YoY
- ▲ 4.06%
- Metro
- Pittsburgh, PA
- State GDP YoY
- ▲ 1.68%
- F500 in state
- 34
Industry mix (Fortune 500 HQ in PA)
| Industry | F500 HQs | Revenue |
|---|---|---|
| Healthcare | 2 | $309B |
|
||
| Insurance | 2 | $27B |
|
||
| Telecommunications / Media | 1 | $124B |
|
||
| Industrial Distribution | 1 | $22B |
|
||
| Financial Services | 1 | $20B |
|
||
| Chemicals / Materials | 1 | $18B |
|
||
Price history
+249.4% since first listed10 events — show timeline
- 2026-05-18 Listed $149,900 West Penn MLS
- 2014-05-19 Sold (Public Records) $47,000 Public Records
- 2014-01-03 Price Changed $26,000 West Penn MLS
- 2013-12-24 Sold (MLS) $26,000 West Penn MLS
- 2013-12-24 Price Changed $34,900 West Penn MLS
- 2013-09-26 Listed $34,900 West Penn MLS
- 2013-08-14 Listed $39,900 West Penn MLS
- 1999-06-03 Sold (Public Records) $41,000 Public Records
- 1999-05-27 Sold (MLS) $41,000 West Penn MLS
- 1999-03-29 Listed $42,900 West Penn MLS
Property tax history
+3.2%/yrLatest (2026): $3,028 · +3.9% YoY. Source: county tax records.
Cash-flow waterfall
monthlySold comps — $/sqft
last 12 mo · ≤1 miLoading sold comps…