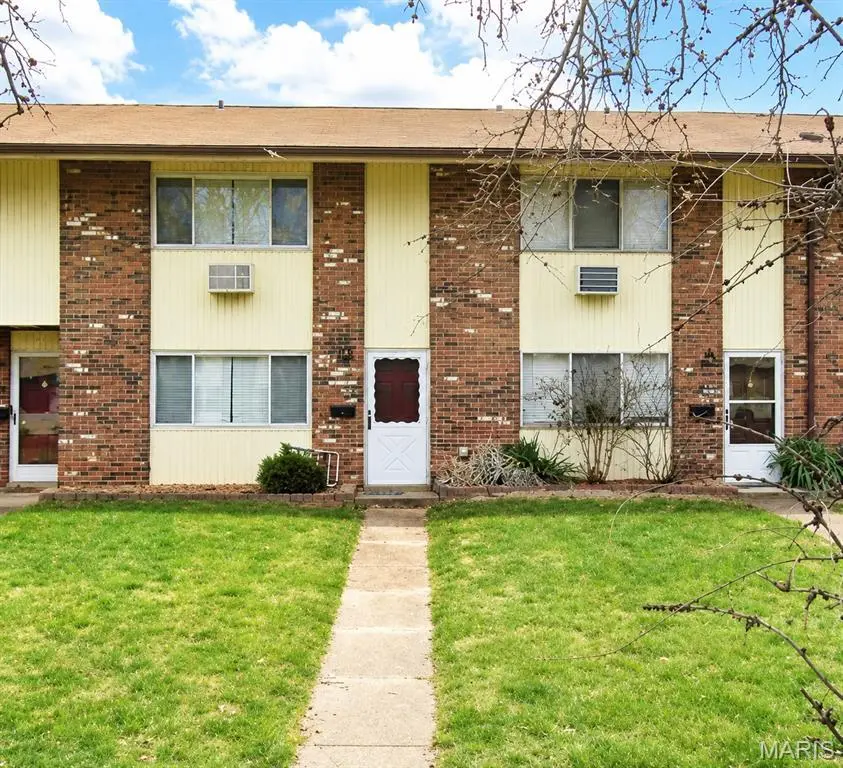
7634 Hazelcrest Dr · Hazelwood, MO
Flood risk 4/10 · Minor
- FEMA flood zone
- X (unshaded)
- Chance of flooding over 30 yrs
- 0.2%
- Est. flood insurance / yr
- $507 – $1,088
Fire risk 1/10 · Minimal
- Est. fire insurance / yr
- $1,054 – $1,958
Heat risk 5/10 · Moderate
- Hot days now (above 105°F)
- 7 days/yr
- Hot days in 30 yrs
- 22 days/yr
Wind risk 2/10 · Minimal
- Chance of severe wind over 30 yrs
- 1.0%
Air-quality risk 3/10 · Minor
- Unhealthy air days now
- 3 days/yr
- Unhealthy air days in 30 yrs
- 5 days/yr
Risk factors via First Street. Map © Google.
Why this score? — see what drove the B grade
The composite is a weighted blend of 9 inputs, each scored 0–100. Each bar is that input's sub-score; the figure is the points it added to the 100-point composite (weight × sub-score).
- Cash flow +30.0/30.0
- 1% rule +10.0/10.0
- DSCR +10.0/10.0
- ARV discount +9.8/15.0
- Rent growth +3.6/5.0
- Livability +3.1/5.0
- Condition / age +2.5/5.0
- Schools +1.2/10.0
- Appreciation +0.0/10.0
$75,000
🖨 Deal sheet 📄 Offer letter ✓ Due diligence
Listing remarks
Welcome to 7634 Hazelcrest Drive in Hazelwood! This well maintained home offers comfortable living in a convenient location close to shopping, restaurants, parks, and major highways. Featuring a functional floor plan, spacious living areas, and a generous yard, this property provides plenty of room to relax and enjoy. Whether you’re a first time homebuyer, looking to downsize, or searching for your next investment opportunity, this home offers a great combination of value, location, and potential. Conveniently situated near everyday amenities while tucked into an established neighborhood, 7634 Hazelcrest Drive is ready for its next owner to move in and make it their own.
Key facts
- Generous yard
- Convenient location
- $380 HOA
Tags
Property features AI
Finance
- Financial info: Lease considered
- HOA & community: Hazelcrest association; Monthly HOA fee of $380; HOA includes sewer, snow removal, trash, utilities and water; Community amenities: common ground, playground; outside management
Exterior
- Utilities: Public water; Public sewer; Electric service by Ameren
- Home design: Townhouse; Two levels; Residential property
- Construction: Other construction materials
- Exterior features: Other lot features
Interior
- Kitchen: Microwave; Electric oven; Built-in range; Electric range
- Bedrooms: 3 bedrooms (all on upper level)
- Flooring: Vinyl flooring
- Bathrooms: 1 full bathroom; 1 half bathroom
- Heating & cooling: Baseboard heating; Wall/window air conditioning units
- Interior features: Built-in range; Microwave; Electric oven/range
Neighborhood map
What this means for you Summary
Snapshot
- This is a 3-bed/1.5-bath townhouse listed at $75k.
Deal economics
- At list price, monthly cash flow is $301 ($4k/yr) — positive.
- The deal already cash-flows at list — no discount required.
- Meets the 1% rule at list price ($1k rent vs $75k).
- Cap rate 11.1% vs local median 7.2% in Hazelwood — top-decile yield for the area; either an underpriced asset or a hidden risk that comps aren't pricing in. Stress-test before assuming the spread holds.
Location & tenants
- Location reads 62/100 on livability (#395 in MO) — a middle-class / working-renter tenant base. Strengths: cost of living A+, housing A+; Watch: crime F, amenities F, commute F.
- Ferguson-Florissant R-II (suburban): math 7% / reading 20% proficiency, ranked #311 of 324 in MO (top 96%) — low school quality limits family demand, transient renter base, plan for 1-2y turnover; 70% free/reduced lunch — lower-income household profile, screen leases tightly.
- Zoned schools: Commons Lane Elementary (291 students, 99% FRL); Mccluer High (math 0% / reading 17%, grade F, #511 of 521 statewide, top 98%, 1,181 students, 100% FRL) — zoned schools average 99% FRL vs 70% district-wide (30 pts higher); higher-poverty schools than district average — tighter screening recommended.
- Market conditions: Rents rising fast (+4.5%/yr); 68 active listings in the ZIP; 35 comparable units currently listed for rent nearby; rentals at typical pace (median 20d on market — plan ~3-4 weeks tenant-placement turnaround); 920 units permitted in St. Louis County in 2024 (250 in 5+ unit buildings).
- This rent runs 36% of the median local income ($49k/yr) — at the standard rent-burdened threshold; future hikes will face affordability resistance.
Forward outlook
- Local home prices are declining (-3.0%/yr); year-one equity from $519 of loan paydown is wiped out by about $2k of value loss. Plan a longer hold.
- At projected returns (-3.0% appreciation + 4.5% rent growth), your $21k cash investment doubles in ~7 years — after that, you're playing with house money.
Negotiation context
- Only 1 days on market — expect competitive offers; lowballing is unlikely to land.
- Current owner paid $56k; 34% above their basis — modest negotiation headroom, anchor on the comps not their cost.
Risks & watch-outs
- Watch-outs: HOA is 26% of rent.
- Climate carrying-cost: extreme-heat days projected 7→22/yr by 2055 (HVAC capex compounding) — expect insurance premiums to compound above CPI over the hold.
Questions for the listing agent
- Built in 1965 — when were the roof, HVAC, electrical panel, plumbing, and water heater last replaced?
- What does the HOA fee cover, when was the last increase, and are there any pending special assessments or reserve-fund shortfalls?
- Is there a deadline driving the sale (1031 exchange, divorce, estate, relocation)? That informs how much negotiation room exists.
- Schools are D-rated, which usually means shorter tenancies and higher turnover. Who's the typical renter profile here, and what's been the actual vacancy rate?
- Crime grade is F in this area — have there been break-ins, vandalism, or insurance claims at this property in the last 3 years? What carrier currently insures it and at what premium?
- What's the average days-on-market for RENTAL listings here right now (not sales)? A rising rental-DOM trend means longer vacancies and softer asking-rent achievability than the comps imply.
- What's the recent tenant-quality profile in this submarket — average credit score on applications, eviction rate, late-payment / NSF rate, and stable-employment percentage? A property-management company in the area should have these aggregated.
- How much new for-sale + rental construction is in the pipeline within 1–3 miles? Heavy new supply typically softens prices + rents 12–24 months out; constrained supply supports both.
Investment metrics
- 1% rule
- 1.97% ✓
- Cap rate
- 11.12%
- Cash-on-cash
- 17.22%
- DSCR
- 1.77
- GRM
- 4.2
CMA / ARV
- ARV (on-the-fly)
- $79,002
- Comps found
- 12
Show comp detail 12 sales within ~0.75 mi
| Address | Dist | Beds/Ba | Sqft | Sold | Price | $/sf | Match |
|---|---|---|---|---|---|---|---|
| 7740 Hazelcrest Dr | 0.06mi | 3/1.5 | 1,254 (0%) | 5mo | $65,000 | $52 | 93 |
| 8787 Sieloff Dr | 0.17mi | 3/1.5 | 1,254 (0%) | 4mo | $85,900 | $69 | 89 |
| 7540 Hazelcrest Dr | 0.12mi | 3/1.5 | 1,254 (0%) | 11mo | $89,900 | $72 | 85 |
| 7520 Hazelcrest Dr | 0.15mi | 4/1.5 (+1) | 1,260 (+0%) | 6mo | $79,900 | $63 | 82 |
| 7463 Hazelcrest Dr | 0.29mi | 3/1.5 | 1,254 (0%) | 6mo | $80,000 | $64 | 81 |
| 7394 Hazelcrest Dr | 0.28mi | 2/1.5 (-1) | 1,254 (0%) | 3mo | $70,000 | $56 | 79 |
| 7262 Hazelcrest Dr | 0.21mi | 4/1.5 (+1) | 1,260 (+0%) | 9mo | $78,900 | $63 | 77 |
| 7346 Hazelcrest Dr | 0.34mi | 3/1.5 | 1,254 (0%) | 10mo | $95,000 | $76 | 76 |
| 7338 Hazelcrest Dr | 0.36mi | 3/1.5 | 1,254 (0%) | 10mo | $45,000 | $36 | 76 |
| 7214 Hazelcrest Dr | 0.42mi | 3/1.5 | 1,254 (0%) | 11mo | $50,000 | $40 | 72 |
| 7382 Hazelcrest Dr | 0.29mi | 2/1.5 (-1) | 1,254 (0%) | 12mo | $79,900 | $64 | 72 |
| 7222 Hazelcrest Dr | 0.43mi | 4/1.5 (+1) | 1,260 (+0%) | 8mo | $80,000 | $63 | 68 |
Match score weights: distance 35% · size 25% · config 20% · recency 20%. Top-matched comps best support the ARV.
Projected returns pro-forma
-3.0% appreciation · 4.45% rent growth · sell at horizon
- IRR
- 11.1%
- Equity multiple
- 1.45×
- Total profit
- $9,460
- Equity at exit
- $11,183
- IRR
- 21.8%
- Equity multiple
- 3.05×
- Total profit
- $43,129
- Equity at exit
- $6,485
Cash invested: $21,000 (down + closing). Projections, not guarantees.
Landlord ↔ Tenant lean methodology
- Overall (STATE)
- 81 Strongly Landlord-Friendly
- State Missouri
- 81 Strongly Landlord-Friendly · R+10
- County
- — inherits STATE
- City
- — inherits STATE
ZIP-level market 63042
- Rents YoY
- 4.5%
- Active inventory
- 68
- Price-to-rent
- 4.2×
Monthly cashflow live
- Estimated rent
- $1,474 high interval (Pro) →
- Mortgage (P&I)
- −$393
- Tax from tax record
- −$58 /mo · $701/yr
- Insurance
- −$31
- HOA
- −$380
- Vacancy / Maint / Mgmt
- −$310
- Net cashflow
- $301
Break-even live
UW: 25.0% down · 7.5% · 30yr · 1.5% tax · 5.0% vac · 8.0% maint · 8.0% mgmt
Financing live
Cash to close
- Down payment
- $18,750
- Closing costs
- $2,250
- Reserves months
- —
- Total cash needed
- —
Loan-product check · same deal, 3 products live
Conventional
25% down · 7.5% · 30yr
- Down + closing
- —
- Monthly P&I
- —
- Monthly cashflow
- —
- DSCR
- —
- Eligible?
- —
Personal DTI + credit; lowest rate.
DSCR
20% down · 8.5% · 30yr
- Down + closing
- —
- Monthly P&I
- —
- Monthly cashflow
- —
- DSCR
- —
- Eligible?
- —
No personal income docs; deal must DSCR.
Hard money
10% down · 12.0% · 12mo
- Down + closing
- —
- Monthly P&I
- —
- Monthly cashflow
- —
- DSCR
- —
- Eligible?
- —
Short-term bridge; refi at stabilization.
Rent comps 35 comps
| Address | Beds | Baths | Sqft | Rent | $/sqft | DOM | Units | Dist |
|---|---|---|---|---|---|---|---|---|
| 7437 Hazelcrest Dr Unit H Hazelwood, MO | 3.0 | 1.0 | 1000 | $1,000 | $1.00 | 7d | 1 | 0.18mi |
| 240 Chez Vant Ct Hazelwood, MO | 2.0 | 1.5 | 1440 | $1,350 | $0.94 | 43d | 1 | 0.27mi |
| 16 Mary Rose Ct Hazelwood, MO | 3.0 | 2.0 | 1506 | $1,706 | $1.13 | 14d | 1 | 0.46mi |
| 116 Graham Rd Florissant, MO | 3.0 | 2.0 | 1578 | $1,495 | $0.95 | 1d | 1 | 0.62mi |
| 8507 Tally Ho Dr Hazelwood, MO | 2.0 | 1.5 | 1478 | $1,300 | $0.88 | 43d | 5 | 0.78mi |
| 14 Bruce Dr Unit Bruce 14-4 Florissant, MO | 2.0 | 1.0 | 880 | $975 | $1.11 | 43d | 1 | 0.78mi |
| 13 Bruce Dr Florissant, MO | 2.0 | 1.0 | 880 | $975 | $1.11 | 23d | 1 | 0.79mi |
| 13 Bruce Dr Unit Bruce 13-2 Florissant, MO | 2.0 | 1.0 | 880 | $975 | $1.11 | 43d | 1 | 0.79mi |
| 446 Olian Dr Hazelwood, MO | 2.0 | 1.0 | 880 | $975 | $1.11 | 1d | 1 | 0.86mi |
| 17 Valley Dr Florissant, MO | 2.0 | 2.0 | 1356 | $1,525 | $1.12 | 43d | 1 | 0.88mi |
| 785 Florland Dr Florissant, MO | 3.0 | 1.0 | 1100 | $1,700 | $1.55 | 17d | 1 | 0.88mi |
| 858 Hazelvalley Dr Hazelwood, MO | 3.0 | 1.5 | 912 | $1,450 | $1.59 | 43d | 1 | 0.99mi |
| 1180 S New Florissant Rd Florissant, MO | 3.0 | 1.0 | 925 | $1,225 | $1.32 | 23d | 1 | 1.12mi |
| 1280 Saint Catherine St Florissant, MO | 3.0 | 1.0 | 1274 | $1,600 | $1.26 | 14d | 1 | 1.13mi |
| 5 Santa Cruz Dr Florissant, MO | 2.0 | 1.0 | 1410 | $1,411 | $1.00 | 16d | 1 | 1.14mi |
| 1250 S New Florissant Rd Florissant, MO | 2.0 | 1.0 | 1150 | $1,500 | $1.30 | 14d | 1 | 1.18mi |
| 1545 Washington St Florissant, MO | 3.0 | 1.5 | 1337 | $2,055 | $1.54 | 2d | 1 | 1.21mi |
| 532 Holiday Ave Hazelwood, MO | 3.0 | 1.0 | 912 | $1,350 | $1.48 | 43d | 1 | 1.21mi |
| 1600 Washington St Florissant, MO | 3.0 | 1.5 | 1095 | $1,250 | $1.14 | 20d | 1 | 1.21mi |
| 537 Lynn Haven Ln Hazelwood, MO | 3.0 | 2.0 | 1242 | $1,675 | $1.35 | 23d | 1 | 1.25mi |
| 221 Barto Dr Saint Louis, MO | 3.0 | 2.0 | 958 | $1,295 | $1.35 | 20d | 1 | 1.26mi |
| 7025 Richwood Ln Hazelwood, MO | 3.0 | 1.0 | 936 | $1,375 | $1.47 | 17d | 1 | 1.27mi |
| 1455 S New Florissant Rd Florissant, MO | 4.0 | 1.0 | 1584 | $1,721 | $1.09 | 43d | 1 | 1.28mi |
| 508 Saratoga Ln Hazelwood, MO | 3.0 | 1.0 | 988 | $1,306 | $1.32 | 23d | 1 | 1.29mi |
| 17 Elwood Ct Florissant, MO | 3.0 | 2.0 | 1572 | $1,945 | $1.24 | 1d | 1 | 1.29mi |
| 1465 W Duchesne Dr Florissant, MO | 3.0 | 1.0 | 896 | $1,500 | $1.67 | 43d | 1 | 1.35mi |
| 1725 Saint Catherine St Florissant, MO | 3.0 | 1.0 | 1107 | $1,800 | $1.63 | 14d | 1 | 1.35mi |
| 297 Saint Eugene Ln Florissant, MO | 2.0 | 1.0 | 1100 | $1,100 | $1.00 | 43d | 1 | 1.38mi |
| 20 Saint Benedict Ln Florissant, MO | 3.0 | 1.5 | 1092 | $1,525 | $1.40 | 20d | 1 | 1.39mi |
| 263 Sadonia Ave Saint Louis, MO | 3.0 | 2.0 | 888 | $1,350 | $1.52 | 43d | 1 | 1.39mi |
| 260 Sadonia Ave Saint Louis, MO | 3.0 | 2.0 | 1088 | $1,623 | $1.49 | 20d | 1 | 1.42mi |
| 4 Sharon Ct Florissant, MO | 3.0 | 2.0 | 1108 | $1,800 | $1.62 | 2d | 1 | 1.43mi |
| 623 Holiday Ave Hazelwood, MO | 3.0 | 2.0 | 1176 | $1,591 | $1.35 | 12d | 1 | 1.45mi |
| 3 Champlain Ct Florissant, MO | 3.0 | 1.0 | 1100 | $1,600 | $1.45 | 43d | 1 | 1.48mi |
| 9 Saint Celeste Dr Florissant, MO | 3.0 | 1.0 | 992 | $1,450 | $1.46 | 43d | 1 | 1.49mi |
HOA detail
- Monthly dues
- $380 · $4,560/yr
Listing history 2 events
-
2026-06-18remarks 679-char remark
-
2026-06-18$75,000 Active 1 DOM
ⓘ Source: listings_history table (triggers on properties + properties_extension) + one-shot
backfill from property_details.listing_events for pre-trigger history.
Tax reassessment forecast MO · Resets to sale price
- Current annual tax
- $701 · $58/mo
- Projected year-2 tax
- $728 · $61/mo
- Expected delta
- +$26/yr (+$2/mo · 3.8%)
ⓘ Screening estimate from a state-policy table — verify with the county assessor before closing.
Climate risk First Street
- Flood 4/10 Moderate FEMA zone X (unshaded) · 20% chance over 30 yrs
- Wildfire 1/10 Low
- Heat 5/10 Major 7 d/yr ≥105°F today · 22 d/yr by 30 yrs out
- Wind 2/10 Low 100% chance of damaging wind over 30 yrs
- Air quality 3/10 Moderate 3 unhealthy d/yr today · 5 by 30 yrs out
Nearby sold comps map
Loading sold comps map…
Walkable amenities ~0.75 mi
Loading nearby amenities…
Taxation est. · year 1
- Rental income
- $17,687
- − Mortgage interest
- −$4,201
- − Property taxes
- −$701
- − Insurance
- −$375
- − Repairs & maintenance
- −$1,415
- − Management
- −$1,415
- − HOA
- −$4,560
- − Depreciation
- −$2,182
- Taxable income
- $2,838
- Est. tax owed @ 24.0%
- −$681
- After-tax cash flow
- $2,936/yr
For passive investors: Depreciation is non-cash, so a rental often shows a tax loss while cash-flowing — sheltering income. Rental losses are passive: they offset passive income freely, and up to $25,000/yr can offset ordinary (W-2) income if you actively participate and your MAGI is under $100k (phasing out to $0 by $150k); unused losses carry forward. On sale, claimed depreciation is recaptured at up to 25%, and gains may owe capital-gains tax (a 1031 exchange can defer both). Figures are a year-1 estimate at your 24.0% rate — not tax advice; consult a CPA.
Schools (NCES district)
- District
- Ferguson-Florissant R-II
- NCES district ID
- 2912010
- Math proficiency
- 7% ▼ -9.00%
- Reading proficiency
- 20% ▼ -6.00%
- Median HH income
- $44,610
- Composite
- 11.96/100
- National rank
- #9666
- State rank
- #311 of 324 in MO
Livability — Hazelwood
- Score
- 62/100
- State rank
- #395
- US rank
- #16956
Category grades
Schools grade is shown separately in the Schools card above.
Census & demographics
- Census place
- Hazelwood, MO
- County
- Saint Louis County · 888,823 people
- City population
- 17,813
- Metro
- St. Louis, MO-IL
- Population (ZIP)
- 17,813
- Household income
- $49,453
- Rent vs Own
- Severe rent burden
- 766.0
Population outlook (St. Louis County) Hauer SSP2
- Today (2025)
- 1,025,227 people
- By 2030
- 1,028,023 · +0.3%
- By 2040
- 1,020,940 · -0.4%
- By 2050
- 1,007,280 · -1.8%
- By 2075
- 987,277 · -3.7%
- By 2100
- 921,984 · -10.1%
Race, ethnicity, and origin ACS 2023
- Neighborhood character
- Diverse neighborhood (Simpson 0.64)
- Race & ethnicity
- White 46% Black 38% Two or more races 10% Hispanic / Latino 4% Asian 2%
- Common ancestry
- Lithuanian 3% Romanian 1% Italian 1%
- Foreign-born
- 5% · Canada, Vietnam
- Languages at home
- 94% English-only · Spanish 3% Vietnamese 1% Tagalog/Filipino 1%
Political lean MEDSL · St. Louis
- 2024 margin
- Strong D (+23.4) · D 60.8% · R 37.4% · Other 1.7%
- 2008→2024 swing
- +3.5pp toward D · 2008: 19.9pp · 2024: 23.4pp
- All cycles
- 2024: D+23.4 2020: D+24.0 2016: D+16.2 2012: D+13.7 2008: D+19.9
Not yet ingested
- Civics
- —
Market trends
- HPI YoY
- ▼ -204.48%
- Current HPI
- 234.7353
- Rent YoY
- ▲ 4.45%
- Metro
- St. Louis, MO-IL
- State GDP YoY
- ▲ 1.84%
- F500 in state
- 20
Industry mix (Fortune 500 HQ in MO)
| Industry | F500 HQs | Revenue |
|---|---|---|
| Healthcare | 1 | $163B |
|
||
| Insurance | 1 | $21B |
|
||
| Industrial Technology | 1 | $17B |
|
||
| Retail | 1 | $16B |
|
||
| Industrial Distribution | 1 | $10B |
|
||
| Utilities | 1 | $9B |
|
||
Price history
+33.9% since first listed4 events — show timeline
- 2026-06-18 Listed $75,000 MARIS as Distributed by MLS Grid
- 2026-06-18 Coming Soon $75,000 MARIS as Distributed by MLS Grid
- 2003-09-15 Sold (Public Records) $56,000 Public Records
- 1995-01-04 Sold (Public Records) — Public Records
Property tax history
-1.7%/yrLatest (2022): $701 · +0.6% YoY. Source: county tax records.
Cash-flow waterfall
monthlySold comps — $/sqft
last 12 mo · ≤1 miLoading sold comps…