10471 Sunny Meadows Blvd · Tyler, TX
Flood risk 5/10 · Moderate
- FEMA flood zone
- X (unshaded)
- Chance of flooding over 30 yrs
- 0.66%
- Est. flood insurance / yr
- $507 – $1,088
Fire risk 5/10 · Moderate
- Est. fire insurance / yr
- $1,222 – $2,270
Heat risk 6/10 · Moderate
- Hot days now (above 109°F)
- 7 days/yr
- Hot days in 30 yrs
- 25 days/yr
Wind risk 6/10 · Moderate
- Chance of severe wind over 30 yrs
- 59.0%
Air-quality risk 2/10 · Minimal
- Unhealthy air days now
- 0 days/yr
- Unhealthy air days in 30 yrs
- 1 days/yr
Risk factors via First Street. Map © Google.
Why this score? — see what drove the D grade
The composite is a weighted blend of 9 inputs, each scored 0–100. Each bar is that input's sub-score; the figure is the points it added to the 100-point composite (weight × sub-score).
- 1% rule +10.0/10.0
- ARV discount +7.5/15.0
- Appreciation +7.5/10.0
- Livability +3.8/5.0
- Condition / age +3.8/5.0
- Schools +2.9/10.0
- Cash flow +2.5/30.0
- Rent growth +2.5/5.0
- DSCR +0.0/10.0
$44,000
🖨 Deal sheet (PDF) 📄 Offer letter ✓ Due diligence
Listing remarks
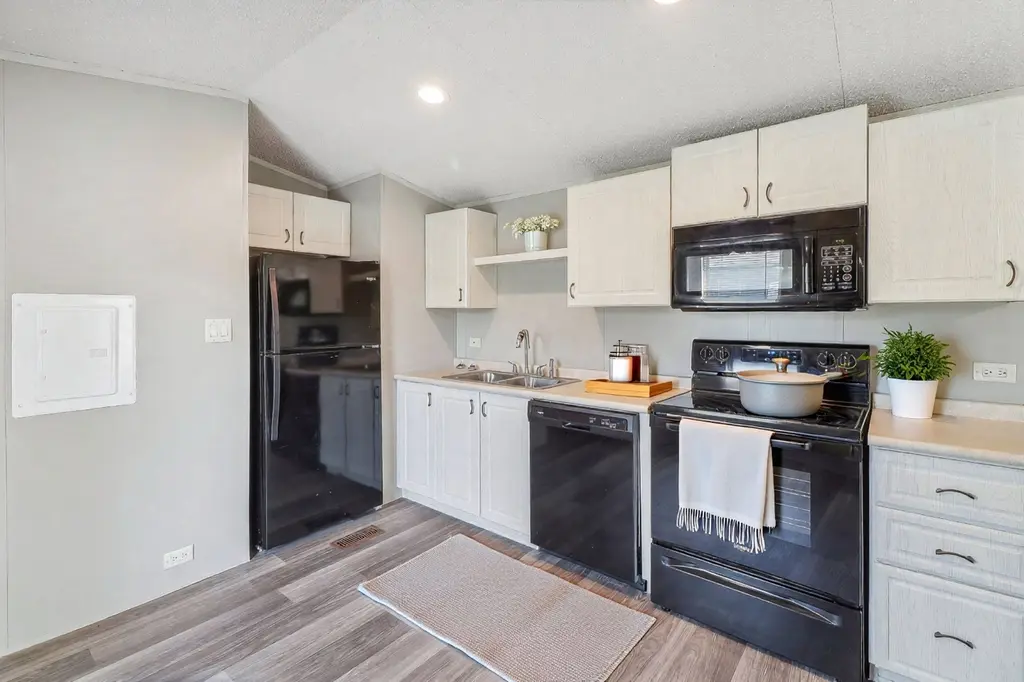
Embrace minimalist living in this thoughtfully designed 1-bedroom, 1-bath home nestled in a quiet community just outside of Tyler, Texas. Created for simplicity and ease, this low-maintenance property offers a streamlined layout where every inch is intentionally used. Enjoy slow mornings on the covered front porch and the convenience of a private parking area. Inside, the open-concept kitchen features ample cabinetry, full-size appliances, and generous counter space, flowing effortlessly into a bright, comfortable living area. Designed to support a clutter-free lifestyle without sacrificing comfort, this move-in ready home is the perfect blend of efficiency, functionality, and peaceful livi
Key facts
- Covered front porch
- Private parking area
- Ample cabinetry
Tags
Property features AI
Finance
- Other: Active listing, list price $44,000
- HOA & community: Association fee of 595
Exterior
- Utilities: Electric heating and central air
- Home design: Spec inventory — Tiny Singlewide plan
- Exterior features: Living area of 480 (interior size)
Interior
- Kitchen: Includes dishwasher, microwave, and refrigerator
- Bedrooms: 1 bedroom
- Bathrooms: 1 full bathroom
- Heating & cooling: Electric forced-air heating; Central air conditioning
- Interior features: Dishwasher; Microwave; Refrigerator
Neighborhood map
What this means for you Summary
Snapshot
- This is a 1-bed/1.0-bath manufactured listed at $44k. Condition is rated good.
Deal economics
- At list price, monthly cash flow is $-152 ($-2k/yr) — negative.
- To cash-flow at today's rent, offer at most $22k (50.1% below list).
- Meets the 1% rule at list price ($945 rent vs $44k).
- Recommended offer: $22k (50.1% below list) — sets the bar for cash-flow.
- Cap rate 2.1% vs local median 3.5% in Tyler — below-typical yield; the buyer is paying a premium for something (appreciation thesis, condition, location) that the cap rate doesn't capture.
Location & tenants
- Location reads 75/100 on livability (#147 in TX, #4,181 nationally) — a middle-class / working-renter tenant base. Strengths: cost of living A+, housing A+, health & safety A+; Watch: employment C-, crime D+, commute F.
- Winona ISD (rural): math 32% / reading 35% proficiency, ranked #539 of 826 in TX (top 65%) — families likely to look elsewhere, expect single-tenant / working-renter base with shorter leases.
- Zoned schools: Winona El (math 20% / reading 26%, grade F, #3,277 of 4,322 statewide, top 77%, 565 students, 90% FRL); Winona Middle (math 42% / reading 41%, grade F, #595 of 1,662 statewide, top 37%, 251 students, 87% FRL); Winona H S (math 42% / reading 42%, grade F, #730 of 1,632 statewide, top 47%, 288 students, 80% FRL) — zoned schools average 86% FRL vs 56% district-wide (30 pts higher); higher-poverty schools than district average — tighter screening recommended.
- Market conditions: 67 active listings in the ZIP; 595 units permitted in Smith County in 2024 (45 in 5+ unit buildings).
Forward outlook
- In year one you build about $2k of equity ($304 loan paydown + $2k appreciation (5.0% local appreciation)).
- Smith County population projected at +24% by 2050 — long-run rental-demand tailwind backs the buy-and-hold thesis.
Negotiation context
- It's been on market 47 days — a 3% lower offer ($43k) is reasonable based on typical stale-listing flexibility.
Risks & watch-outs
- Watch-outs: HOA is 63% of rent.
- Climate carrying-cost: moderate flood risk; major wind risk, 59% chance of damaging wind over 30y; moderate wildfire risk; extreme-heat days projected 7→25/yr by 2055 (HVAC capex compounding) — expect insurance premiums to compound above CPI over the hold.
Questions for the listing agent
- What do current leases actually rent for vs. the listed asking? Can we see a recent rent roll and the last 12 months of T-12 income?
- It's been on market 47 days. Have you received any prior offers? Is the seller open to a 50% concession, seller financing, or rate buy-down credit?
- What does the HOA fee cover, when was the last increase, and are there any pending special assessments or reserve-fund shortfalls?
- Is there a deadline driving the sale (1031 exchange, divorce, estate, relocation)? That informs how much negotiation room exists.
- Schools are D-rated, which usually means shorter tenancies and higher turnover. Who's the typical renter profile here, and what's been the actual vacancy rate?
- Crime grade is D in this area — have there been break-ins, vandalism, or insurance claims at this property in the last 3 years? What carrier currently insures it and at what premium?
- The area grade is low — what's the realistic commute time and amenity access for the typical tenant pool here? Any planned neighborhood developments (good or bad) we should know about?
- What's the average days-on-market for RENTAL listings here right now (not sales)? A rising rental-DOM trend means longer vacancies and softer asking-rent achievability than the comps imply.
- What's the recent tenant-quality profile in this submarket — average credit score on applications, eviction rate, late-payment / NSF rate, and stable-employment percentage? A property-management company in the area should have these aggregated.
- How much new for-sale + rental construction is in the pipeline within 1–3 miles? Heavy new supply typically softens prices + rents 12–24 months out; constrained supply supports both.
Investment metrics
- 1% rule
- 2.15% ✓
- Cap rate
- 2.13%
- Cash-on-cash
- -14.85%
- DSCR
- 0.34
- GRM
- 3.9
CMA / ARV
No comps found within radius.
Projected returns pro-forma
4.96% appreciation · 3.0% rent growth · sell at horizon
- IRR
- 0.9%
- Equity multiple
- 1.06×
- Total profit
- $722
- Equity at exit
- $24,839
- IRR
- 4.8%
- Equity multiple
- 1.92×
- Total profit
- $11,353
- Equity at exit
- $42,790
Cash invested: $12,320 (down + closing). Projections, not guarantees.
Landlord ↔ Tenant lean methodology
- Overall (STATE)
- 87 Strongly Landlord-Friendly
- State Texas
- 87 Strongly Landlord-Friendly · R+5
- County
- — inherits STATE
- City
- — inherits STATE
ZIP-level market 75708
- Home prices YoY
- 2.4%
- Active inventory
- 67
- Price-to-rent
- 3.9×
Monthly cashflow live
- Estimated rent
- $945 medium interval (Pro) →
- Mortgage (P&I)
- −$231
- Tax est. 1.5%
- −$55 /mo · $660/yr
- Insurance
- −$18
- HOA
- −$595
- Vacancy / Maint / Mgmt
- −$198
- Net cashflow
- $-152
Break-even live
Sensitivity live
| Price | -10% $-122 | -5% $-137 | +0% $-152 | +5% $-168 | +10% $-183 |
|---|---|---|---|---|---|
| Rent | -10% $-227 | -5% $-190 | +0% $-152 | +5% $-115 | +10% $-78 |
| Rate | -1.0pp $-130 | -0.5pp $-141 | base $-152 | +0.5pp $-164 | +1.0pp $-175 |
UW: 25.0% down · 7.5% · 30yr · 1.5% tax · 5.0% vac · 8.0% maint · 8.0% mgmt
Financing live
Cash to close
- Down payment
- $11,000
- Closing costs
- $1,320
- Reserves months
- —
- Total cash needed
- —
Loan-product check · same deal, 3 products live
Conventional
25% down · 7.5% · 30yr
- Down + closing
- —
- Monthly P&I
- —
- Monthly cashflow
- —
- DSCR
- —
- Eligible?
- —
Personal DTI + credit; lowest rate.
DSCR
20% down · 8.5% · 30yr
- Down + closing
- —
- Monthly P&I
- —
- Monthly cashflow
- —
- DSCR
- —
- Eligible?
- —
No personal income docs; deal must DSCR.
Hard money
10% down · 12.0% · 12mo
- Down + closing
- —
- Monthly P&I
- —
- Monthly cashflow
- —
- DSCR
- —
- Eligible?
- —
Short-term bridge; refi at stabilization.
HOA detail
- Monthly dues
- $595 · $7,140/yr
Listing history 17 events
-
2026-06-22days on market $44,000 Active 47 DOM
-
2026-06-19days on market $44,000 Active 45 DOM
-
2026-06-18days on market $44,000 Active 44 DOM
-
2026-06-17days on market $44,000 Active 43 DOM
-
2026-06-16days on market $44,000 Active 42 DOM
-
2026-06-15days on market $44,000 Active 41 DOM
-
2026-06-14days on market $44,000 Active 39 DOM
-
2026-06-13days on market $44,000 Active 38 DOM
-
2026-06-10days on market $44,000 Active 36 DOM
-
2026-06-09days on market $44,000 Active 35 DOM
-
2026-06-08days on market $44,000 Active 34 DOM
-
2026-06-07days on market $44,000 Active 33 DOM
-
2026-06-02days on market $44,000 Active 28 DOM
-
2026-06-01days on market $44,000 Active 27 DOM
-
2026-05-31days on market $44,000 Active 26 DOM
-
2026-05-30days on market $44,000 Active 25 DOM
-
2026-05-06$44,000 Active 732-char remark
ⓘ Source: listings_history table (triggers on properties + properties_extension) + one-shot
backfill from property_details.listing_events for pre-trigger history.
Climate risk First Street
- Flood 5/10 Major FEMA zone X (unshaded) · 66% chance over 30 yrs
- Wildfire 5/10 Major
- Heat 6/10 Major 7 d/yr ≥109°F today · 25 d/yr by 30 yrs out
- Wind 6/10 Major 59% chance of damaging wind over 30 yrs
- Air quality 2/10 Low 0 unhealthy d/yr today · 1 by 30 yrs out
Nearby sold comps map
Loading sold comps map…
Walkable amenities ~0.75 mi
Loading nearby amenities…
Taxation est. · year 1
- Rental income
- $11,341
- − Mortgage interest
- −$2,465
- − Property taxes
- −$660
- − Insurance
- −$220
- − Repairs & maintenance
- −$907
- − Management
- −$907
- − HOA
- −$7,140
- − Depreciation
- −$1,280
- Taxable loss
- −$2,238
- Est. tax savings @ 24.0%
- +$537
- After-tax cash flow
- $-1,292/yr
For passive investors: Depreciation is non-cash, so a rental often shows a tax loss while cash-flowing — sheltering income. Rental losses are passive: they offset passive income freely, and up to $25,000/yr can offset ordinary (W-2) income if you actively participate and your MAGI is under $100k (phasing out to $0 by $150k); unused losses carry forward. On sale, claimed depreciation is recaptured at up to 25%, and gains may owe capital-gains tax (a 1031 exchange can defer both). Figures are a year-1 estimate at your 24.0% rate — not tax advice; consult a CPA.
Condition & rehab AI · 8 photos
This move-in ready, 1-bedroom, 1-bath home in Tyler, Texas, offers a clean and well-maintained interior with good curb appeal. Minor updates to the exterior and interior could significantly enhance its value.
Value-add opportunities
- Both Paint the exterior siding — Fresh paint enhances curb appeal and can increase both resale and rental value.
- Both Replace the kitchen faucet — A new faucet can improve functionality and aesthetics, boosting both resale and rental appeal.
- Both Install new window treatments — New curtains or blinds can enhance the home's curb appeal and make it more inviting for potential buyers or renters.
Renovation cost estimate screening
Value-add ROI direction
- Both Paint the exterior siding — Fresh paint enhances curb appeal and can increase both resale and rental value. ↑
- Both Replace the kitchen faucet — A new faucet can improve functionality and aesthetics, boosting both resale and rental appeal. ↑
- Both Install new window treatments — New curtains or blinds can enhance the home's curb appeal and make it more inviting for potential buyers or renters. ↑
ⓘ Cost ranges are severity-bucket heuristics (US national rule-of-thumb). Get contractor quotes + a written scope before underwriting a rehab budget.
Schools (NCES district)
- District
- Winona ISD
- NCES district ID
- 4846230
- Math proficiency
- 32% ▲ 2.00%
- Reading proficiency
- 35% ▲ 1.00%
- Median HH income
- $48,761
- Composite
- 28.98/100
- National rank
- #6624
- State rank
- #539 of 826 in TX
Livability — Tyler
- Score
- 75/100
- State rank
- #147
- US rank
- #4181
Category grades
Schools grade is shown separately in the Schools card above.
Census & demographics
- City population
- 127,842
- Population (ZIP)
- 10,001
Population outlook (Smith County) Hauer SSP2
- Today (2025)
- 248,890 people
- By 2030
- 261,665 · +5.1%
- By 2040
- 286,114 · +15.0%
- By 2050
- 308,006 · +23.8%
- By 2075
- 354,171 · +42.3%
- By 2100
- 372,828 · +49.8%
Race, ethnicity, and origin ACS 2023
- Neighborhood character
- Diverse neighborhood (Simpson 0.58)
- Race & ethnicity
- Hispanic / Latino 51% White 39% Two or more races 9% Black 9% Asian 1%
- Hispanic origin (detail)
- Mexican 49%
- Common ancestry
- Danish 1%
- Foreign-born
- 15% · Canada, Vietnam
- Languages at home
- 62% English-only · Spanish 37% Vietnamese 1%
Political lean MEDSL · Smith
- 2024 margin
- Solid R (+45.1) · D 27.0% · R 72.1%
- 2008→2024 swing
- -5.6pp toward R · 2008: -39.5pp · 2024: -45.1pp
- All cycles
- 2024: R+45.1 2020: R+39.4 2016: R+43.9 2012: R+46.9 2008: R+39.5
Not yet ingested
- Civics
- —
Market trends
- HPI YoY
- ▲ 4.96%
- Current HPI
- 216.4494
- Rent YoY
- —
- Metro
- —
- State GDP YoY
- ▲ 3.95%
- F500 in state
- 110
Industry mix (Fortune 500 HQ in TX)
| Industry | F500 HQs | Revenue |
|---|---|---|
| Energy | 16 | $1,198B |
|
||
| Technology | 5 | $198B |
|
||
| Engineering / Construction | 4 | $72B |
|
||
| Energy Services | 3 | $60B |
|
||
| Utilities | 3 | $41B |
|
||
| Healthcare | 2 | $330B |
|
||
Cash-flow waterfall
monthlySold comps — $/sqft
last 12 mo · ≤1 miLoading sold comps…