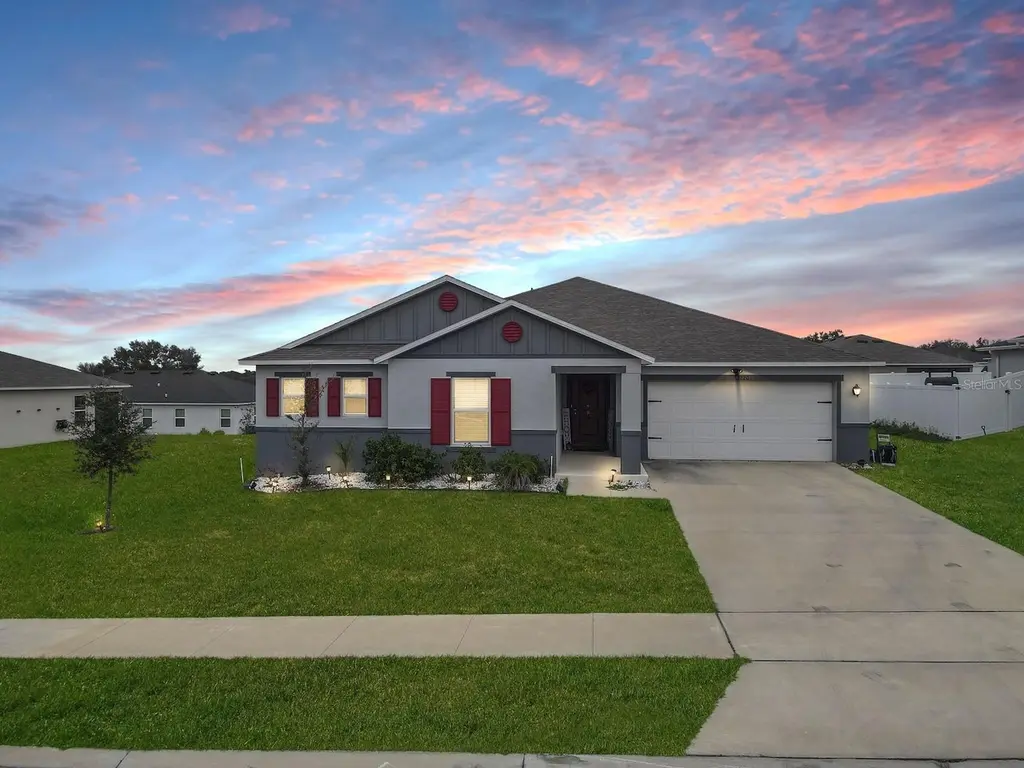
2220 Gladiolus Ln · Mascotte, FL
Flood risk 1/10 · Minimal
- FEMA flood zone
- X (unshaded)
- Chance of flooding over 30 yrs
- 0.0%
- Est. flood insurance / yr
- $507 – $1,088
Fire risk 7/10 · Major
- Est. fire insurance / yr
- $947 – $1,759
Heat risk 8/10 · Major
- Hot days now (above 108°F)
- 7 days/yr
- Hot days in 30 yrs
- 23 days/yr
Wind risk 9/10 · Severe
- Chance of severe wind over 30 yrs
- 99.0%
Air-quality risk 1/10 · Minimal
- Unhealthy air days now
- 0 days/yr
- Unhealthy air days in 30 yrs
- 0 days/yr
Risk factors via First Street. Map © Google.
Why this score? — see what drove the D- grade
The composite is a weighted blend of 9 inputs, each scored 0–100. Each bar is that input's sub-score; the figure is the points it added to the 100-point composite (weight × sub-score).
- Appreciation +10.0/10.0
- ARV discount +7.5/15.0
- Cash flow +5.8/30.0
- Schools +4.2/10.0
- Livability +3.6/5.0
- Rent growth +2.5/5.0
- Condition / age +2.5/5.0
- 1% rule +1.5/10.0
- DSCR +0.2/10.0
$380,000
🖨 Deal sheet 📄 Offer letter ✓ Due diligence
Listing remarks
MOTIVATED SELLER!!!! YOUR NEW HOME AWAITS!!! MOTIVATED SELLERS Welcome to this beautiful and spacious 4-bedroom, 2-bathroom split floor plan home designed for comfort and style. Step inside to find luxury vinyl flooring flowing seamlessly from the front entry through the kitchen and living areas, creating a warm and modern feel. The primary suite is a peaceful retreat, featuring a custom-built walk-in closet and other recent upgrades completed by the seller. Each room includes designer ceiling fans that enhance both comfort and elegance. The kitchen is the heart of the home with stunning granite countertops, a large island, and ample space for entertaining family and friends. This home blen
Key facts
- Large island
- Granite countertops
- 0.24 acre lot
Tags
Property features AI
Finance
- Other: Unfurnished; Association fees required
- Financial info: CDD present; Other annual assessment: $826
- HOA & community: Has HOA (Empire Management Group Inc); HOA fee $120 quarterly ($40/month); Pets allowed
Exterior
- Parking: Attached garage (2 spaces)
- Utilities: Public water; Public sewer; Cable available; Electricity available; Phone available
- Home design: Single family residence; One-story; Faces west
- Construction: Block and stucco construction; Shingle roof; Block and slab foundation; Built on a lot under 1/4 acre
- Exterior features: Irrigation system; Asphalt and concrete road access; Lot approximately 0.24 acres
Interior
- Kitchen: Dishwasher; Disposal; Microwave; Range
- Bedrooms: 4 bedrooms
- Flooring: Carpet
- Bathrooms: 2 full bathrooms
- Heating & cooling: Central heating; Central air conditioning
- Interior features: Ceiling fans
- Laundry & utility: Laundry room
Neighborhood map
What this means for you Summary
Snapshot
- This is a 3-bed/2.0-bath single-family listed at $380k.
Deal economics
- At list price, monthly cash flow is $-764 ($-9k/yr) — negative.
- To cash-flow at today's rent, offer at most $245k (35.5% below list).
- To meet the 1% rule (rent ≥ 1% of price), the offer needs to be $247k (34.9% below list).
- Recommended offer: $245k (35.5% below list) — sets the bar for cash-flow.
Location & tenants
- Location reads 71/100 on livability (#405 in FL) — a middle-class / working-renter tenant base. Strengths: cost of living A+, housing A+, health & safety A+; Watch: amenities F, commute F.
- Lake (suburban): math 49% / reading 50% proficiency, ranked #37 of 73 in FL (top 51%) — families likely to look elsewhere, expect single-tenant / working-renter base with shorter leases.
- Zoned schools: Mascotte Elementary School (math 50% / reading 47%, grade D, #1,152 of 2,144 statewide, top 55%, 855 students, 62% FRL, charter); South Lake High School (math 36% / reading 39%, grade F, #336 of 667 statewide, top 51%, 2,169 students, 40% FRL) — zoned schools at 51% FRL track the district average.
- Market conditions: 98 active listings in the ZIP; 6 comparable units currently listed for rent nearby; rentals at typical pace (median 24d on market — plan ~3-4 weeks tenant-placement turnaround); solid renter incomes; 4,799 units permitted in Lake County in 2024 (814 in 5+ unit buildings).
- This rent runs 35% of the median local income ($84k/yr) — at the standard rent-burdened threshold; future hikes will face affordability resistance.
Forward outlook
- In year one you build about $41k of equity ($3k loan paydown + $38k appreciation (10.0% local appreciation)).
- Lake County population projected at +37% by 2050 — long-run rental-demand tailwind backs the buy-and-hold thesis.
- By year 2, paydown + projected appreciation supports a ~$65k cash-out refi (75% LTV) — recoverable capital for the next deal without selling this one.
Negotiation context
- Only 1 days on market — expect competitive offers; lowballing is unlikely to land.
Risks & watch-outs
- Climate carrying-cost: severe wind risk, 99% chance of damaging wind over 30y; major wildfire risk; extreme-heat days projected 7→23/yr by 2055 (HVAC capex compounding) — expect insurance premiums to compound above CPI over the hold.
Questions for the listing agent
- What do current leases actually rent for vs. the listed asking? Can we see a recent rent roll and the last 12 months of T-12 income?
- What does the HOA fee cover, when was the last increase, and are there any pending special assessments or reserve-fund shortfalls?
- Is there a deadline driving the sale (1031 exchange, divorce, estate, relocation)? That informs how much negotiation room exists.
- Schools are D-rated, which usually means shorter tenancies and higher turnover. Who's the typical renter profile here, and what's been the actual vacancy rate?
- The area grade is low — what's the realistic commute time and amenity access for the typical tenant pool here? Any planned neighborhood developments (good or bad) we should know about?
- What's the average days-on-market for RENTAL listings here right now (not sales)? A rising rental-DOM trend means longer vacancies and softer asking-rent achievability than the comps imply.
- What's the recent tenant-quality profile in this submarket — average credit score on applications, eviction rate, late-payment / NSF rate, and stable-employment percentage? A property-management company in the area should have these aggregated.
- How much new for-sale + rental construction is in the pipeline within 1–3 miles? Heavy new supply typically softens prices + rents 12–24 months out; constrained supply supports both.
Investment metrics
- 1% rule
- 0.65% ✗
- Cap rate
- 3.88%
- Cash-on-cash
- -8.61%
- DSCR
- 0.62
- GRM
- 12.8
CMA / ARV
No comps found within radius.
Projected returns pro-forma
10.0% appreciation · 3.0% rent growth · sell at horizon
- IRR
- 18.2%
- Equity multiple
- 2.49×
- Total profit
- $158,414
- Equity at exit
- $342,334
- IRR
- 17.0%
- Equity multiple
- 5.75×
- Total profit
- $504,937
- Equity at exit
- $738,256
Cash invested: $106,400 (down + closing). Projections, not guarantees.
Landlord ↔ Tenant lean methodology
- Overall (STATE)
- 87 Strongly Landlord-Friendly
- State Florida
- 87 Strongly Landlord-Friendly · R+3
- County
- — inherits STATE
- City
- — inherits STATE
ZIP-level market 34753
- Home prices YoY
- 7.2%
- Active inventory
- 98
- Price-to-rent
- 12.8×
Monthly cashflow live
- Estimated rent
- $2,473 high interval (Pro) →
- Mortgage (P&I)
- −$1,993
- Tax from tax record
- −$527 /mo · $6,319/yr
- Insurance
- −$158
- HOA
- −$40
- Vacancy / Maint / Mgmt
- −$519
- Net cashflow
- $-764
Break-even live
UW: 25.0% down · 7.5% · 30yr · 1.5% tax · 5.0% vac · 8.0% maint · 8.0% mgmt
Financing live
Cash to close
- Down payment
- $95,000
- Closing costs
- $11,400
- Reserves months
- —
- Total cash needed
- —
Loan-product check · same deal, 3 products live
Conventional
25% down · 7.5% · 30yr
- Down + closing
- —
- Monthly P&I
- —
- Monthly cashflow
- —
- DSCR
- —
- Eligible?
- —
Personal DTI + credit; lowest rate.
DSCR
20% down · 8.5% · 30yr
- Down + closing
- —
- Monthly P&I
- —
- Monthly cashflow
- —
- DSCR
- —
- Eligible?
- —
No personal income docs; deal must DSCR.
Hard money
10% down · 12.0% · 12mo
- Down + closing
- —
- Monthly P&I
- —
- Monthly cashflow
- —
- DSCR
- —
- Eligible?
- —
Short-term bridge; refi at stabilization.
Rent comps 6 comps
| Address | Beds | Baths | Sqft | Rent | $/sqft | DOM | Units | Dist |
|---|---|---|---|---|---|---|---|---|
| 2425 Begonia St Mascotte, FL | 4.0 | 2.0 | 1983 | $2,350 | $1.19 | 23d | 1 | 0.11mi |
| 1665 Luft Ln Mascotte, FL | 3.0 | 2.0 | 1680 | $2,030 | $1.21 | 23d | 1 | 0.39mi |
| 6337 Chorus Dr Groveland, FL | 3.0 | 2.0 | 1772 | $2,250 | $1.27 | 23d | 1 | 1.27mi |
| 6612 Tempo Way Mascotte, FL | 3.0 | 2.0 | 1990 | $2,600 | $1.31 | 4d | 1 | 1.28mi |
| 2009 Sloans Outlook Dr Groveland, FL | 3.0 | 2.0 | 1670 | $2,250 | $1.35 | 20d | 1 | 1.45mi |
| 201 Sangmon Ct Groveland, FL | 3.0 | 2.5 | 1920 | $2,299 | $1.20 | 4d | 1 | 1.47mi |
HOA detail
- Monthly dues
- $40 · $480/yr
Listing history 10 events
-
2026-06-18pricedays on market $380,000 Active 1 DOM
-
2026-05-31days on market $415,990 Active 462 DOM
-
2026-03-21price $415,990
-
2026-01-22price $385,000
-
2025-11-27price $400,000
-
2025-10-27price $325,000
-
2025-09-01price $420,000
-
2025-09-01price $430,000
-
2025-06-17price $445,000
-
2025-02-23$470,000 Active
ⓘ Source: listings_history table (triggers on properties + properties_extension) + one-shot
backfill from property_details.listing_events for pre-trigger history.
Tax reassessment forecast FL · Resets to sale price
- Current annual tax
- $6,319 · $527/mo
- Projected year-2 tax
- $6,319 · $527/mo
- Expected delta
- $0/yr ($0/mo · 0.0%)
ⓘ Screening estimate from a state-policy table — verify with the county assessor before closing.
Climate risk First Street
- Flood 1/10 Low FEMA zone X (unshaded) · 0% chance over 30 yrs
- Wildfire 7/10 Severe
- Heat 8/10 Severe 7 d/yr ≥108°F today · 23 d/yr by 30 yrs out
- Wind 9/10 Extreme 99% chance of damaging wind over 30 yrs
- Air quality 1/10 Low 0 unhealthy d/yr today · 0 by 30 yrs out
Nearby sold comps map
Loading sold comps map…
Walkable amenities ~0.75 mi
Loading nearby amenities…
Taxation est. · year 1
- Rental income
- $29,681
- − Mortgage interest
- −$21,286
- − Property taxes
- −$6,319
- − Insurance
- −$1,900
- − Repairs & maintenance
- −$2,375
- − Management
- −$2,375
- − HOA
- −$480
- − Depreciation
- −$11,055
- Taxable loss
- −$16,107
- Est. tax savings @ 24.0%
- +$3,866
- After-tax cash flow
- $-5,298/yr
For passive investors: Depreciation is non-cash, so a rental often shows a tax loss while cash-flowing — sheltering income. Rental losses are passive: they offset passive income freely, and up to $25,000/yr can offset ordinary (W-2) income if you actively participate and your MAGI is under $100k (phasing out to $0 by $150k); unused losses carry forward. On sale, claimed depreciation is recaptured at up to 25%, and gains may owe capital-gains tax (a 1031 exchange can defer both). Figures are a year-1 estimate at your 24.0% rate — not tax advice; consult a CPA.
Schools (NCES district)
- District
- Lake
- NCES district ID
- 1201050
- Math proficiency
- 49% ▼ -7.00%
- Reading proficiency
- 50% ▼ -4.00%
- Median HH income
- $46,632
- Composite
- 42.05/100
- National rank
- #3327
- State rank
- #37 of 73 in FL
Livability — Mascotte
- Score
- 71/100
- State rank
- #405
- US rank
- #7156
Category grades
Schools grade is shown separately in the Schools card above.
Census & demographics
- Census place
- Mascotte, FL
- County
- Lake County · 364,602 people
- City population
- 33,565
- Metro
- Orlando-Kissimmee-Sanford, FL
- Population (ZIP)
- 7,985
- Household income
- $83,868
- Rent vs Own
- Severe rent burden
- 16.0
Population outlook (Lake County) Hauer SSP2
- Today (2025)
- 386,640 people
- By 2030
- 417,107 · +7.9%
- By 2040
- 476,676 · +23.3%
- By 2050
- 531,296 · +37.4%
- By 2075
- 648,303 · +67.7%
- By 2100
- 698,530 · +80.7%
Race, ethnicity, and origin ACS 2023
- Neighborhood character
- Diverse neighborhood (Simpson 0.69)
- Race & ethnicity
- White 38% Hispanic / Latino 35% Two or more races 25% Black 20% Asian 3%
- Hispanic origin (detail)
- Mexican 11% Puerto Rican 12% Dominican 2%
- Common ancestry
- Slovak 1% Serbian 1% Romanian 1%
- Foreign-born
- 10% · Canada, Jamaica
- Languages at home
- 67% English-only · Spanish 32%
Political lean MEDSL · Lake
- 2024 margin
- Strong R (+24.7) · D 37.3% · R 62.0%
- 2008→2024 swing
- -11.2pp toward R · 2008: -13.5pp · 2024: -24.7pp
- All cycles
- 2024: R+24.7 2020: R+20.0 2016: R+23.1 2012: R+17.1 2008: R+13.5
Not yet ingested
- Civics
- —
Market trends
- HPI YoY
- ▲ 19.01%
- Current HPI
- 281.96
- Rent YoY
- —
- Metro
- Orlando-Kissimmee-Sanford, FL
- State GDP YoY
- ▲ 3.28%
- F500 in state
- 36
Industry mix (Fortune 500 HQ in FL)
| Industry | F500 HQs | Revenue |
|---|---|---|
| Industrial Technology | 2 | $29B |
|
||
| Insurance | 2 | $17B |
|
||
| Retail | 1 | $60B |
|
||
| Technology Distribution | 1 | $58B |
|
||
| Homebuilding | 1 | $35B |
|
||
| Technology Manufacturing | 1 | $35B |
|
||
Price history
-11.5% since first listed8 events — show timeline
- 2026-03-21 Price Changed $415,990 Stellar MLS as Distributed by MLS Grid
- 2026-01-22 Price Changed $385,000 Stellar MLS as Distributed by MLS Grid
- 2025-11-27 Price Changed $400,000 Stellar MLS as Distributed by MLS Grid
- 2025-10-27 Price Changed $325,000 Stellar MLS as Distributed by MLS Grid
- 2025-09-01 Price Changed $420,000 Stellar MLS as Distributed by MLS Grid
- 2025-09-01 Price Changed $430,000 Stellar MLS as Distributed by MLS Grid
- 2025-06-17 Price Changed $445,000 Stellar MLS as Distributed by MLS Grid
- 2025-02-23 Listed $470,000 Stellar MLS as Distributed by MLS Grid
Property tax history
+116.2%/yrLatest (2025): $6,319 · -4.5% YoY. Source: county tax records.
Cash-flow waterfall
monthlySold comps — $/sqft
last 12 mo · ≤1 miLoading sold comps…