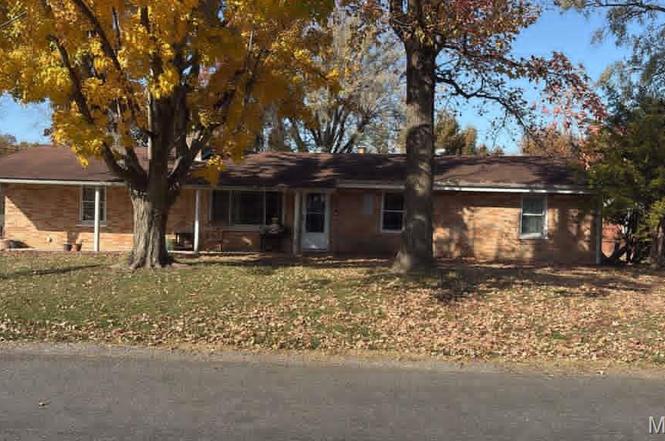
5006 Staten Dr · Godfrey, IL
Flood risk 1/10 · Minimal
- FEMA flood zone
- X
- Chance of flooding over 30 yrs
- 0.0%
- Est. flood insurance / yr
- $507 – $1,088
Fire risk 1/10 · Minimal
- Est. fire insurance / yr
- $804 – $1,492
Heat risk 4/10 · Minor
- Hot days now (above 107°F)
- 7 days/yr
- Hot days in 30 yrs
- 20 days/yr
Wind risk 2/10 · Minimal
- Chance of severe wind over 30 yrs
- 1.0%
Air-quality risk 3/10 · Minor
- Unhealthy air days now
- 2 days/yr
- Unhealthy air days in 30 yrs
- 4 days/yr
Risk factors via First Street. Map © Google.
Why this score? — see what drove the B- grade
The composite is a weighted blend of 9 inputs, each scored 0–100. Each bar is that input's sub-score; the figure is the points it added to the 100-point composite (weight × sub-score).
- Cash flow +30.0/30.0
- 1% rule +10.0/10.0
- DSCR +10.0/10.0
- ARV discount +7.5/15.0
- Livability +3.2/5.0
- Rent growth +2.5/5.0
- Condition / age +2.5/5.0
- Schools +1.1/10.0
- Appreciation +0.0/10.0
$65,000
🖨 Deal sheet 📄 Offer letter ✓ Due diligence
Listing remarks MLS
3 BEDROOM, 2 BATH HOME FEATURING AN UPGRADED 100 AMP SERVICE, NEWER FURNACE, WATER HEATER, AND CENTRAL AIR, NEWER LAMINATE FLOORING, FIREPLACE, DETACHED SHED GREAT FOR STORAGE, FENCED BACKYARD, SOLD "AS IS", FREDDIE MAC FIRST LOOK INITIATIVE - OWNER OCCUPANTS HAVE PRIORITY FOR THE FIRST 15 DAYS THE HOME IS ON THE MARKET, DAY 16 INVESTORS MAY SUBMIT OFFERS, HOMESTEPS WINTER SALES PROMOTION - OWNER OCCUPANT CONTRACTS APPROVED BY JANUARY 31, 2012 AND CLOSE BY MARCH 15, 2012 CAN RECEIVE UP TO 3% IN CLOSING COSTS PAID BY SELLER AND A 2 YEAR HOME WARRANTY, SELLING AGENCY CAN RECEIVE A $1000 SELLING BONUS.
Key facts
- 0.29 acre lot
- Garage
- Built 1962
Neighborhood map
What this means for you Summary
Snapshot
- This is a 3-bed/1.0-bath single-family listed at $65k.
Deal economics
- At list price, monthly cash flow is $304 ($4k/yr) — positive.
- The deal already cash-flows at list — no discount required.
- Meets the 1% rule at list price ($1k rent vs $65k).
- Cap rate 11.9% vs local median 3.6% in Godfrey — top-decile yield for the area; either an underpriced asset or a hidden risk that comps aren't pricing in. Stress-test before assuming the spread holds.
Location & tenants
- Location reads 64/100 on livability (#683 in IL) — a middle-class / working-renter tenant base. Strengths: employment A+, cost of living A+, housing A+; Watch: amenities F, commute F, health & safety F.
- Alton CUSD 11 (suburban): math 12% / reading 13% proficiency, ranked #544 of 620 in IL (top 88%) — low school quality limits family demand, transient renter base, plan for 1-2y turnover; 60% free/reduced lunch — lower-income household profile, screen leases tightly.
- Zoned schools: Alton High School (math 20% / reading 25%, grade F, #317 of 693 statewide, top 46%, 1,990 students, 0% FRL) — zoned schools average 0% FRL vs 60% district-wide (60 pts lower); this property's tenant base skews higher-income than the district average.
- Market conditions: 61 active listings in the ZIP; 2 comparable units currently listed for rent nearby; 336 units permitted in Madison County in 2024 (0 in 5+ unit buildings).
Forward outlook
- Local home prices are declining (-3.0%/yr); year-one equity from $449 of loan paydown is wiped out by about $2k of value loss. Plan a longer hold.
- Madison County population projected at -18% by 2050 — secular population decline; favor cash flow + early exit over multi-decade hold.
- At projected returns (-3.0% appreciation + 3.0% rent growth), your $18k cash investment doubles in ~7 years — after that, you're playing with house money.
Negotiation context
- Only 1 days on market — expect competitive offers; lowballing is unlikely to land.
- 2 sale attempts since 15y ago with the ask held roughly flat each time — persistent listings suggest the price (not the market) is what's stuck; bring a comps-based counter.
Risks & watch-outs
- Watch-outs: property tax is 4.6% of price.
Questions for the listing agent
- Built in 1962 — when were the roof, HVAC, electrical panel, plumbing, and water heater last replaced?
- Property tax is high relative to price — has the assessment been appealed recently, and will the sale trigger a re-assessment?
- Is there a deadline driving the sale (1031 exchange, divorce, estate, relocation)? That informs how much negotiation room exists.
- Schools are F-rated, which usually means shorter tenancies and higher turnover. Who's the typical renter profile here, and what's been the actual vacancy rate?
- What's the average days-on-market for RENTAL listings here right now (not sales)? A rising rental-DOM trend means longer vacancies and softer asking-rent achievability than the comps imply.
- What's the recent tenant-quality profile in this submarket — average credit score on applications, eviction rate, late-payment / NSF rate, and stable-employment percentage? A property-management company in the area should have these aggregated.
- How much new for-sale + rental construction is in the pipeline within 1–3 miles? Heavy new supply typically softens prices + rents 12–24 months out; constrained supply supports both.
Investment metrics
- 1% rule
- 1.79% ✓
- Cap rate
- 11.90%
- Cash-on-cash
- 20.01%
- DSCR
- 1.89
- GRM
- 4.6
CMA / ARV
- ARV (on-the-fly)
- $179,820
- Comps found
- 7
Show comp detail 7 sales within ~0.75 mi
| Address | Dist | Beds/Ba | Sqft | Sold | Price | $/sf | Match |
|---|---|---|---|---|---|---|---|
| 5006 Staten Dr | 0.00mi | 3/1.0 | 1,215 (0%) | 1mo | $65,000 | $53 | 100 |
| 4925 Hill Dr | 0.23mi | 3/1.0 | 1,310 (+8%) | 4mo | $124,900 | $95 | 72 |
| 1603 Mont Vista Ave | 0.31mi | 2/1.0 (-1) | 1,144 (-6%) | 12mo | $169,000 | $148 | 61 |
| 4807 Longview | 0.49mi | 3/1.5 | 1,224 (+1%) | 16mo | $135,000 | $110 | 61 |
| 4900 Eiffel Dr | 0.54mi | 3/2.0 | 1,170 (-4%) | 11mo | $185,000 | $158 | 55 |
| 5102 Dixon Dr | 0.45mi | 3/2.0 | 1,170 (-4%) | 22mo | $192,500 | $165 | 51 |
| 1504 Colonial Dr | 0.51mi | 3/2.5 | 1,324 (+9%) | 17mo | $215,000 | $162 | 41 |
Match score weights: distance 35% · size 25% · config 20% · recency 20%. Top-matched comps best support the ARV.
Projected returns pro-forma
-3.0% appreciation · 3.0% rent growth · sell at horizon
- IRR
- 12.3%
- Equity multiple
- 1.49×
- Total profit
- $8,921
- Equity at exit
- $9,692
- IRR
- 21.3%
- Equity multiple
- 2.82×
- Total profit
- $33,154
- Equity at exit
- $5,620
Cash invested: $18,200 (down + closing). Projections, not guarantees.
Landlord ↔ Tenant lean methodology
- Overall (STATE)
- 43 Moderately Tenant-Leaning
- State Illinois
- 43 Moderately Tenant-Leaning · D+7
- County
- — inherits STATE
- City
- — inherits STATE
ZIP-level market 62035
- Home prices YoY
- -26.0%
- Active inventory
- 61
- Price-to-rent
- 4.6×
Monthly cashflow live
- Estimated rent
- $1,166 medium interval (Pro) →
- Mortgage (P&I)
- −$341
- Tax from tax record
- −$250 /mo · $2,996/yr
- Insurance
- −$27
- HOA
- −$0
- Vacancy / Maint / Mgmt
- −$245
- Net cashflow
- $304
Break-even live
UW: 25.0% down · 7.5% · 30yr · 1.5% tax · 5.0% vac · 8.0% maint · 8.0% mgmt
Financing live
Cash to close
- Down payment
- $16,250
- Closing costs
- $1,950
- Reserves months
- —
- Total cash needed
- —
Loan-product check · same deal, 3 products live
Conventional
25% down · 7.5% · 30yr
- Down + closing
- —
- Monthly P&I
- —
- Monthly cashflow
- —
- DSCR
- —
- Eligible?
- —
Personal DTI + credit; lowest rate.
DSCR
20% down · 8.5% · 30yr
- Down + closing
- —
- Monthly P&I
- —
- Monthly cashflow
- —
- DSCR
- —
- Eligible?
- —
No personal income docs; deal must DSCR.
Hard money
10% down · 12.0% · 12mo
- Down + closing
- —
- Monthly P&I
- —
- Monthly cashflow
- —
- DSCR
- —
- Eligible?
- —
Short-term bridge; refi at stabilization.
Rent comps 2 comps
| Address | Beds | Baths | Sqft | Rent | $/sqft | DOM | Units | Dist |
|---|---|---|---|---|---|---|---|---|
| 1232 Surrey Ct Godfrey, IL | 2.0 | 1.0 | 865 | $970 | $1.12 | 1d | 1 | 0.93mi |
| 5003 Cavalier Ct Godfrey, IL | 3.0 | 2.0 | 1024 | $1,350 | $1.32 | 1d | 1 | 1.03mi |
Listing history 5 events
-
2025-11-14$65,000 Active
-
2012-03-22soldstatus 616-char remark
Show marketing remark (616 chars)
3 BEDROOM, 2 BATH HOME FEATURING AN UPGRADED 100 AMP SERVICE, NEWER FURNACE, WATER HEATER, AND CENTRAL AIR, NEWER LAMINATE FLOORING, FIREPLACE, DETACHED SHED GREAT FOR STORAGE, FENCED BACKYARD, SOLD "AS IS", FREDDIE MAC FIRST LOOK INITIATIVE - OWNER OCCUPANTS HAVE PRIORITY FOR THE FIRST 15 DAYS THE HOME IS ON THE MARKET, DAY 16 INVESTORS MAY SUBMIT OFFERS, HOMESTEPS WINTER SALES PROMOTION - OWNER OCCUPANT CONTRACTS APPROVED BY JANUARY 31, 2012 AND CLOSE BY MARCH 15, 2012 CAN RECEIVE UP TO 3% IN CLOSING COSTS PAID BY SELLER AND A 2 YEAR HOME WARRANTY, SELLING AGENCY CAN RECEIVE A $1000 SELLING BONUS.
-
2011-12-12$77,500 616-char remark
Show marketing remark (616 chars)
3 BEDROOM, 2 BATH HOME FEATURING AN UPGRADED 100 AMP SERVICE, NEWER FURNACE, WATER HEATER, AND CENTRAL AIR, NEWER LAMINATE FLOORING, FIREPLACE, DETACHED SHED GREAT FOR STORAGE, FENCED BACKYARD, SOLD "AS IS", FREDDIE MAC FIRST LOOK INITIATIVE - OWNER OCCUPANTS HAVE PRIORITY FOR THE FIRST 15 DAYS THE HOME IS ON THE MARKET, DAY 16 INVESTORS MAY SUBMIT OFFERS, HOMESTEPS WINTER SALES PROMOTION - OWNER OCCUPANT CONTRACTS APPROVED BY JANUARY 31, 2012 AND CLOSE BY MARCH 15, 2012 CAN RECEIVE UP TO 3% IN CLOSING COSTS PAID BY SELLER AND A 2 YEAR HOME WARRANTY, SELLING AGENCY CAN RECEIVE A $1000 SELLING BONUS.
-
2005-08-24soldstatus $101,000
-
2004-03-30soldstatus $87,000
ⓘ Source: listings_history table (triggers on properties + properties_extension) + one-shot
backfill from property_details.listing_events for pre-trigger history.
Tax reassessment forecast IL · Partial reset (capped growth)
- Current annual tax
- $2,996 · $250/mo
- Projected year-2 tax
- $2,996 · $250/mo
- Expected delta
- $0/yr ($0/mo · 0.0%)
ⓘ Screening estimate from a state-policy table — verify with the county assessor before closing.
Climate risk First Street
- Flood 1/10 Low FEMA zone X · 0% chance over 30 yrs
- Wildfire 1/10 Low
- Heat 4/10 Moderate 7 d/yr ≥107°F today · 20 d/yr by 30 yrs out
- Wind 2/10 Low 100% chance of damaging wind over 30 yrs
- Air quality 3/10 Moderate 2 unhealthy d/yr today · 4 by 30 yrs out
Nearby sold comps map
Loading sold comps map…
Walkable amenities ~0.75 mi
Loading nearby amenities…
Taxation est. · year 1
- Rental income
- $13,992
- − Mortgage interest
- −$3,641
- − Property taxes
- −$2,996
- − Insurance
- −$325
- − Repairs & maintenance
- −$1,119
- − Management
- −$1,119
- − Depreciation
- −$1,891
- Taxable income
- $2,901
- Est. tax owed @ 24.0%
- −$696
- After-tax cash flow
- $2,946/yr
For passive investors: Depreciation is non-cash, so a rental often shows a tax loss while cash-flowing — sheltering income. Rental losses are passive: they offset passive income freely, and up to $25,000/yr can offset ordinary (W-2) income if you actively participate and your MAGI is under $100k (phasing out to $0 by $150k); unused losses carry forward. On sale, claimed depreciation is recaptured at up to 25%, and gains may owe capital-gains tax (a 1031 exchange can defer both). Figures are a year-1 estimate at your 24.0% rate — not tax advice; consult a CPA.
Schools (NCES district)
- District
- Alton CUSD 11
- NCES district ID
- 1703600
- Math proficiency
- 12% ▼ -10.00%
- Reading proficiency
- 13% ▼ -10.00%
- Median HH income
- $46,257
- Composite
- 11.34/100
- National rank
- #9710
- State rank
- #544 of 620 in IL
Livability — Godfrey
- Score
- 64/100
- State rank
- #683
- US rank
- #13969
Category grades
Schools grade is shown separately in the Schools card above.
Census & demographics
- Census place
- Godfrey, IL
- City population
- 15,915
- Population (ZIP)
- 15,915
Population outlook (Madison County) Hauer SSP2
- Today (2025)
- 258,371 people
- By 2030
- 251,523 · -2.7%
- By 2040
- 233,640 · -9.6%
- By 2050
- 213,042 · -17.5%
- By 2075
- 165,255 · -36.0%
- By 2100
- 123,953 · -52.0%
Race, ethnicity, and origin ACS 2023
- Neighborhood character
- Predominantly White (88%)
- Race & ethnicity
- White 88% Black 5% Two or more races 5% Hispanic / Latino 2%
- Common ancestry
- Italian 3% Romanian 2% Slovak 2%
- Foreign-born
- 1%
Political lean MEDSL · Madison
- 2024 margin
- R (+13.3) · D 42.5% · R 55.8% · Other 1.8%
- 2008→2024 swing
- -22.5pp toward R · 2008: 9.2pp · 2024: -13.3pp
- All cycles
- 2024: R+13.3 2020: R+13.2 2016: R+15.6 2012: R+1.4 2008: D+9.2
Not yet ingested
- Civics
- —
Market trends
- HPI YoY
- ▼ -71.86%
- Current HPI
- 204.9507
- Rent YoY
- —
- Metro
- —
- State GDP YoY
- ▲ 1.59%
- F500 in state
- 60
Industry mix (Fortune 500 HQ in IL)
| Industry | F500 HQs | Revenue |
|---|---|---|
| Insurance | 4 | $201B |
|
||
| Consumer Goods | 4 | $87B |
|
||
| Industrial Machinery | 3 | $64B |
|
||
| Healthcare | 2 | $55B |
|
||
| Retail / Pharmacy | 1 | $148B |
|
||
| Agriculture / Food | 1 | $86B |
|
||
Price history
-25.3% since first listed5 events — show timeline
- 2025-11-14 Listed $65,000 MARIS as Distributed by MLS Grid
- 2012-03-22 Sold (MLS) — MARIS as Distributed by MLS Grid
- 2011-12-12 Listed $77,500 MARIS as Distributed by MLS Grid
- 2005-08-24 Sold (Public Records) $101,000 Public Records
- 2004-03-30 Sold (Public Records) $87,000 Public Records
Property tax history
+4.1%/yrLatest (2024): $2,996 · +5.9% YoY. Source: county tax records.
Cash-flow waterfall
monthlySold comps — $/sqft
last 12 mo · ≤1 miLoading sold comps…