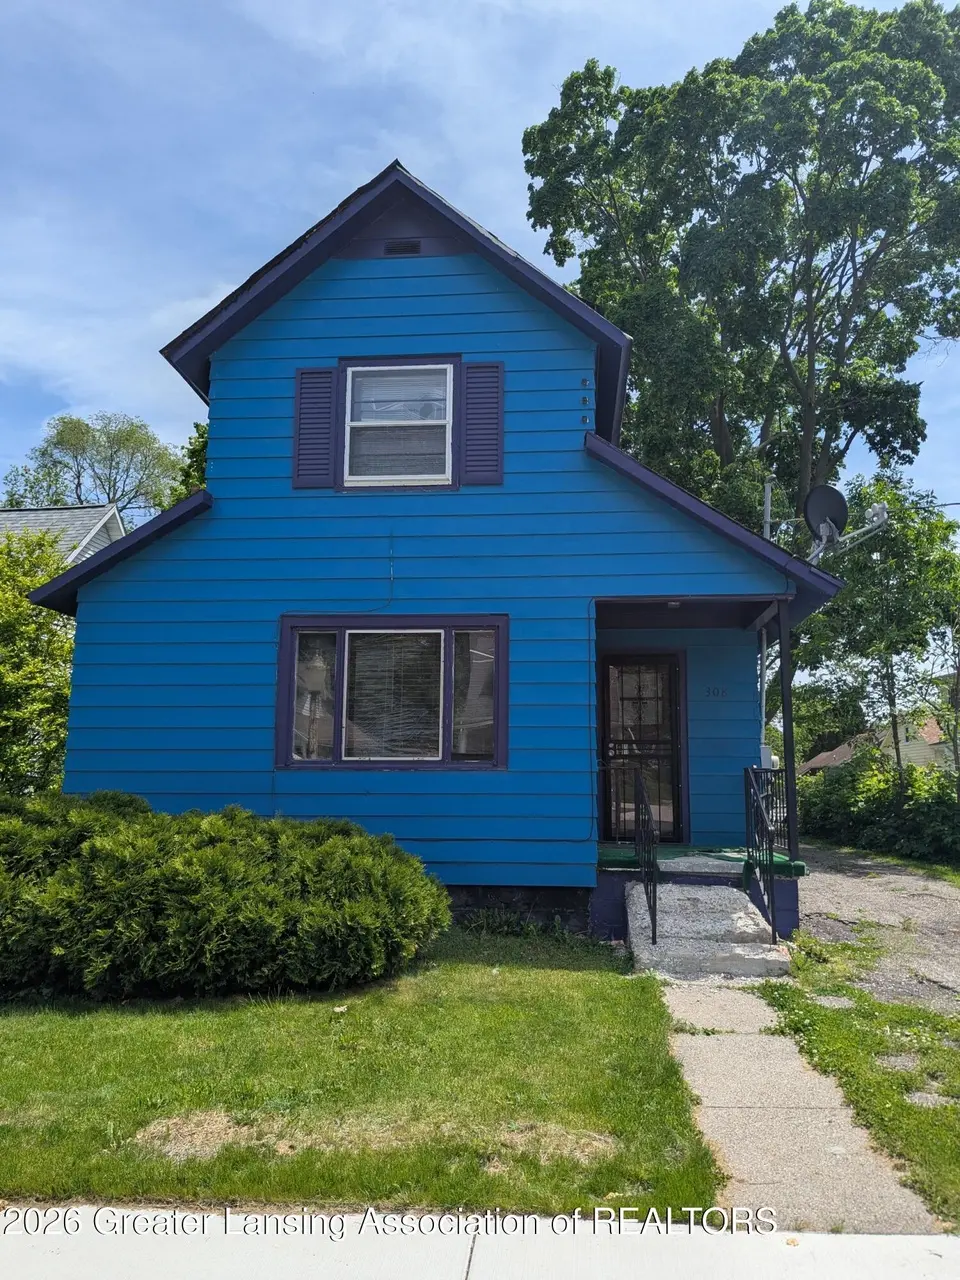
308 Bartlett St · Lansing, MI
Flood risk 1/10 · Minimal
- FEMA flood zone
- X (unshaded)
- Chance of flooding over 30 yrs
- 0.0%
- Est. flood insurance / yr
- $473 – $860
Fire risk 1/10 · Minimal
- Est. fire insurance / yr
- $784 – $1,456
Heat risk 2/10 · Minimal
- Hot days now (above 97°F)
- 7 days/yr
- Hot days in 30 yrs
- 16 days/yr
Wind risk 2/10 · Minimal
- Chance of severe wind over 30 yrs
- —
Air-quality risk 2/10 · Minimal
- Unhealthy air days now
- 1 days/yr
- Unhealthy air days in 30 yrs
- 2 days/yr
Risk factors via First Street. Map © Google.
Why this score? — see what drove the B- grade
The composite is a weighted blend of 9 inputs, each scored 0–100. Each bar is that input's sub-score; the figure is the points it added to the 100-point composite (weight × sub-score).
- Cash flow +30.0/30.0
- 1% rule +10.0/10.0
- DSCR +10.0/10.0
- ARV discount +7.5/15.0
- Livability +4.0/5.0
- Rent growth +2.5/5.0
- Condition / age +2.5/5.0
- Schools +1.9/10.0
- Appreciation +0.0/10.0
$39,000
🖨 Deal sheet 📄 Offer letter ✓ Due diligence
Listing remarks MLS
This property sits in a very desirable neighborhood but is in need of serious TLC and elbow grease starting with a roof. There is a hole in the roof and missing shingles but anyone who's got a connection to a roofing contractor will be able to see the ARV potential. As for the interior, the home is In need of a gut renovation and the former majesty of this two-story home can be brought back to its restored glory or made into contemporary eye candy!
Key facts
- 6,969 sq ft lot
- Built 1895
- Listed 10 days
Property features AI
Finance
- Financial info: Property currently used as primary and investment
Exterior
- Parking: Driveway (no attached garage)
- Utilities: Public sewer
- Home design: Traditional style; Two levels; Built in 1895; Front faces east; City street frontage
- Construction: Aluminum and vinyl siding; Shingle roof; Full concrete basement
- Exterior features: Partial fencing; City lot; Neighborhood view
Interior
- Kitchen: Combined kitchen and dining area; Dishwasher
- Bedrooms: 3 bedrooms (Primary bedroom listed)
- Flooring: Wood; Vinyl; Linoleum; Varies
- Bathrooms: 2 full bathrooms
- Heating & cooling: Hot water heating; Electric cooling with window units
- Interior features: Laminate counters; Blinds
- Laundry & utility: Washer hookup in lower-level basement; Laundry area located in basement
Neighborhood map
What this means for you Summary
Snapshot
- This is a 3-bed/1.0-bath single-family listed at $39k.
Deal economics
- At list price, monthly cash flow is $699 ($8k/yr) — positive.
- The deal already cash-flows at list — no discount required.
- Meets the 1% rule at list price ($1k rent vs $39k).
- Cap rate 27.8% vs local median 6.0% in Lansing — top-decile yield for the area; either an underpriced asset or a hidden risk that comps aren't pricing in. Stress-test before assuming the spread holds.
Location & tenants
- Location reads 79/100 on livability (#94 in MI, #2,182 nationally) — a middle-class / working-renter tenant base. Strengths: amenities A+, commute A+, cost of living A+; Watch: employment D, schools F, crime F.
- Lansing Public School District (urban): math 14% / reading 23% proficiency, ranked #650 of 760 in MI (top 86%) — low school quality limits family demand, transient renter base, plan for 1-2y turnover; 68% free/reduced lunch — lower-income household profile, screen leases tightly.
- Market conditions: 68 active listings in the ZIP; 21 comparable units currently listed for rent nearby; rentals lingering (median 44d on market — plan ~5-8 weeks vacancy on turnover, expect pricing pressure); 57% of comp listings sitting > 30 days — soft ceiling on asking rent; 350 units permitted in Ingham County in 2024 (186 in 5+ unit buildings).
Forward outlook
- Local home prices are declining (-3.0%/yr); year-one equity from $270 of loan paydown is wiped out by about $1k of value loss. Plan a longer hold.
- Ingham County population projected at +11% by 2050 — modest demand growth; plan on rents tracking national, not racing it.
- At projected returns (-3.0% appreciation + 3.0% rent growth), your $11k cash investment doubles in ~2 years — after that, you're playing with house money.
Negotiation context
- Only 11 days on market — expect competitive offers; lowballing is unlikely to land.
- 2 sale attempts with the ask held roughly flat each time — persistent listings suggest the price (not the market) is what's stuck; bring a comps-based counter.
Risks & watch-outs
- Watch-outs: property tax is 3.9% of price; built in 1895 — expect roof / HVAC / electrical / plumbing capex.
Questions for the listing agent
- Built in 1895 — when were the roof, HVAC, electrical panel, plumbing, and water heater last replaced?
- Property tax is high relative to price — has the assessment been appealed recently, and will the sale trigger a re-assessment?
- Is there a deadline driving the sale (1031 exchange, divorce, estate, relocation)? That informs how much negotiation room exists.
- Schools are F-rated, which usually means shorter tenancies and higher turnover. Who's the typical renter profile here, and what's been the actual vacancy rate?
- Crime grade is F in this area — have there been break-ins, vandalism, or insurance claims at this property in the last 3 years? What carrier currently insures it and at what premium?
- What's the average days-on-market for RENTAL listings here right now (not sales)? A rising rental-DOM trend means longer vacancies and softer asking-rent achievability than the comps imply.
- What's the recent tenant-quality profile in this submarket — average credit score on applications, eviction rate, late-payment / NSF rate, and stable-employment percentage? A property-management company in the area should have these aggregated.
- How much new for-sale + rental construction is in the pipeline within 1–3 miles? Heavy new supply typically softens prices + rents 12–24 months out; constrained supply supports both.
Investment metrics
- 1% rule
- 3.39% ✓
- Cap rate
- 27.80%
- Cash-on-cash
- 76.81%
- DSCR
- 4.42
- GRM
- 2.5
CMA / ARV
- ARV (on-the-fly)
- $146,846
- Comps found
- 12
Show comp detail 12 sales within ~0.75 mi
| Address | Dist | Beds/Ba | Sqft | Sold | Price | $/sf | Match |
|---|---|---|---|---|---|---|---|
| 1217 W Shiawassee St | 0.07mi | 3/1.5 | 1,316 (+7%) | 3mo | $147,000 | $112 | 82 |
| 502 N Butler Blvd | 0.27mi | 3/1.0 | 1,176 (-5%) | 1mo | $144,000 | $122 | 79 |
| 319 Howe St | 0.14mi | 2/1.0 (-1) | 1,145 (-7%) | 1mo | $92,000 | $80 | 76 |
| 1403 W Ottawa St | 0.21mi | 4/2.0 (+1) | 1,260 (+2%) | 3mo | $163,500 | $130 | 75 |
| 1629 N Genesee Dr | 0.43mi | 3/2.0 | 1,176 (-5%) | 1mo | $213,800 | $182 | 67 |
| 920 Clyde St | 0.55mi | 3/1.5 | 1,204 (-2%) | 2mo | $170,000 | $141 | 67 |
| 908 Clyde St | 0.52mi | 2/1.0 (-1) | 1,222 (-1%) | 3mo | $138,000 | $113 | 66 |
| 425 N Sycamore St | 0.36mi | 3/2.0 | 1,109 (-10%) | 2mo | $113,000 | $102 | 61 |
| 919 Princeton Ave | 0.55mi | 3/1.5 | 1,119 (-9%) | 2mo | $60,000 | $54 | 55 |
| 916 Cleo St | 0.67mi | 3/1.5 | 1,124 (-9%) | 0mo | $172,000 | $153 | 52 |
| 905 N Sycamore St | 0.61mi | 3/1.5 | 1,368 (+11%) | 0mo | $130,000 | $95 | 52 |
| 1100 Comfort St | 0.73mi | 3/1.0 | 1,108 (-10%) | 2mo | $132,000 | $119 | 47 |
Match score weights: distance 35% · size 25% · config 20% · recency 20%. Top-matched comps best support the ARV.
Projected returns pro-forma
-3.0% appreciation · 3.0% rent growth · sell at horizon
- IRR
- 76.8%
- Equity multiple
- 4.50×
- Total profit
- $38,264
- Equity at exit
- $5,815
- IRR
- 80.5%
- Equity multiple
- 9.33×
- Total profit
- $90,916
- Equity at exit
- $3,372
Cash invested: $10,920 (down + closing). Projections, not guarantees.
Landlord ↔ Tenant lean methodology
- Overall (STATE)
- 62 Landlord-Friendly
- State Michigan
- 62 Landlord-Friendly · EVEN
- County
- — inherits STATE
- City
- — inherits STATE
ZIP-level market 48915
- Active inventory
- 68
- Price-to-rent
- 2.5×
Monthly cashflow live
- Estimated rent
- $1,324 high interval (Pro) →
- Mortgage (P&I)
- −$205
- Tax from tax record
- −$126 /mo · $1,515/yr
- Insurance
- −$16
- HOA
- −$0
- Vacancy / Maint / Mgmt
- −$278
- Net cashflow
- $699
Break-even live
UW: 25.0% down · 7.5% · 30yr · 1.5% tax · 5.0% vac · 8.0% maint · 8.0% mgmt
Financing live
Cash to close
- Down payment
- $9,750
- Closing costs
- $1,170
- Reserves months
- —
- Total cash needed
- —
Loan-product check · same deal, 3 products live
Conventional
25% down · 7.5% · 30yr
- Down + closing
- —
- Monthly P&I
- —
- Monthly cashflow
- —
- DSCR
- —
- Eligible?
- —
Personal DTI + credit; lowest rate.
DSCR
20% down · 8.5% · 30yr
- Down + closing
- —
- Monthly P&I
- —
- Monthly cashflow
- —
- DSCR
- —
- Eligible?
- —
No personal income docs; deal must DSCR.
Hard money
10% down · 12.0% · 12mo
- Down + closing
- —
- Monthly P&I
- —
- Monthly cashflow
- —
- DSCR
- —
- Eligible?
- —
Short-term bridge; refi at stabilization.
Rent comps 21 comps
| Address | Beds | Baths | Sqft | Rent | $/sqft | DOM | Units | Dist |
|---|---|---|---|---|---|---|---|---|
| 1109 W Washtenaw St Unit 5 Lansing, MI | 2.0 | 1.0 | 755 | $795 | $1.05 | 43d | 1 | 0.34mi |
| 712 N Sycamore St Lansing, MI | 3.0 | 1.0 | 1100 | $1,650 | $1.50 | 21d | 1 | 0.54mi |
| 731 N Sycamore St Unit 1 Lansing, MI | 2.0 | 1.0 | 950 | $945 | $0.99 | 43d | 1 | 0.54mi |
| 919 Princeton Ave Lansing, MI | 3.0 | 1.5 | 1119 | $1,475 | $1.32 | 21d | 1 | 0.59mi |
| 1330 W Hillsdale St Lansing, MI | 3.0 | 1.0 | 1008 | $1,550 | $1.54 | 43d | 1 | 0.59mi |
| 410 W Lapeer St Unit 1 Lansing, MI | 2.0 | 1.0 | 800 | $1,050 | $1.31 | 21d | 1 | 0.65mi |
| 524 N Walnut St Lansing, MI | 2.0 | 1.0 | 1000 | $1,150 | $1.15 | 43d | 1 | 0.67mi |
| 433 Seymour Ave Unit 3 Lansing, MI | 3.0 | 1.0 | 1250 | $1,395 | $1.12 | 43d | 1 | 0.70mi |
| 1010 N Pine St Unit B Lansing, MI | 2.0 | 1.0 | 750 | $1,100 | $1.47 | 43d | 1 | 0.80mi |
| 122 Hathaway St Lansing, MI | 2.0 | 1.0 | 768 | $1,250 | $1.63 | 43d | 1 | 0.87mi |
| 401 S Washington Sq Unit 201 Lansing, MI | 3.0 | 1.0 | 1254 | $1,560 | $1.24 | 43d | 1 | 0.98mi |
| 401 S Washington Sq Unit 205 Lansing, MI | 2.0 | 1.0 | 968 | $1,355 | $1.40 | 43d | 1 | 0.98mi |
| 1012 Ontario St Lansing, MI | 4.0 | 2.0 | 1320 | $1,600 | $1.21 | 21d | 1 | 0.99mi |
| 400 N Catherine St Lansing, MI | 3.0 | 1.0 | 760 | $1,395 | $1.84 | 13d | 1 | 1.06mi |
| 605 S Grand Ave Unit 2 Lansing, MI | 4.0 | 1.0 | 1200 | $1,100 | $0.92 | 43d | 1 | 1.13mi |
| 920 S Washington Ave Lansing, MI | 1.0–2.0 | 1.0–2.0 | 900 | $1,250 | $1.39 | 13d | 1 | 1.18mi |
| 335 E Saint Joseph St Unit 6 Lansing, MI | 2.0 | 1.0 | 700 | $949 | $1.36 | 43d | 1 | 1.26mi |
| 113 Pere Marquette Dr Lansing, MI | 1.0–2.0 | 1.0–2.0 | 1065 | $2,250 | $2.11 | 13d | 9 | 1.29mi |
| 832 N Larch St Apt 3 Lansing, MI | 2.0 | 1.0 | 890 | $1,095 | $1.23 | 43d | 1 | 1.35mi |
| 620 May St Lansing, MI | 1.0–2.0 | 1.0–2.0 | 1126 | $1,578 | $1.40 | 13d | 12 | 1.37mi |
| 117 E North St Unit A Lansing, MI | 2.0 | 1.0 | 812 | $1,050 | $1.29 | 13d | 1 | 1.40mi |
Listing history 11 events
-
2026-06-08days on market $39,000 Active 11 DOM
-
2026-06-07days on market $39,000 Active 10 DOM
-
2026-06-05remarks 498-char remark
-
2026-06-05days on market $39,000 Active 7 DOM
-
2026-06-03days on market $39,000 Active 6 DOM
-
2026-06-02days on market $39,000 Active 5 DOM
-
2026-06-01days on market $39,000 Active 4 DOM
-
2026-05-31days on market $39,000 Active 3 DOM
-
2026-05-30days on market $39,000 Active 2 DOM
-
2026-05-28$39,000 Active
Show marketing remark (454 chars)
This property sits in a very desirable neighborhood but is in need of serious TLC and elbow grease starting with a roof. There is a hole in the roof and missing shingles but anyone who's got a connection to a roofing contractor will be able to see the ARV potential. As for the interior, the home is In need of a gut renovation and the former majesty of this two-story home can be brought back to its restored glory or made into contemporary eye candy!
-
2026-05-28$39,000 Active 454-char remark
Show marketing remark (454 chars)
This property sits in a very desirable neighborhood but is in need of serious TLC and elbow grease starting with a roof. There is a hole in the roof and missing shingles but anyone who's got a connection to a roofing contractor will be able to see the ARV potential. As for the interior, the home is In need of a gut renovation and the former majesty of this two-story home can be brought back to its restored glory or made into contemporary eye candy!
ⓘ Source: listings_history table (triggers on properties + properties_extension) + one-shot
backfill from property_details.listing_events for pre-trigger history.
Tax reassessment forecast MI · Partial reset (capped growth)
- Current annual tax
- $1,515 · $126/mo
- Projected year-2 tax
- $1,515 · $126/mo
- Expected delta
- $0/yr ($0/mo · 0.0%)
ⓘ Screening estimate from a state-policy table — verify with the county assessor before closing.
Climate risk First Street
- Flood 1/10 Low FEMA zone X (unshaded) · 0% chance over 30 yrs
- Wildfire 1/10 Low
- Heat 2/10 Low 7 d/yr ≥97°F today · 16 d/yr by 30 yrs out
- Wind 2/10 Low
- Air quality 2/10 Low 1 unhealthy d/yr today · 2 by 30 yrs out
Nearby sold comps map
Loading sold comps map…
Walkable amenities ~0.75 mi
Loading nearby amenities…
Taxation est. · year 1
- Rental income
- $15,888
- − Mortgage interest
- −$2,185
- − Property taxes
- −$1,515
- − Insurance
- −$195
- − Repairs & maintenance
- −$1,271
- − Management
- −$1,271
- − Depreciation
- −$1,135
- Taxable income
- $8,317
- Est. tax owed @ 24.0%
- −$1,996
- After-tax cash flow
- $6,391/yr
For passive investors: Depreciation is non-cash, so a rental often shows a tax loss while cash-flowing — sheltering income. Rental losses are passive: they offset passive income freely, and up to $25,000/yr can offset ordinary (W-2) income if you actively participate and your MAGI is under $100k (phasing out to $0 by $150k); unused losses carry forward. On sale, claimed depreciation is recaptured at up to 25%, and gains may owe capital-gains tax (a 1031 exchange can defer both). Figures are a year-1 estimate at your 24.0% rate — not tax advice; consult a CPA.
Schools (NCES district)
- District
- Lansing Public School District
- NCES district ID
- 2621150
- Math proficiency
- 14% ▲ 1.00%
- Reading proficiency
- 23% ▲ 3.00%
- Median HH income
- $37,453
- Composite
- 18.76/100
- National rank
- #14002
- State rank
- #650 of 760 in MI
Livability — Lansing
- Score
- 79/100
- State rank
- #94
- US rank
- #2182
Category grades
Schools grade is shown separately in the Schools card above.
Census & demographics
- Census place
- Lansing, MI
- County
- Ingham County · 237,052 people
- City population
- 161,269
- Metro
- Lansing-East Lansing, MI
- Population (ZIP)
- 9,428
- Household income
- $54,465
- Rent vs Own
- Severe rent burden
- 307.0
Population outlook (Ingham County) Hauer SSP2
- Today (2025)
- 300,362 people
- By 2030
- 307,808 · +2.5%
- By 2040
- 320,492 · +6.7%
- By 2050
- 333,223 · +10.9%
- By 2075
- 373,693 · +24.4%
- By 2100
- 392,021 · +30.5%
Race, ethnicity, and origin ACS 2023
- Neighborhood character
- Diverse neighborhood (Simpson 0.64)
- Race & ethnicity
- White 54% Black 24% Two or more races 13% Hispanic / Latino 13%
- Hispanic origin (detail)
- Mexican 10%
- Common ancestry
- Romanian 7% Lithuanian 2% Iranian 2%
- Foreign-born
- 5% · Canada, Philippines
- Languages at home
- 90% English-only · Spanish 7% Other Asian/Pacific 1% German/W. Germanic 1%
Political lean MEDSL · Ingham
- 2024 margin
- Strong D (+29.7) · D 63.9% · R 34.2% · Other 2.0%
- 2008→2024 swing
- -3.6pp toward R · 2008: 33.3pp · 2024: 29.7pp
- All cycles
- 2024: D+29.7 2020: D+32.2 2016: D+27.6 2012: D+27.9 2008: D+33.3
Not yet ingested
- Civics
- —
Market trends
- HPI YoY
- ▼ -129.90%
- Current HPI
- 177.0906
- Rent YoY
- —
- Metro
- Lansing-East Lansing, MI
- State GDP YoY
- ▲ 1.37%
- F500 in state
- 28
Industry mix (Fortune 500 HQ in MI)
| Industry | F500 HQs | Revenue |
|---|---|---|
| Automotive Parts | 3 | $48B |
|
||
| Automotive | 2 | $372B |
|
||
| Chemicals | 1 | $45B |
|
||
| Automotive Retail | 1 | $29B |
|
||
| Healthcare / Medical Devices | 1 | $23B |
|
||
| Automotive Technology | 1 | $20B |
|
||
Price history
+0.0% since first listed2 events — show timeline
- 2026-05-28 Listed $39,000 REALCOMP
- 2026-05-28 Listed $39,000 Greater Lansing AoR
Property tax history
+3.8%/yrLatest (2025): $1,515 · +2.9% YoY. Source: county tax records.
Cash-flow waterfall
monthlySold comps — $/sqft
last 12 mo · ≤1 miLoading sold comps…