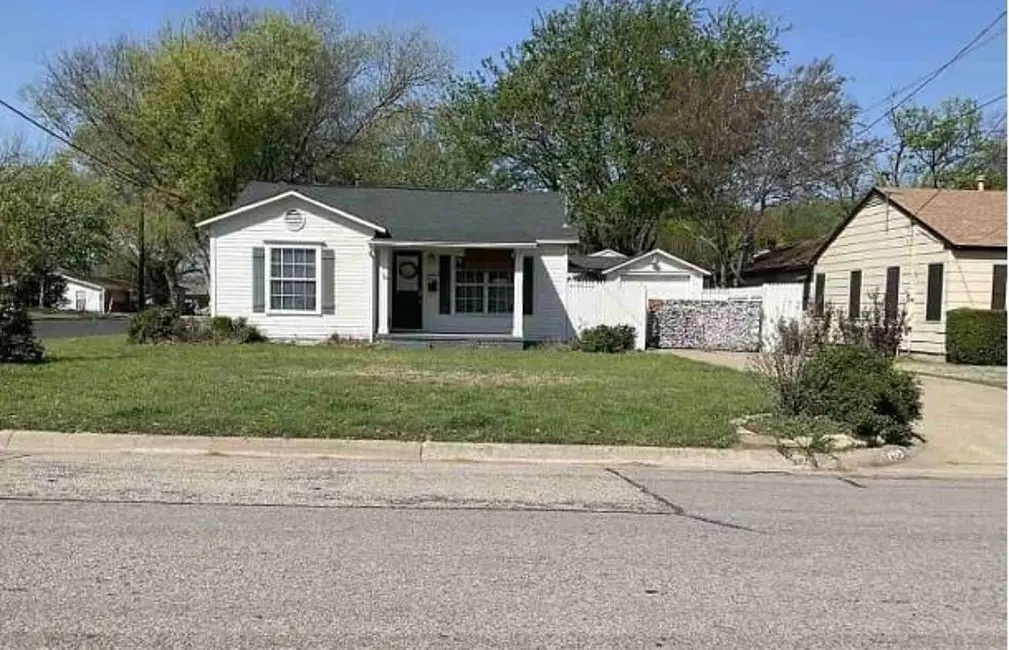
1415 N Waddill St · McKinney, TX
Flood risk 1/10 · Minimal
- FEMA flood zone
- X (unshaded)
- Chance of flooding over 30 yrs
- 0.0%
- Est. flood insurance / yr
- $507 – $1,088
Fire risk 5/10 · Moderate
- Est. fire insurance / yr
- $1,222 – $2,270
Heat risk 7/10 · Major
- Hot days now (above 110°F)
- 7 days/yr
- Hot days in 30 yrs
- 23 days/yr
Wind risk 6/10 · Moderate
- Chance of severe wind over 30 yrs
- 27.0%
Air-quality risk 3/10 · Minor
- Unhealthy air days now
- 3 days/yr
- Unhealthy air days in 30 yrs
- 3 days/yr
Risk factors via First Street. Map © Google.
Why this score? — see what drove the D grade
The composite is a weighted blend of 9 inputs, each scored 0–100. Each bar is that input's sub-score; the figure is the points it added to the 100-point composite (weight × sub-score).
- ARV discount +15.0/15.0
- Cash flow +8.9/30.0
- Schools +5.0/10.0
- Livability +3.8/5.0
- 1% rule +3.4/10.0
- DSCR +2.5/10.0
- Condition / age +2.5/5.0
- Rent growth +2.0/5.0
- Appreciation +0.0/10.0
$198,800
🖨 Deal sheet (PDF) 📄 Offer letter ✓ Due diligence
Listing remarks MLS
This is a 2 bedroom 1 bathroom home
Key facts
- 5,993 sq ft lot
- Garage
- Built 1965
Neighborhood map
What this means for you Summary
Snapshot
- This is a 2-bed/1.0-bath single-family listed at $199k.
Deal economics
- At list price, monthly cash flow is $-160 ($-2k/yr) — negative.
- To cash-flow at today's rent, offer at most $170k (14.2% below list).
- To meet the 1% rule (rent ≥ 1% of price), the offer needs to be $166k (16.4% below list).
- Recommended offer: $166k (16.4% below list) — sets the bar for 1% rule.
- Cap rate 5.3% vs local median 2.5% in McKinney — top-decile yield for the area; either an underpriced asset or a hidden risk that comps aren't pricing in. Stress-test before assuming the spread holds.
Location & tenants
- Location reads 76/100 on livability (#115 in TX, #3,716 nationally) — a middle-class / working-renter tenant base. Strengths: crime A+, employment A+, housing A+; Watch: cost of living C-, amenities F, commute F.
- Mckinney ISD (suburban): math 54% / reading 58% proficiency, ranked #72 of 826 in TX (top 9%) — acceptable for families but not a draw, mixed tenant base, ~2y average lease.
- Market conditions: Rents soft (-2.1%/yr); 298 active listings in the ZIP; 34 comparable units currently listed for rent nearby; rentals leasing fast (median 9d on market — plan ~1-2 weeks tenant-placement turnaround); solid renter incomes; 19,194 units permitted in Collin County in 2024 (3,988 in 5+ unit buildings).
Forward outlook
- Local home prices are declining (-3.0%/yr); year-one equity from $1k of loan paydown is wiped out by about $6k of value loss. Plan a longer hold.
- Collin County population projected at +60% by 2050 — long-run rental-demand tailwind backs the buy-and-hold thesis.
Negotiation context
- It's been on market 36 days — a 3% lower offer ($193k) is reasonable based on typical stale-listing flexibility.
- 7 sale attempts since 9y ago with the ask held roughly flat each time — persistent listings suggest the price (not the market) is what's stuck; bring a comps-based counter.
Risks & watch-outs
- Climate carrying-cost: major wind risk, 27% chance of damaging wind over 30y; moderate wildfire risk; extreme-heat days projected 7→23/yr by 2055 (HVAC capex compounding) — expect insurance premiums to compound above CPI over the hold.
Questions for the listing agent
- What do current leases actually rent for vs. the listed asking? Can we see a recent rent roll and the last 12 months of T-12 income?
- It's been on market 36 days. Have you received any prior offers? Is the seller open to a 16% concession, seller financing, or rate buy-down credit?
- Built in 1965 — when were the roof, HVAC, electrical panel, plumbing, and water heater last replaced?
- Is there a deadline driving the sale (1031 exchange, divorce, estate, relocation)? That informs how much negotiation room exists.
- Schools are B-rated — typically a magnet for longer-tenancy family renters. What's the average tenant stay here, and is there a school-zone premium baked into asking?
- The area grade is low — what's the realistic commute time and amenity access for the typical tenant pool here? Any planned neighborhood developments (good or bad) we should know about?
- What's the average days-on-market for RENTAL listings here right now (not sales)? A rising rental-DOM trend means longer vacancies and softer asking-rent achievability than the comps imply.
- What's the recent tenant-quality profile in this submarket — average credit score on applications, eviction rate, late-payment / NSF rate, and stable-employment percentage? A property-management company in the area should have these aggregated.
- How much new for-sale + rental construction is in the pipeline within 1–3 miles? Heavy new supply typically softens prices + rents 12–24 months out; constrained supply supports both.
Investment metrics
- 1% rule
- 0.84% ✗
- Cap rate
- 5.33%
- Cash-on-cash
- -3.45%
- DSCR
- 0.85
- GRM
- 10.0
CMA / ARV
- ARV (median comp)
- $279,470
- List price
- $198,800
- Delta
- -28.87%
- Verdict
- UNDERPRICED
- Comps
- 20 within 1.0 mi
Show comp detail 12 sales within ~0.75 mi
| Address | Dist | Beds/Ba | Sqft | Sold | Price | $/sf | Match |
|---|---|---|---|---|---|---|---|
| 1505 West St | 0.09mi | 2/2.0 | 826 (-4%) | 8mo | $295,000 | $357 | 79 |
| 1205 N Bradley St | 0.31mi | 2/1.0 | 760 (-11%) | 3mo | $245,000 | $322 | 64 |
| 1502 W Josephine St | 0.25mi | 2/1.0 | 773 (-10%) | 14mo | $295,000 | $382 | 60 |
| 1309 N College St | 0.34mi | 2/2.0 | 875 (+2%) | 21mo | $278,000 | $318 | 59 |
| 1104 New St | 0.40mi | 2/1.0 | 810 (-5%) | 17mo | $225,000 | $278 | 58 |
| 828 Woodleigh Dr | 0.46mi | 2/1.0 | 884 (+3%) | 21mo | $250,000 | $283 | 55 |
| 1005 Oak St | 0.39mi | 2/1.0 | 732 (-14%) | 3mo | $225,000 | $307 | 55 |
| 1005 West St | 0.37mi | 2/1.0 | 980 (+14%) | 8mo | $189,990 | $194 | 52 |
| 1208 N Church St | 0.55mi | 2/1.0 | 754 (-12%) | 4mo | $289,900 | $384 | 52 |
| 407 W Erwin Ave | 0.49mi | 2/1.0 | 958 (+12%) | 8mo | $230,000 | $240 | 51 |
| 513 W Leland Ave | 0.37mi | 2/1.0 | 751 (-12%) | 18mo | $299,900 | $399 | 47 |
| 1208 N Church St | 0.55mi | 2/1.0 | 754 (-12%) | 19mo | $245,000 | $325 | 39 |
Match score weights: distance 35% · size 25% · config 20% · recency 20%. Top-matched comps best support the ARV.
Projected returns pro-forma
-3.0% appreciation · 0.0% rent growth · sell at horizon
- IRR
- -25.7%
- Equity multiple
- 0.15×
- Total profit
- $-47,207
- Equity at exit
- $29,642
- IRR
- -37.4%
- Equity multiple
- -0.31×
- Total profit
- $-72,730
- Equity at exit
- $17,189
Cash invested: $55,664 (down + closing). Projections, not guarantees.
Landlord ↔ Tenant lean methodology
- Overall (STATE)
- 87 Strongly Landlord-Friendly
- State Texas
- 87 Strongly Landlord-Friendly · R+5
- County
- — inherits STATE
- City
- — inherits STATE
ZIP-level market 75069
- Rents YoY
- -2.1%
- Active inventory
- 298
- Price-to-rent
- 10.0×
Monthly cashflow live
- Estimated rent
- $1,663 high interval (Pro) →
- Mortgage (P&I)
- −$1,043
- Tax from tax record
- −$349 /mo · $4,182/yr
- Insurance
- −$83
- HOA
- −$0
- Vacancy / Maint / Mgmt
- −$349
- Net cashflow
- $-160
Break-even live
Sensitivity live
| Price | -10% $-48 | -5% $-104 | +0% $-160 | +5% $-217 | +10% $-273 |
|---|---|---|---|---|---|
| Rent | -10% $-292 | -5% $-226 | +0% $-160 | +5% $-95 | +10% $-29 |
| Rate | -1.0pp $-60 | -0.5pp $-110 | base $-160 | +0.5pp $-212 | +1.0pp $-264 |
UW: 25.0% down · 7.5% · 30yr · 1.5% tax · 5.0% vac · 8.0% maint · 8.0% mgmt
Financing live
Cash to close
- Down payment
- $49,700
- Closing costs
- $5,964
- Reserves months
- —
- Total cash needed
- —
Loan-product check · same deal, 3 products live
Conventional
25% down · 7.5% · 30yr
- Down + closing
- —
- Monthly P&I
- —
- Monthly cashflow
- —
- DSCR
- —
- Eligible?
- —
Personal DTI + credit; lowest rate.
DSCR
20% down · 8.5% · 30yr
- Down + closing
- —
- Monthly P&I
- —
- Monthly cashflow
- —
- DSCR
- —
- Eligible?
- —
No personal income docs; deal must DSCR.
Hard money
10% down · 12.0% · 12mo
- Down + closing
- —
- Monthly P&I
- —
- Monthly cashflow
- —
- DSCR
- —
- Eligible?
- —
Short-term bridge; refi at stabilization.
Rent comps 34 comps
| Address | Beds | Baths | Sqft | Rent | $/sqft | DOM | Units | Dist |
|---|---|---|---|---|---|---|---|---|
| 1311 N Morris St McKinney, TX | 2.0 | 1.0 | 850 | $1,600 | $1.88 | 45d | 1 | 0.15mi |
| 1600 Heritage Dr McKinney, TX | 1.0–2.0 | 1.0–2.0 | 704 | $1,592 | $2.26 | 5d | 20 | 0.26mi |
| 1570 Heritage Dr McKinney, TX | 1.0–2.0 | 1.0–2.0 | 915 | $2,225 | $2.43 | 0d | 28 | 0.33mi |
| 1904 W White Ave McKinney, TX | 1.0–2.0 | 1.0–2.0 | 787 | $2,000 | $2.54 | 1d | 6 | 0.35mi |
| 822 Woodleigh Dr McKinney, TX | 3.0 | 1.0 | 878 | $1,850 | $2.11 | 45d | 1 | 0.45mi |
| 1607 Coleman St McKinney, TX | 3.0 | 2.0 | 1100 | $1,915 | $1.74 | 4d | 1 | 0.46mi |
| 1607 Coleman St McKinney, TX | 3.0 | 2.0 | 1100 | $1,981 | $1.80 | 9d | 1 | 0.46mi |
| 602 N Morris St Unit B McKinney, TX | 2.0 | 1.0 | 900 | $1,900 | $2.11 | 26d | 1 | 0.60mi |
| 1006 W Lamar St McKinney, TX | 1.0 | 1.0 | 750 | $1,100 | $1.47 | 26d | 1 | 0.71mi |
| 304 Oak St McKinney, TX | 2.0 | 1.0 | 775 | $1,495 | $1.93 | 45d | 1 | 0.79mi |
| 307 N Bradley St Unit A McKinney, TX | 2.0 | 1.0 | 794 | $1,795 | $2.26 | 19d | 1 | 0.80mi |
| 500 W Lamar St McKinney, TX | 1.0–2.0 | 1.0 | 721 | $1,500 | $2.08 | 45d | 2 | 0.80mi |
| 206 N Graves St McKinney, TX | 2.0 | 1.0 | 896 | $1,595 | $1.78 | 26d | 1 | 0.89mi |
| 2301 W White Ave McKinney, TX | 1.0–3.0 | 1.0–2.0 | 836 | $1,398 | $1.67 | 1d | 12 | 0.93mi |
| 601 Drexel St McKinney, TX | 1.0–2.0 | 1.0 | 694 | $1,100 | $1.59 | 46d | 7 | 1.08mi |
| 123 Wilson Creek Blvd McKinney, TX | 1.0–2.0 | 1.0–2.0 | 821 | $1,482 | $1.81 | 4d | 10 | 1.08mi |
| 603 Drexel St McKinney, TX | 1.0–2.0 | 1.0 | 668 | $1,200 | $1.80 | 46d | 7 | 1.09mi |
| 1212 Community Ave McKinney, TX | 1.0–3.0 | 1.0–2.0 | 949 | $3,654 | $3.85 | 0d | 1 | 1.10mi |
| 1003 Throckmorton St McKinney, TX | 1.0 | 1.0 | 790 | $1,040 | $1.32 | 19d | 1 | 1.14mi |
| 260 W Davis St McKinney, TX | 2.0 | 1.0–2.0 | 827 | $2,830 | $3.42 | 0d | 23 | 1.16mi |
| 300 N McDonald St McKinney, TX | 2.0 | 1.0–2.0 | 921 | $2,365 | $2.57 | 0d | 24 | 1.19mi |
| 709 Pride Ct McKinney, TX | 3.0 | 2.0 | 1100 | $1,750 | $1.59 | 1d | 1 | 1.25mi |
| 804 Center St McKinney, TX | 2.0 | 1.0 | 1000 | $1,726 | $1.73 | 26d | 1 | 1.25mi |
| 2111 Quail Run Unit A McKinney, TX | 2.0 | 1.5 | 1121 | $1,400 | $1.25 | 1d | 1 | 1.31mi |
| 1703 Rockhill Rd McKinney, TX | 1.0–3.0 | 1.0–2.0 | 1068 | $1,742 | $1.63 | 1d | 25 | 1.32mi |
| 2401 McKinney Ranch Pkwy McKinney, TX | 1.0–3.0 | 1.0–2.0 | 1136 | $1,664 | $1.47 | 0d | 24 | 1.35mi |
| 2521 Wolford St McKinney, TX | 1.0–2.0 | 1.0–2.0 | 813 | $1,517 | $1.87 | 4d | 5 | 1.39mi |
| 901 Wilson Creek Pkwy Unit 922 McKinney, TX | 1.0 | 1.0 | 747 | $1,125 | $1.51 | 1d | 1 | 1.39mi |
| 901 Wilson Creek Pkwy Unit 2121 McKinney, TX | 2.0 | 2.0 | 1026 | $1,343 | $1.31 | 1d | 1 | 1.39mi |
| 901 Wilson Creek Pkwy Unit 922 McKinney, TX | 1.0 | 1.0 | 747 | $1,171 | $1.57 | 14d | 1 | 1.39mi |
| 901 Wilson Creek Pkwy Unit 952 McKinney, TX | 1.0 | 1.0 | 747 | $1,166 | $1.56 | 45d | 1 | 1.39mi |
| 901 Wilson Creek Pkwy Unit 958 McKinney, TX | 2.0 | 2.0 | 1026 | $1,384 | $1.35 | 45d | 1 | 1.39mi |
| 211 E Standifer St Unit B McKinney, TX | 1.0 | 1.0 | 600 | $1,395 | $2.33 | 22d | 1 | 1.40mi |
| 600 S Graves St McKinney, TX | 1.0–2.0 | 1.0–2.0 | 900 | $1,668 | $1.85 | 0d | 15 | 1.47mi |
Listing history 23 events
-
2026-04-16$198,800 Active 35-char remark
Show marketing remark (35 chars)
This is a 2 bedroom 1 bathroom home
-
2025-04-12historical
-
2025-03-12$329,900 Active
-
2024-05-31historical
-
2024-05-03$329,900
-
2022-03-02status Pending
-
2021-11-17soldstatus Closed
-
2021-11-01soldstatus
-
2021-09-28status Pending
-
2021-09-17price $275,000
-
2021-08-30price $279,000
-
2021-08-18status Active
-
2021-08-16historical
-
2021-07-02$289,000 Active
-
2017-07-28soldstatus
-
2017-07-27soldstatus Sold
-
2017-06-30historical Active Option Contract
-
2017-06-27status Active
-
2017-06-20historical Active Option Contract
-
2017-06-16$179,900 Active
-
2008-04-28soldstatus
-
2007-12-26soldstatus
-
2006-06-26soldstatus
ⓘ Source: listings_history table (triggers on properties + properties_extension) + one-shot
backfill from property_details.listing_events for pre-trigger history.
Tax reassessment forecast TX · Resets to sale price
- Current annual tax
- $4,182 · $349/mo
- Projected year-2 tax
- $4,182 · $349/mo
- Expected delta
- $0/yr ($0/mo · 0.0%)
ⓘ Screening estimate from a state-policy table — verify with the county assessor before closing.
Climate risk First Street
- Flood 1/10 Low FEMA zone X (unshaded) · 0% chance over 30 yrs
- Wildfire 5/10 Major
- Heat 7/10 Severe 7 d/yr ≥110°F today · 23 d/yr by 30 yrs out
- Wind 6/10 Major 27% chance of damaging wind over 30 yrs
- Air quality 3/10 Moderate 3 unhealthy d/yr today · 3 by 30 yrs out
Nearby sold comps map
Loading sold comps map…
Walkable amenities ~0.75 mi
Loading nearby amenities…
Taxation est. · year 1
- Rental income
- $19,954
- − Mortgage interest
- −$11,136
- − Property taxes
- −$4,182
- − Insurance
- −$994
- − Repairs & maintenance
- −$1,596
- − Management
- −$1,596
- − Depreciation
- −$5,783
- Taxable loss
- −$5,334
- Est. tax savings @ 24.0%
- +$1,280
- After-tax cash flow
- $-643/yr
For passive investors: Depreciation is non-cash, so a rental often shows a tax loss while cash-flowing — sheltering income. Rental losses are passive: they offset passive income freely, and up to $25,000/yr can offset ordinary (W-2) income if you actively participate and your MAGI is under $100k (phasing out to $0 by $150k); unused losses carry forward. On sale, claimed depreciation is recaptured at up to 25%, and gains may owe capital-gains tax (a 1031 exchange can defer both). Figures are a year-1 estimate at your 24.0% rate — not tax advice; consult a CPA.
Schools (NCES district)
- District
- Mckinney ISD
- NCES district ID
- 4829850
- Math proficiency
- 54% ▼ -9.00%
- Reading proficiency
- 58% ▼ -2.00%
- Median HH income
- $78,283
- Composite
- 50.46/100
- National rank
- #1862
- State rank
- #72 of 826 in TX
Livability — McKinney
- Score
- 76/100
- State rank
- #115
- US rank
- #3716
Category grades
Schools grade is shown separately in the Schools card above.
Census & demographics
- Census place
- McKinney, TX
- County
- Collin County · 1,159,394 people
- City population
- 232,161
- Metro
- Dallas-Fort Worth-Arlington, TX
- Population (ZIP)
- 40,032
- Household income
- $85,327
- Rent vs Own
- Severe rent burden
- 1898.0
Population outlook (Collin County) Hauer SSP2
- Today (2025)
- 1,210,074 people
- By 2030
- 1,358,201 · +12.2%
- By 2040
- 1,654,061 · +36.7%
- By 2050
- 1,937,359 · +60.1%
- By 2075
- 2,567,039 · +112.1%
- By 2100
- 2,952,048 · +144.0%
Race, ethnicity, and origin ACS 2023
- Neighborhood character
- Diverse neighborhood (Simpson 0.60)
- Race & ethnicity
- White 55% Hispanic / Latino 29% Two or more races 11% Black 10% Asian 3%
- Hispanic origin (detail)
- Mexican 25%
- Common ancestry
- Slovak 2% Lithuanian 2% Serbian 2%
- Foreign-born
- 16% · Canada, China
- Languages at home
- 72% English-only · Spanish 24% Other Indo-European 1% Chinese 1%
Political lean MEDSL · Collin
- 2024 margin
- R (+11.1) · D 43.1% · R 54.3% · Other 2.6%
- 2008→2024 swing
- +14.4pp toward D · 2008: -25.6pp · 2024: -11.1pp
- All cycles
- 2024: R+11.1 2020: R+4.3 2016: R+17.0 2012: R+31.6 2008: R+25.6
Not yet ingested
- Civics
- —
Market trends
- HPI YoY
- ▼ -158.98%
- Current HPI
- 280.2534
- Rent YoY
- ▼ -2.14%
- Metro
- Dallas-Fort Worth-Arlington, TX
- State GDP YoY
- ▲ 3.95%
- F500 in state
- 110
Industry mix (Fortune 500 HQ in TX)
| Industry | F500 HQs | Revenue |
|---|---|---|
| Energy | 16 | $1,198B |
|
||
| Technology | 5 | $198B |
|
||
| Engineering / Construction | 4 | $72B |
|
||
| Energy Services | 3 | $60B |
|
||
| Utilities | 3 | $41B |
|
||
| Healthcare | 2 | $330B |
|
||
Price history
+10.5% since first listed23 events — show timeline
- 2026-04-16 Listed $198,800 HARMLS
- 2025-04-12 Listing Removed — NTREIS
- 2025-03-12 Listed $329,900 NTREIS
- 2024-05-31 Listing Removed — NTREIS
- 2024-05-03 Listed $329,900 NTREIS
- 2022-03-02 Pending — NTREIS
- 2021-11-17 Sold (MLS) — NTREIS
- 2021-11-01 Sold (Public Records) — Public Records
- 2021-09-28 Pending — NTREIS
- 2021-09-17 Price Changed $275,000 NTREIS
- 2021-08-30 Price Changed $279,000 NTREIS
- 2021-08-18 Relisted — NTREIS
- 2021-08-16 Listing Removed — NTREIS
- 2021-07-02 Listed $289,000 NTREIS
- 2017-07-28 Sold (Public Records) — Public Records
- 2017-07-27 Sold (MLS) — NTREIS
- 2017-06-30 Contingent — NTREIS
- 2017-06-27 Relisted — NTREIS
- 2017-06-20 Contingent — NTREIS
- 2017-06-16 Listed $179,900 NTREIS
- 2008-04-28 Sold (Public Records) — Public Records
- 2007-12-26 Sold (Public Records) — Public Records
- 2006-06-26 Sold (Public Records) — Public Records
Property tax history
+7.7%/yrLatest (2025): $4,182 · -16.2% YoY. Source: county tax records.
Cash-flow waterfall
monthlySold comps — $/sqft
last 12 mo · ≤1 miLoading sold comps…