37619 Cedar St · Ocean View, DE
Flood risk 1/10 · Minimal
- FEMA flood zone
- X (unshaded)
- Chance of flooding over 30 yrs
- 0.0%
- Est. flood insurance / yr
- $473 – $860
Fire risk 1/10 · Minimal
- Est. fire insurance / yr
- $476 – $884
Heat risk 8/10 · Major
- Hot days now (above 100°F)
- 7 days/yr
- Hot days in 30 yrs
- 18 days/yr
Wind risk 8/10 · Major
- Chance of severe wind over 30 yrs
- 80.0%
Air-quality risk 2/10 · Minimal
- Unhealthy air days now
- 0 days/yr
- Unhealthy air days in 30 yrs
- 1 days/yr
Risk factors via First Street. Map © Google.
Why this score? — see what drove the B- grade
The composite is a weighted blend of 9 inputs, each scored 0–100. Each bar is that input's sub-score; the figure is the points it added to the 100-point composite (weight × sub-score).
- Cash flow +26.1/30.0
- ARV discount +15.0/15.0
- DSCR +8.8/10.0
- 1% rule +5.8/10.0
- Livability +3.5/5.0
- Schools +2.9/10.0
- Rent growth +2.5/5.0
- Condition / age +2.5/5.0
- Appreciation +0.0/10.0
$219,900
🖨 Deal sheet 📄 Offer letter ✓ Due diligence
Listing remarks MLS
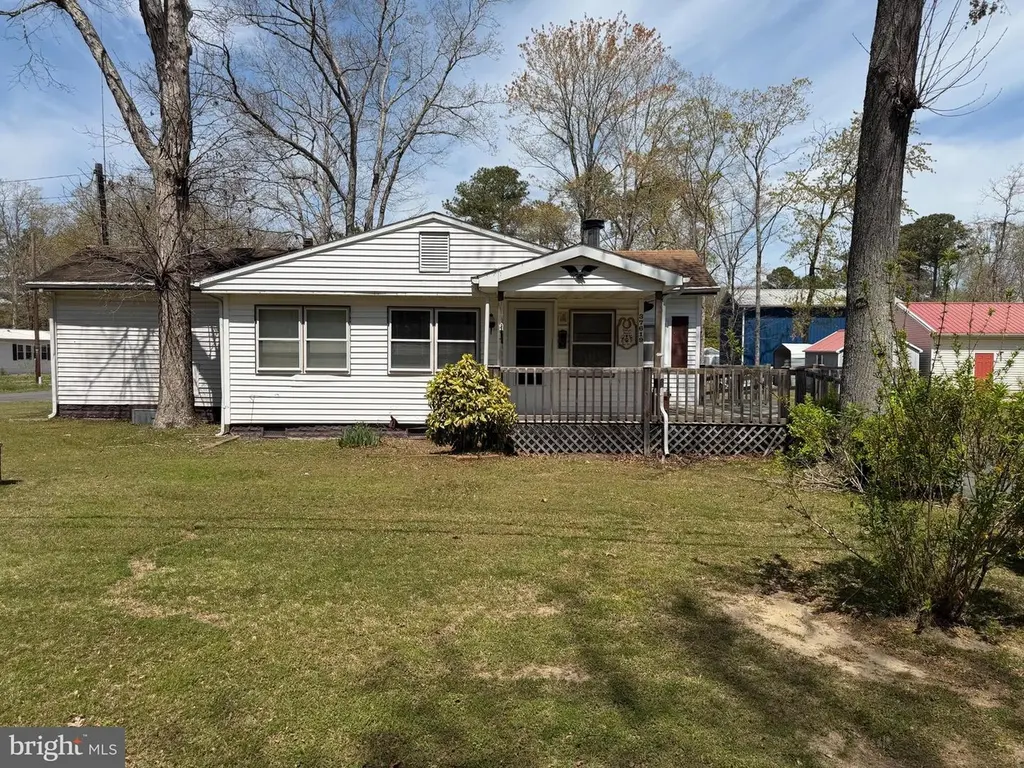
Located in Shadydell Park less than 3 miles to the ocean beaches at Bethany Beach. Original structure was built in 1970 with front and rear additions added giving this class "C" property has approximately 1300 Sq Ft of living space including 3 bedrooms and 1 full bath as well as an outside shower with bathroom facilities. Enclosed front porch is centrally heated with an additional propane fueled free-standing heating unit. Situated on 80 x 103-foot corner lot this property features a paved driveway, two-car detached and heated garage and separate storage shed providing all the storage you will need for your tools and toys. Plenty of parking space for your cars, boats, campers or trailers. Conveniently located with easy access to shopping, golf, swimming, and all the amenities offered by the Delaware Shore. Property is move-in ready being sold partially furnished AS IS.
Key facts
- 7,841 sq ft lot
- 2 garage spots
- Built 1970
Neighborhood map
What this means for you Summary
Snapshot
- This is a 3-bed/1.0-bath single-family listed at $220k.
Deal economics
- At list price, monthly cash flow is $554 ($7k/yr) — positive.
- The deal already cash-flows at list — no discount required.
- Meets the 1% rule at list price ($2k rent vs $220k).
- Recommended offer: $217k (1.5% below list) — sets the bar for market timing.
- Cap rate 9.3% vs local median 1.9% in Ocean View — top-decile yield for the area; either an underpriced asset or a hidden risk that comps aren't pricing in. Stress-test before assuming the spread holds.
Location & tenants
- Location reads 69/100 on livability (#27 in DE) — a middle-class / working-renter tenant base. Strengths: crime A+, employment A+, schools A; Watch: amenities F, commute F, cost of living F.
- Indian River School District (rural): math 25% / reading 41% proficiency, ranked #14 of 26 in DE (top 54%) — families likely to look elsewhere, expect single-tenant / working-renter base with shorter leases.
- Market conditions: 231 active listings in the ZIP; 5 comparable units currently listed for rent nearby; rentals lingering (median 44d on market — plan ~5-8 weeks vacancy on turnover, expect pricing pressure); 80% of comp listings sitting > 30 days — soft ceiling on asking rent; 4,354 units permitted in Sussex County in 2024 (344 in 5+ unit buildings).
Forward outlook
- Local home prices are declining (-3.0%/yr); year-one equity from $2k of loan paydown is wiped out by about $7k of value loss. Plan a longer hold.
- Sussex County population projected at +25% by 2050 — long-run rental-demand tailwind backs the buy-and-hold thesis.
Negotiation context
- It's been on market 24 days — a 2% lower offer ($217k) is reasonable based on typical stale-listing flexibility.
Risks & watch-outs
- Climate carrying-cost: severe wind risk, 80% chance of damaging wind over 30y; extreme-heat days projected 7→18/yr by 2055 (HVAC capex compounding) — expect insurance premiums to compound above CPI over the hold.
Questions for the listing agent
- Built in 1970 — when were the roof, HVAC, electrical panel, plumbing, and water heater last replaced?
- What does the HOA fee cover, when was the last increase, and are there any pending special assessments or reserve-fund shortfalls?
- Is there a deadline driving the sale (1031 exchange, divorce, estate, relocation)? That informs how much negotiation room exists.
- Schools are A-rated — typically a magnet for longer-tenancy family renters. What's the average tenant stay here, and is there a school-zone premium baked into asking?
- What's the average days-on-market for RENTAL listings here right now (not sales)? A rising rental-DOM trend means longer vacancies and softer asking-rent achievability than the comps imply.
- What's the recent tenant-quality profile in this submarket — average credit score on applications, eviction rate, late-payment / NSF rate, and stable-employment percentage? A property-management company in the area should have these aggregated.
- How much new for-sale + rental construction is in the pipeline within 1–3 miles? Heavy new supply typically softens prices + rents 12–24 months out; constrained supply supports both.
Investment metrics
- 1% rule
- 1.08% ✓
- Cap rate
- 9.32%
- Cash-on-cash
- 10.80%
- DSCR
- 1.48
- GRM
- 7.7
CMA / ARV
- ARV (median comp)
- $303,139
- List price
- $219,900
- Delta
- -27.46%
- Verdict
- UNDERPRICED
- Comps
- 20 within 1.0 mi
Show comp detail 12 sales within ~0.75 mi
| Address | Dist | Beds/Ba | Sqft | Sold | Price | $/sf | Match |
|---|---|---|---|---|---|---|---|
| 37619 Cedar St | 0.00mi | 3/1.0 | 1,300 (-4%) | 0mo | $210,000 | $162 | 93 |
| 18 Calgary Ave | 0.49mi | 3/2.0 | 1,344 (-1%) | 0mo | $389,000 | $289 | 72 |
| 33525 Weshampton Ln | 0.35mi | 3/2.0 | 1,464 (+8%) | 1mo | $415,000 | $283 | 66 |
| 10 Mitchell Ave | 0.73mi | 3/2.0 | 1,307 (-3%) | 0mo | $425,000 | $325 | 56 |
| 38585 Hemlock Dr | 0.66mi | 3/2.0 | 1,364 (+1%) | 13mo | $450,000 | $330 | 53 |
| 33186 Ogre Dr | 0.48mi | 3/2.0 | 1,532 (+13%) | 1mo | $595,000 | $388 | 51 |
| 37556 Mahogany St | 0.16mi | 4/2.0 (+1) | 1,216 (-10%) | 19mo | $200,000 | $164 | 51 |
| 5 Kent Ave | 0.67mi | 3/2.0 | 1,386 (+2%) | 19mo | $395,000 | $285 | 45 |
| 38626 Hemlock Dr | 0.62mi | 3/2.0 | 1,176 (-13%) | 3mo | $395,000 | $336 | 43 |
| 38208 Clover Ln | 0.66mi | 3/2.0 | 1,260 (-7%) | 15mo | $385,000 | $306 | 41 |
| 11 Cromwell Dr | 0.50mi | 3/2.0 | 1,553 (+15%) | 19mo | $542,000 | $349 | 32 |
| 33802 Bethany Dr | 0.67mi | 3/2.0 | 1,510 (+12%) | 18mo | $415,000 | $275 | 30 |
Match score weights: distance 35% · size 25% · config 20% · recency 20%. Top-matched comps best support the ARV.
Projected returns pro-forma
-3.0% appreciation · 3.0% rent growth · sell at horizon
- IRR
- -0.2%
- Equity multiple
- 0.99×
- Total profit
- $-436
- Equity at exit
- $32,788
- IRR
- 9.4%
- Equity multiple
- 1.73×
- Total profit
- $44,697
- Equity at exit
- $19,013
Cash invested: $61,572 (down + closing). Projections, not guarantees.
Landlord ↔ Tenant lean methodology
- Overall (STATE)
- 70 Landlord-Friendly
- State Delaware
- 70 Landlord-Friendly · D+7
- County
- — inherits STATE
- City
- — inherits STATE
ZIP-level market 19970
- Home prices YoY
- -18.6%
- Active inventory
- 231
- Price-to-rent
- 7.7×
Monthly cashflow live
- Estimated rent
- $2,369 high interval (Pro) →
- Mortgage (P&I)
- −$1,153
- Tax from tax record
- −$67 /mo · $799/yr
- Insurance
- −$92
- HOA
- −$6
- Vacancy / Maint / Mgmt
- −$497
- Net cashflow
- $554
Break-even live
UW: 25.0% down · 7.5% · 30yr · 1.5% tax · 5.0% vac · 8.0% maint · 8.0% mgmt
Financing live
Cash to close
- Down payment
- $54,975
- Closing costs
- $6,597
- Reserves months
- —
- Total cash needed
- —
Loan-product check · same deal, 3 products live
Conventional
25% down · 7.5% · 30yr
- Down + closing
- —
- Monthly P&I
- —
- Monthly cashflow
- —
- DSCR
- —
- Eligible?
- —
Personal DTI + credit; lowest rate.
DSCR
20% down · 8.5% · 30yr
- Down + closing
- —
- Monthly P&I
- —
- Monthly cashflow
- —
- DSCR
- —
- Eligible?
- —
No personal income docs; deal must DSCR.
Hard money
10% down · 12.0% · 12mo
- Down + closing
- —
- Monthly P&I
- —
- Monthly cashflow
- —
- DSCR
- —
- Eligible?
- —
Short-term bridge; refi at stabilization.
Rent comps 5 comps
| Address | Beds | Baths | Sqft | Rent | $/sqft | DOM | Units | Dist |
|---|---|---|---|---|---|---|---|---|
| 37580 Mahogany St Ocean View, DE | 4.0 | 3.5 | 1600 | $2,300 | $1.44 | 43d | 1 | 0.10mi |
| 33697 Ashland Dr Frankford, DE | 3.0 | 2.0 | 1696 | $2,200 | $1.30 | 43d | 1 | 0.45mi |
| 34278 Gooseberry Ave Ocean View, DE | 3.0 | 2.0 | 1850 | $2,900 | $1.57 | 43d | 1 | 0.61mi |
| 40 Old Orchard Ave #2 Ocean View, DE | 3.0 | 2.0 | 1424 | $2,500 | $1.76 | 43d | 1 | 0.77mi |
| 21 Village Green Dr Ocean View, DE | 3.0 | 2.5 | 2076 | $2,445 | $1.18 | 13d | 3 | 0.91mi |
HOA detail
- Monthly dues
- $6 · $72/yr
Listing history 3 events
-
2026-05-14status Pending 891-char remark
Show marketing remark (891 chars)
Located in Shadydell Park less than 3 miles to the ocean beaches at Bethany Beach. Original structure was built in 1970 with front and rear additions added giving this class "C" property has approximately 1300 Sq Ft of living space including 3 bedrooms and 1 full bath as well as an outside shower with bathroom facilities. Enclosed front porch is centrally heated with an additional propane fueled free-standing heating unit. Situated on 80 x 103-foot corner lot this property features a paved driveway, two-car detached and heated garage and separate storage shed providing all the storage you will need for your tools and toys. Plenty of parking space for your cars, boats, campers or trailers. Conveniently located with easy access to shopping, golf, swimming, and all the amenities offered by the Delaware Shore. Property is move-in ready being sold partially furnished AS IS.
-
2026-04-20$219,900 Active 891-char remark
Show marketing remark (891 chars)
Located in Shadydell Park less than 3 miles to the ocean beaches at Bethany Beach. Original structure was built in 1970 with front and rear additions added giving this class "C" property has approximately 1300 Sq Ft of living space including 3 bedrooms and 1 full bath as well as an outside shower with bathroom facilities. Enclosed front porch is centrally heated with an additional propane fueled free-standing heating unit. Situated on 80 x 103-foot corner lot this property features a paved driveway, two-car detached and heated garage and separate storage shed providing all the storage you will need for your tools and toys. Plenty of parking space for your cars, boats, campers or trailers. Conveniently located with easy access to shopping, golf, swimming, and all the amenities offered by the Delaware Shore. Property is move-in ready being sold partially furnished AS IS.
-
2026-04-15historical $219,900 891-char remark
Show marketing remark (891 chars)
Located in Shadydell Park less than 3 miles to the ocean beaches at Bethany Beach. Original structure was built in 1970 with front and rear additions added giving this class "C" property has approximately 1300 Sq Ft of living space including 3 bedrooms and 1 full bath as well as an outside shower with bathroom facilities. Enclosed front porch is centrally heated with an additional propane fueled free-standing heating unit. Situated on 80 x 103-foot corner lot this property features a paved driveway, two-car detached and heated garage and separate storage shed providing all the storage you will need for your tools and toys. Plenty of parking space for your cars, boats, campers or trailers. Conveniently located with easy access to shopping, golf, swimming, and all the amenities offered by the Delaware Shore. Property is move-in ready being sold partially furnished AS IS.
ⓘ Source: listings_history table (triggers on properties + properties_extension) + one-shot
backfill from property_details.listing_events for pre-trigger history.
Tax reassessment forecast DE · Partial reset (capped growth)
- Current annual tax
- $799 · $67/mo
- Projected year-2 tax
- $1,037 · $86/mo
- Expected delta
- +$238/yr (+$20/mo · 29.8%)
ⓘ Screening estimate from a state-policy table — verify with the county assessor before closing.
Climate risk First Street
- Flood 1/10 Low FEMA zone X (unshaded) · 0% chance over 30 yrs
- Wildfire 1/10 Low
- Heat 8/10 Severe 7 d/yr ≥100°F today · 18 d/yr by 30 yrs out
- Wind 8/10 Severe 80% chance of damaging wind over 30 yrs
- Air quality 2/10 Low 0 unhealthy d/yr today · 1 by 30 yrs out
Nearby sold comps map
Loading sold comps map…
Walkable amenities ~0.75 mi
Loading nearby amenities…
Taxation est. · year 1
- Rental income
- $28,427
- − Mortgage interest
- −$12,318
- − Property taxes
- −$799
- − Insurance
- −$1,100
- − Repairs & maintenance
- −$2,274
- − Management
- −$2,274
- − HOA
- −$72
- − Depreciation
- −$6,397
- Taxable income
- $3,193
- Est. tax owed @ 24.0%
- −$766
- After-tax cash flow
- $5,882/yr
For passive investors: Depreciation is non-cash, so a rental often shows a tax loss while cash-flowing — sheltering income. Rental losses are passive: they offset passive income freely, and up to $25,000/yr can offset ordinary (W-2) income if you actively participate and your MAGI is under $100k (phasing out to $0 by $150k); unused losses carry forward. On sale, claimed depreciation is recaptured at up to 25%, and gains may owe capital-gains tax (a 1031 exchange can defer both). Figures are a year-1 estimate at your 24.0% rate — not tax advice; consult a CPA.
Schools (NCES district)
- District
- Indian River School District
- NCES district ID
- 1000680
- Math proficiency
- 25% ▼ -27.00%
- Reading proficiency
- 41% ▼ -17.00%
- Median HH income
- $53,838
- Composite
- 28.99/100
- National rank
- #6620
- State rank
- #14 of 26 in DE
Livability — Ocean View
- Score
- 69/100
- State rank
- #27
- US rank
- #8560
Category grades
Schools grade is shown separately in the Schools card above.
Census & demographics
- Population (ZIP)
- 8,265
Population outlook (Sussex County) Hauer SSP2
- Today (2025)
- 248,853 people
- By 2030
- 264,464 · +6.3%
- By 2040
- 290,980 · +16.9%
- By 2050
- 311,259 · +25.1%
- By 2075
- 352,488 · +41.6%
- By 2100
- 367,406 · +47.6%
Race, ethnicity, and origin ACS 2023
- Neighborhood character
- Predominantly White (93%)
- Race & ethnicity
- White 93% Two or more races 3% Hispanic / Latino 3% Asian 1% Black 1%
- Common ancestry
- Romanian 6% Serbian 3% Lithuanian 2%
- Foreign-born
- 5% · Canada, China
- Languages at home
- 94% English-only · Spanish 3% Russian/Polish/Slavic 1% Other Indo-European 1%
Political lean MEDSL · Sussex
- 2024 margin
- R (+11.0) · D 43.9% · R 54.9% · Other 1.2%
- 2008→2024 swing
- -2.4pp toward R · 2008: -8.6pp · 2024: -11.0pp
- All cycles
- 2024: R+11.0 2020: R+11.2 2016: R+22.0 2012: R+13.0 2008: R+8.6
Not yet ingested
- Civics
- —
Market trends
- HPI YoY
- ▼ -65.41%
- Current HPI
- 286.3503
- Rent YoY
- —
- Metro
- —
- State GDP YoY
- —
- F500 in state
- 0
Price history
+0.0% since first listed3 events — show timeline
- 2026-05-14 Pending — BRIGHT MLS
- 2026-04-20 Listed $219,900 BRIGHT MLS
- 2026-04-15 Coming Soon $219,900 BRIGHT MLS
Property tax history
+0.9%/yrLatest (2025): $799 · -0.8% YoY. Source: county tax records.
Cash-flow waterfall
monthlySold comps — $/sqft
last 12 mo · ≤1 miLoading sold comps…