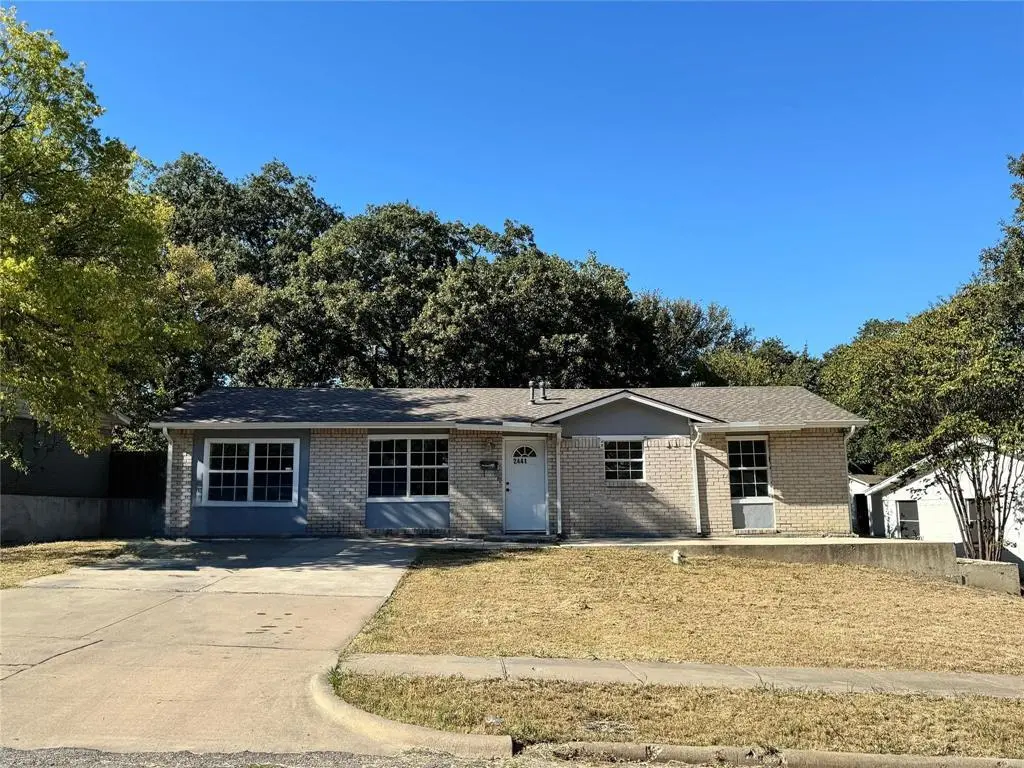
2441 Lindale Ln · Mesquite, TX
Flood risk 1/10 · Minimal
- FEMA flood zone
- X (unshaded)
- Chance of flooding over 30 yrs
- 0.0%
- Est. flood insurance / yr
- $507 – $1,088
Fire risk 1/10 · Minimal
- Est. fire insurance / yr
- $1,222 – $2,270
Heat risk 7/10 · Major
- Hot days now (above 111°F)
- 7 days/yr
- Hot days in 30 yrs
- 24 days/yr
Wind risk 6/10 · Moderate
- Chance of severe wind over 30 yrs
- 27.0%
Air-quality risk 2/10 · Minimal
- Unhealthy air days now
- 1 days/yr
- Unhealthy air days in 30 yrs
- 1 days/yr
Risk factors via First Street. Map © Google.
Why this score? — see what drove the C grade
The composite is a weighted blend of 9 inputs, each scored 0–100. Each bar is that input's sub-score; the figure is the points it added to the 100-point composite (weight × sub-score).
- Cash flow +18.9/30.0
- ARV discount +15.0/15.0
- 1% rule +6.5/10.0
- DSCR +5.9/10.0
- Livability +3.5/5.0
- Schools +2.9/10.0
- Rent growth +2.6/5.0
- Condition / age +2.5/5.0
- Appreciation +0.0/10.0
$169,999
🖨 Deal sheet (PDF) 📄 Offer letter ✓ Due diligence
Listing remarks MLS
Welcome to this 4-bedroom home offering great potential for buyers looking for an opportunity to add value. The property features a remodeled kitchen with updated cabinets, countertops, and appliances, along with recent improvements including a new roof, new HVAC system, and a new privacy fence. The home offers a functional layout with ample living space, making it ideal for those looking to renovate or customize a property to their needs.
Key facts
- New privacy fence
- Updated cabinets
- Remodeled kitchen
Tags
Neighborhood map
What this means for you Summary
Snapshot
- This is a 4-bed/1.0-bath single-family listed at $170k.
Deal economics
- At list price, monthly cash flow is $173 ($2k/yr) — positive.
- The deal already cash-flows at list — no discount required.
- Meets the 1% rule at list price ($2k rent vs $170k).
- Recommended offer: $155k (9.0% below list) — sets the bar for market timing.
- Cap rate 7.5% vs local median 4.4% in Mesquite — top-decile yield for the area; either an underpriced asset or a hidden risk that comps aren't pricing in. Stress-test before assuming the spread holds.
Location & tenants
- Location reads 70/100 on livability (#358 in TX) — a middle-class / working-renter tenant base. Strengths: cost of living A+, housing A+, health & safety A-; Watch: crime F, commute F.
- Mesquite ISD (suburban): math 35% / reading 32% proficiency, ranked #536 of 826 in TX (top 65%) — families likely to look elsewhere, expect single-tenant / working-renter base with shorter leases; 63% free/reduced lunch — lower-income household profile, screen leases tightly.
- Zoned schools: Mcwhorter El (math 40% / reading 36%, grade F, #1,709 of 4,322 statewide, top 40%, 516 students, 93% FRL); Wilkinson Middle (math 32% / reading 28%, grade F, #1,056 of 1,662 statewide, top 65%, 702 students, 90% FRL); West Mesquite H S (math 41% / reading 31%, grade F, #930 of 1,632 statewide, top 57%, 2,172 students, 86% FRL) — zoned schools average 90% FRL vs 63% district-wide (27 pts higher); higher-poverty schools than district average — tighter screening recommended.
- Market conditions: Rents flat; 345 active listings in the ZIP; 13 comparable units currently listed for rent nearby; rentals at typical pace (median 26d on market — plan ~3-4 weeks tenant-placement turnaround); 12,577 units permitted in Dallas County in 2024 (6,829 in 5+ unit buildings).
- This rent runs 33% of the median local income ($71k/yr) — at the standard rent-burdened threshold; future hikes will face affordability resistance.
Forward outlook
- Local home prices are declining (-3.0%/yr); year-one equity from $1k of loan paydown is wiped out by about $5k of value loss. Plan a longer hold.
- Dallas County population projected at +35% by 2050 — long-run rental-demand tailwind backs the buy-and-hold thesis.
Negotiation context
- It's been on market 107 days — a 9% lower offer ($155k) is reasonable based on typical stale-listing flexibility.
- 7 sale attempts since 23y ago with the ask held roughly flat each time — persistent listings suggest the price (not the market) is what's stuck; bring a comps-based counter.
Risks & watch-outs
- Watch-outs: property tax is 2.9% of price.
- Climate carrying-cost: major wind risk, 27% chance of damaging wind over 30y; extreme-heat days projected 7→24/yr by 2055 (HVAC capex compounding) — expect insurance premiums to compound above CPI over the hold.
Questions for the listing agent
- It's been on market 107 days. Have you received any prior offers? Is the seller open to a 9% concession, seller financing, or rate buy-down credit?
- Built in 1970 — when were the roof, HVAC, electrical panel, plumbing, and water heater last replaced?
- Property tax is high relative to price — has the assessment been appealed recently, and will the sale trigger a re-assessment?
- Why hasn't it sold? Are there any deal-killer items the seller is aware of (foundation, flood, title, zoning, code violations)?
- Is there a deadline driving the sale (1031 exchange, divorce, estate, relocation)? That informs how much negotiation room exists.
- Crime grade is F in this area — have there been break-ins, vandalism, or insurance claims at this property in the last 3 years? What carrier currently insures it and at what premium?
- What's the average days-on-market for RENTAL listings here right now (not sales)? A rising rental-DOM trend means longer vacancies and softer asking-rent achievability than the comps imply.
- What's the recent tenant-quality profile in this submarket — average credit score on applications, eviction rate, late-payment / NSF rate, and stable-employment percentage? A property-management company in the area should have these aggregated.
- How much new for-sale + rental construction is in the pipeline within 1–3 miles? Heavy new supply typically softens prices + rents 12–24 months out; constrained supply supports both.
Investment metrics
- 1% rule
- 1.15% ✓
- Cap rate
- 7.51%
- Cash-on-cash
- 4.36%
- DSCR
- 1.19
- GRM
- 7.3
CMA / ARV
- ARV (median comp)
- $212,691
- List price
- $169,999
- Delta
- -20.07%
- Verdict
- UNDERPRICED
- Comps
- 20 within 1.0 mi
Show comp detail 12 sales within ~0.75 mi
| Address | Dist | Beds/Ba | Sqft | Sold | Price | $/sf | Match |
|---|---|---|---|---|---|---|---|
| 2435 Lindale Ln | 0.01mi | 3/2.0 (-1) | 1,176 (0%) | 13mo | $214,900 | $183 | 80 |
| 1505 Greenbrier Dr | 0.29mi | 4/3.0 | 1,176 (0%) | 9mo | $175,000 | $149 | 71 |
| 1222 Athens Dr | 0.20mi | 4/2.0 | 1,084 (-8%) | 5mo | $247,500 | $228 | 69 |
| 2001 Hickory Tree Rd | 0.62mi | 3/1.0 (-1) | 1,200 (+2%) | 3mo | $128,000 | $107 | 60 |
| 1433 Melanie Ln | 0.16mi | 3/1.5 (-1) | 1,030 (-12%) | 8mo | $215,000 | $209 | 58 |
| 1808 Del Oak Dr | 0.52mi | 4/2.0 | 1,222 (+4%) | 11mo | $179,995 | $147 | 56 |
| 2420 Lindale Ln | 0.06mi | 3/1.0 (-1) | 1,309 (+11%) | 22mo | $200,000 | $153 | 55 |
| 11708 Charlce Dr | 0.60mi | 3/1.0 (-1) | 1,172 (-0%) | 19mo | $125,000 | $107 | 50 |
| 1205 Rusk Dr | 0.28mi | 3/1.0 (-1) | 1,310 (+11%) | 17mo | $220,000 | $168 | 49 |
| 11807 Avery Ln | 0.55mi | 3/2.0 (-1) | 1,249 (+6%) | 12mo | $269,000 | $215 | 45 |
| 2017 Narobi Pl | 0.50mi | 4/3.0 | 1,300 (+10%) | 11mo | $267,900 | $206 | 42 |
| 3109 Forestdale Ln | 0.60mi | 3/2.0 (-1) | 1,044 (-11%) | 6mo | $215,000 | $206 | 40 |
Match score weights: distance 35% · size 25% · config 20% · recency 20%. Top-matched comps best support the ARV.
Projected returns pro-forma
-3.0% appreciation · 0.22% rent growth · sell at horizon
- IRR
- -13.1%
- Equity multiple
- 0.54×
- Total profit
- $-21,707
- Equity at exit
- $25,347
- IRR
- -9.9%
- Equity multiple
- 0.48×
- Total profit
- $-24,747
- Equity at exit
- $14,698
Cash invested: $47,600 (down + closing). Projections, not guarantees.
Landlord ↔ Tenant lean methodology
- Overall (STATE)
- 87 Strongly Landlord-Friendly
- State Texas
- 87 Strongly Landlord-Friendly · R+5
- County
- — inherits STATE
- City
- — inherits STATE
ZIP-level market 75149
- Home prices YoY
- -27.4%
- Rents YoY
- 0.2%
- Active inventory
- 345
- Price-to-rent
- 7.3×
Monthly cashflow live
- Estimated rent
- $1,952 high interval (Pro) →
- Mortgage (P&I)
- −$891
- Tax from tax record
- −$407 /mo · $4,883/yr
- Insurance
- −$71
- HOA
- −$0
- Vacancy / Maint / Mgmt
- −$410
- Net cashflow
- $173
Break-even live
Sensitivity live
| Price | -10% $269 | -5% $221 | +0% $173 | +5% $125 | +10% $77 |
|---|---|---|---|---|---|
| Rent | -10% $19 | -5% $96 | +0% $173 | +5% $250 | +10% $327 |
| Rate | -1.0pp $258 | -0.5pp $216 | base $173 | +0.5pp $129 | +1.0pp $84 |
UW: 25.0% down · 7.5% · 30yr · 1.5% tax · 5.0% vac · 8.0% maint · 8.0% mgmt
Financing live
Cash to close
- Down payment
- $42,500
- Closing costs
- $5,100
- Reserves months
- —
- Total cash needed
- —
Loan-product check · same deal, 3 products live
Conventional
25% down · 7.5% · 30yr
- Down + closing
- —
- Monthly P&I
- —
- Monthly cashflow
- —
- DSCR
- —
- Eligible?
- —
Personal DTI + credit; lowest rate.
DSCR
20% down · 8.5% · 30yr
- Down + closing
- —
- Monthly P&I
- —
- Monthly cashflow
- —
- DSCR
- —
- Eligible?
- —
No personal income docs; deal must DSCR.
Hard money
10% down · 12.0% · 12mo
- Down + closing
- —
- Monthly P&I
- —
- Monthly cashflow
- —
- DSCR
- —
- Eligible?
- —
Short-term bridge; refi at stabilization.
Rent comps 13 comps
| Address | Beds | Baths | Sqft | Rent | $/sqft | DOM | Units | Dist |
|---|---|---|---|---|---|---|---|---|
| 2045 Avis Cir Mesquite, TX | 3.0 | 1.0 | 912 | $1,600 | $1.75 | 26d | 1 | 0.43mi |
| 2005 Mount Pleasant Dr Mesquite, TX | 3.0 | 1.0 | 939 | $1,545 | $1.65 | 9d | 1 | 0.49mi |
| 12805 Dove Field Ln Balch Springs, TX | 3.0 | 2.0 | 1456 | $1,935 | $1.33 | 0d | 1 | 0.93mi |
| 1602 Develon Dr Mesquite, TX | 3.0 | 2.0 | 1251 | $2,300 | $1.84 | 45d | 1 | 1.05mi |
| 12931 Parker Ct Balch Springs, TX | 3.0 | 2.0 | 1338 | $2,155 | $1.61 | 9d | 1 | 1.05mi |
| 1029 Kory Dr Mesquite, TX | 3.0 | 2.0 | 1463 | $1,950 | $1.33 | 45d | 1 | 1.14mi |
| 2812 Cottonwood Ln Balch Springs, TX | 3.0 | 2.0 | 1260 | $1,450 | $1.15 | 45d | 1 | 1.16mi |
| 2724 Windswept Ln Mesquite, TX | 3.0 | 2.0 | 1402 | $2,300 | $1.64 | 26d | 1 | 1.28mi |
| 3921 Ambassador Way Balch Springs, TX | 4.0 | 1.5 | 1460 | $1,595 | $1.09 | 45d | 1 | 1.36mi |
| 2255 W Bruton Rd Mesquite, TX | 1.0–3.0 | 1.0–2.0 | 957 | $1,819 | $1.90 | 45d | 12 | 1.42mi |
| 12411 Summer Hill Dr Balch Springs, TX | 3.0 | 2.0 | 1299 | $1,800 | $1.39 | 3d | 1 | 1.46mi |
| 12603 Summer Hill Dr Balch Springs, TX | 3.0 | 2.0 | 1311 | $1,800 | $1.37 | 3d | 1 | 1.47mi |
| 12603 Summer Hill Dr Balch Springs, TX | 3.0 | 2.0 | 1311 | $2,500 | $1.91 | 23d | 1 | 1.47mi |
Listing history 41 events
-
2026-06-21days on market $169,999 Active 107 DOM
-
2026-06-18days on market $169,999 Active 104 DOM
-
2026-06-17days on market $169,999 Active 103 DOM
-
2026-06-16days on market $169,999 Active 102 DOM
-
2026-06-15days on market $169,999 Active 101 DOM
-
2026-06-13days on market $169,999 Active 99 DOM
-
2026-06-13days on market $169,999 Active 98 DOM
-
2026-06-09days on market $169,999 Active 95 DOM
-
2026-06-08days on market $169,999 Active 94 DOM
-
2026-06-07days on market $169,999 Active 93 DOM
-
2026-06-04days on market $169,999 Active 90 DOM
-
2026-06-03days on market $169,999 Active 89 DOM
-
2026-06-02days on market $169,999 Active 88 DOM
-
2026-06-01days on market $169,999 Active 87 DOM
-
2026-05-31days on market $169,999 Active 86 DOM
-
2026-04-26price $169,999 446-char remark
Show marketing remark (446 chars)
Welcome to this 4-bedroom home offering great potential for buyers looking for an opportunity to add value. The property features a remodeled kitchen with updated cabinets, countertops, and appliances, along with recent improvements including a new roof, new HVAC system, and a new privacy fence. The home offers a functional layout with ample living space, making it ideal for those looking to renovate or customize a property to their needs.
-
2026-04-26price $170,000 446-char remark
Show marketing remark (446 chars)
Welcome to this 4-bedroom home offering great potential for buyers looking for an opportunity to add value. The property features a remodeled kitchen with updated cabinets, countertops, and appliances, along with recent improvements including a new roof, new HVAC system, and a new privacy fence. The home offers a functional layout with ample living space, making it ideal for those looking to renovate or customize a property to their needs.
-
2026-04-26price $165,000 446-char remark
Show marketing remark (446 chars)
Welcome to this 4-bedroom home offering great potential for buyers looking for an opportunity to add value. The property features a remodeled kitchen with updated cabinets, countertops, and appliances, along with recent improvements including a new roof, new HVAC system, and a new privacy fence. The home offers a functional layout with ample living space, making it ideal for those looking to renovate or customize a property to their needs.
-
2026-03-06$175,000 Active 446-char remark
Show marketing remark (446 chars)
Welcome to this 4-bedroom home offering great potential for buyers looking for an opportunity to add value. The property features a remodeled kitchen with updated cabinets, countertops, and appliances, along with recent improvements including a new roof, new HVAC system, and a new privacy fence. The home offers a functional layout with ample living space, making it ideal for those looking to renovate or customize a property to their needs.
-
2025-11-12price $205,000
-
2025-10-29price $219,999
-
2025-10-22price $220,000
-
2025-10-21price $224,000
-
2025-10-07$225,000 Active
-
2025-06-27historical
-
2025-06-18price $210,000
-
2025-05-20$239,990 Active
-
2016-04-23historical
-
2015-11-04price $94,900
-
2015-10-16$77,900 Active
-
2007-01-26soldstatus
-
2007-01-15soldstatus
-
2006-12-08historical
-
2006-07-10$65,000
-
2004-08-19soldstatus
-
2004-06-29historical
-
2004-04-23$69,900
-
2004-03-08historical
-
2003-10-09$61,500
-
2001-01-10soldstatus
-
2000-07-31soldstatus
ⓘ Source: listings_history table (triggers on properties + properties_extension) + one-shot
backfill from property_details.listing_events for pre-trigger history.
Tax reassessment forecast TX · Resets to sale price
- Current annual tax
- $4,883 · $407/mo
- Projected year-2 tax
- $4,883 · $407/mo
- Expected delta
- $0/yr ($0/mo · 0.0%)
ⓘ Screening estimate from a state-policy table — verify with the county assessor before closing.
Climate risk First Street
- Flood 1/10 Low FEMA zone X (unshaded) · 0% chance over 30 yrs
- Wildfire 1/10 Low
- Heat 7/10 Severe 7 d/yr ≥111°F today · 24 d/yr by 30 yrs out
- Wind 6/10 Major 27% chance of damaging wind over 30 yrs
- Air quality 2/10 Low 1 unhealthy d/yr today · 1 by 30 yrs out
Nearby sold comps map
Loading sold comps map…
Walkable amenities ~0.75 mi
Loading nearby amenities…
Taxation est. · year 1
- Rental income
- $23,423
- − Mortgage interest
- −$9,523
- − Property taxes
- −$4,883
- − Insurance
- −$850
- − Repairs & maintenance
- −$1,874
- − Management
- −$1,874
- − Depreciation
- −$4,945
- Taxable loss
- −$526
- Est. tax savings @ 24.0%
- +$126
- After-tax cash flow
- $2,199/yr
For passive investors: Depreciation is non-cash, so a rental often shows a tax loss while cash-flowing — sheltering income. Rental losses are passive: they offset passive income freely, and up to $25,000/yr can offset ordinary (W-2) income if you actively participate and your MAGI is under $100k (phasing out to $0 by $150k); unused losses carry forward. On sale, claimed depreciation is recaptured at up to 25%, and gains may owe capital-gains tax (a 1031 exchange can defer both). Figures are a year-1 estimate at your 24.0% rate — not tax advice; consult a CPA.
Schools (NCES district)
- District
- Mesquite ISD
- NCES district ID
- 4830390
- Math proficiency
- 35% ▼ -11.00%
- Reading proficiency
- 32% ▼ -7.00%
- Median HH income
- $49,372
- Composite
- 29.06/100
- National rank
- #6606
- State rank
- #536 of 826 in TX
Livability — Mesquite
- Score
- 70/100
- State rank
- #358
- US rank
- #7743
Category grades
Schools grade is shown separately in the Schools card above.
Census & demographics
- Census place
- Mesquite, TX
- County
- Dallas County · 2,612,404 people
- City population
- 150,788
- Metro
- Dallas-Fort Worth-Arlington, TX
- Population (ZIP)
- 58,262
- Household income
- $70,774
- Rent vs Own
- Severe rent burden
- 2266.0
Population outlook (Dallas County) Hauer SSP2
- Today (2025)
- 2,979,839 people
- By 2030
- 3,191,823 · +7.1%
- By 2040
- 3,619,611 · +21.5%
- By 2050
- 4,026,915 · +35.1%
- By 2075
- 4,957,073 · +66.4%
- By 2100
- 5,508,725 · +84.9%
Race, ethnicity, and origin ACS 2023
- Neighborhood character
- Diverse neighborhood (Simpson 0.65)
- Race & ethnicity
- Hispanic / Latino 49% White 25% Two or more races 21% Black 20% Asian 2% Native American 1%
- Hispanic origin (detail)
- Mexican 42% Cuban 1%
- Common ancestry
- Italian 1% Iranian 1% Serbian 1%
- Foreign-born
- 22% · Canada, Vietnam
- Languages at home
- 58% English-only · Spanish 39% Other Asian/Pacific 1% Vietnamese 1%
Political lean MEDSL · Dallas
- 2024 margin
- Strong D (+22.2) · D 60.2% · R 38.0% · Other 1.8%
- 2008→2024 swing
- +6.9pp toward D · 2008: 15.3pp · 2024: 22.2pp
- All cycles
- 2024: D+22.2 2020: D+31.6 2016: D+26.2 2012: D+15.4 2008: D+15.3
Not yet ingested
- Civics
- —
Market trends
- HPI YoY
- ▼ -130.12%
- Current HPI
- 345.6606
- Rent YoY
- ▲ 0.22%
- Metro
- Dallas-Fort Worth-Arlington, TX
- State GDP YoY
- ▲ 3.95%
- F500 in state
- 110
Industry mix (Fortune 500 HQ in TX)
| Industry | F500 HQs | Revenue |
|---|---|---|
| Energy | 16 | $1,198B |
|
||
| Technology | 5 | $198B |
|
||
| Engineering / Construction | 4 | $72B |
|
||
| Energy Services | 3 | $60B |
|
||
| Utilities | 3 | $41B |
|
||
| Healthcare | 2 | $330B |
|
||
Price history
+176.4% since first listed26 events — show timeline
- 2026-04-26 Price Changed $169,999 NTREIS
- 2026-04-26 Price Changed $170,000 NTREIS
- 2026-04-26 Price Changed $165,000 NTREIS
- 2026-03-06 Listed $175,000 NTREIS
- 2025-11-12 Price Changed $205,000 NTREIS
- 2025-10-29 Price Changed $219,999 NTREIS
- 2025-10-22 Price Changed $220,000 NTREIS
- 2025-10-21 Price Changed $224,000 NTREIS
- 2025-10-07 Listed $225,000 NTREIS
- 2025-06-27 Listing Removed — NTREIS
- 2025-06-18 Price Changed $210,000 NTREIS
- 2025-05-20 Listed $239,990 NTREIS
- 2016-04-23 Listing Removed — NTREIS
- 2015-11-04 Price Changed $94,900 NTREIS
- 2015-10-16 Listed $77,900 NTREIS
- 2007-01-26 Sold (MLS) — NTREIS
- 2007-01-15 Sold (Public Records) — Public Records
- 2006-12-08 Listing Removed — NTREIS
- 2006-07-10 Listed $65,000 NTREIS
- 2004-08-19 Sold (Public Records) — Public Records
- 2004-06-29 Listing Removed — NTREIS
- 2004-04-23 Listed $69,900 NTREIS
- 2004-03-08 Listing Removed — NTREIS
- 2003-10-09 Listed $61,500 NTREIS
- 2001-01-10 Sold (Public Records) — Public Records
- 2000-07-31 Sold (Public Records) — Public Records
Property tax history
+6.9%/yrLatest (2025): $4,883 · +1.1% YoY. Source: county tax records.
Cash-flow waterfall
monthlySold comps — $/sqft
last 12 mo · ≤1 miLoading sold comps…