20921 E Park View Ln · Cordes Lakes, AZ
Flood risk 1/10 · Minimal
- FEMA flood zone
- X (unshaded)
- Chance of flooding over 30 yrs
- 0.0%
- Est. flood insurance / yr
- $507 – $1,088
Fire risk 6/10 · Moderate
- Est. fire insurance / yr
- $610 – $1,132
Heat risk 6/10 · Moderate
- Hot days now (above 101°F)
- 7 days/yr
- Hot days in 30 yrs
- 17 days/yr
Wind risk 1/10 · Minimal
- Chance of severe wind over 30 yrs
- —
Air-quality risk 2/10 · Minimal
- Unhealthy air days now
- 1 days/yr
- Unhealthy air days in 30 yrs
- 1 days/yr
Risk factors via First Street. Map © Google.
Why this score? — see what drove the D grade
The composite is a weighted blend of 9 inputs, each scored 0–100. Each bar is that input's sub-score; the figure is the points it added to the 100-point composite (weight × sub-score).
- ARV discount +12.5/15.0
- Appreciation +10.0/10.0
- Cash flow +7.2/30.0
- Livability +3.0/5.0
- Rent growth +2.5/5.0
- Condition / age +2.5/5.0
- 1% rule +2.0/10.0
- Schools +2.0/10.0
- DSCR +1.3/10.0
$289,900
🖨 Deal sheet 📄 Offer letter ✓ Due diligence
Listing remarks
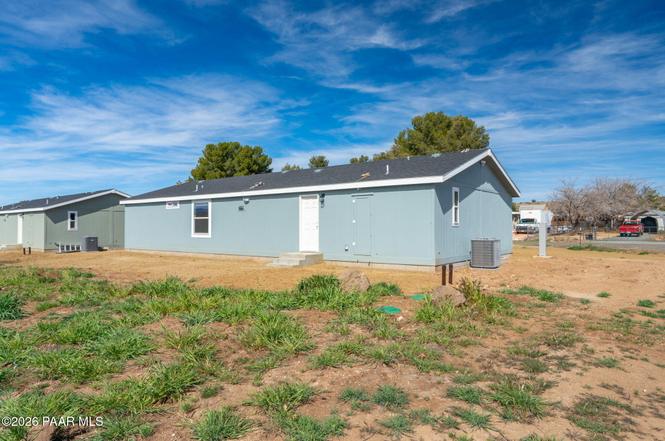
This beautiful brand-new 4-bedroom, 2-bath Cavco home has 1600 sqft of living space and is situated on a rare spacious 1/2 acre lot. In addition to being connected to public water, it also has a well for properties activities with a high water demand. Inside you'll find upgraded appliances, modern finishes, and a open-plan layout perfect for comfortable living. Take advantage of the builder's warranty included with this home, providing added peace of mind for buyers. This home is an ideal combination of convenience and comfort. Located on a quiet residential street , away from the hustle & bustle and the heat of The Valley; it also has easy access to I-17, putting it within commuting
Key facts
- 0.52 acre lot
- Built 2025
- Listed 132 days
Property features AI
Finance
- Other: Zoning: R1-10; Lot size approximately 0.52 acre; Subdivision: Cordes Lakes; Road maintenance by county; Road surface: asphalt/paved
- HOA & community: Not a senior community
Exterior
- Parking: RV garage/parking space(s) available
- Security: Smoke detector(s)
- Utilities: Public water; Electricity available; Electric water heater; Phone available; Underground utilities; Alternative wastewater (WWT - Alt System)
- Home design: Manufactured home (double wide); Single-story
- Construction: Frame construction; Composition roof; Piers and stem wall foundation
- Exterior features: Gravel driveway; Partial fencing; Juniper/Pinon vegetation; Level, rural lot with views; County road frontage
Interior
- Kitchen: Dishwasher; Electric cooktop; Electric range; Microwave; Refrigerator
- Flooring: Carpet; Laminate
- Bathrooms: 2 full bathrooms
- Heating & cooling: Electric heating; Central air conditioning
- Interior features: Kitchen island; Laminate counters; Walk-in closet(s); Washer/dryer connection; Family room; Laundry room
- Laundry & utility: Washer/dryer connection
Neighborhood map
What this means for you Summary
Snapshot
- This is a 4-bed/2.0-bath single-family listed at $290k.
Deal economics
- At list price, monthly cash flow is $-404 ($-5k/yr) — negative.
- To cash-flow at today's rent, offer at most $231k (20.2% below list).
- To meet the 1% rule (rent ≥ 1% of price), the offer needs to be $202k (30.2% below list).
- Recommended offer: $202k (30.2% below list) — sets the bar for 1% rule.
Location & tenants
- Location reads 60/100 on livability (#181 in AZ) — a middle-class / working-renter tenant base. Strengths: cost of living A+, housing A+, crime A-; Watch: schools F, amenities F, commute F.
- Mayer Unified School District (4473) (rural): math 23% / reading 26% proficiency, ranked #165 of 249 in AZ (top 66%) — low school quality limits family demand, transient renter base, plan for 1-2y turnover; 80% free/reduced lunch — lower-income household profile, screen leases tightly.
- Market conditions: 242 active listings in the ZIP; 2,062 units permitted in Yavapai County in 2024 (98 in 5+ unit buildings).
Forward outlook
- In year one you build about $31k of equity ($2k loan paydown + $29k appreciation (10.0% local appreciation)).
- Yavapai County population projected at +10% by 2050 — modest demand growth; plan on rents tracking national, not racing it.
- By year 2, paydown + projected appreciation supports a ~$50k cash-out refi (75% LTV) — recoverable capital for the next deal without selling this one.
Negotiation context
- It's been on market 132 days — a 12% lower offer ($255k) is reasonable based on typical stale-listing flexibility.
Risks & watch-outs
- Climate carrying-cost: major wildfire risk; extreme-heat days projected 7→17/yr by 2055 (HVAC capex compounding) — expect insurance premiums to compound above CPI over the hold.
Questions for the listing agent
- What do current leases actually rent for vs. the listed asking? Can we see a recent rent roll and the last 12 months of T-12 income?
- It's been on market 132 days. Have you received any prior offers? Is the seller open to a 30% concession, seller financing, or rate buy-down credit?
- Why hasn't it sold? Are there any deal-killer items the seller is aware of (foundation, flood, title, zoning, code violations)?
- Is there a deadline driving the sale (1031 exchange, divorce, estate, relocation)? That informs how much negotiation room exists.
- Schools are F-rated, which usually means shorter tenancies and higher turnover. Who's the typical renter profile here, and what's been the actual vacancy rate?
- The area grade is low — what's the realistic commute time and amenity access for the typical tenant pool here? Any planned neighborhood developments (good or bad) we should know about?
- What's the average days-on-market for RENTAL listings here right now (not sales)? A rising rental-DOM trend means longer vacancies and softer asking-rent achievability than the comps imply.
- What's the recent tenant-quality profile in this submarket — average credit score on applications, eviction rate, late-payment / NSF rate, and stable-employment percentage? A property-management company in the area should have these aggregated.
- How much new for-sale + rental construction is in the pipeline within 1–3 miles? Heavy new supply typically softens prices + rents 12–24 months out; constrained supply supports both.
Investment metrics
- 1% rule
- 0.70% ✗
- Cap rate
- 4.62%
- Cash-on-cash
- -5.97%
- DSCR
- 0.73
- GRM
- 11.9
CMA / ARV
- ARV (on-the-fly)
- $326,400
- Comps found
- 5
Show comp detail 5 sales within ~0.75 mi
| Address | Dist | Beds/Ba | Sqft | Sold | Price | $/sf | Match |
|---|---|---|---|---|---|---|---|
| 15318 S Cordes Lakes Dr | 0.55mi | 3/2.0 (-1) | 1,612 (+1%) | 3mo | $415,000 | $257 | 66 |
| 20415 E Sierra Dr | 0.53mi | 3/2.0 (-1) | 1,380 (-14%) | 3mo | $289,000 | $209 | 45 |
| 16082 S Rolling Ridge Dr | 0.68mi | 3/2.0 (-1) | 1,422 (-11%) | 8mo | $200,000 | $141 | 38 |
| 15869 S Chestnut Ln | 0.74mi | 3/2.0 (-1) | 1,456 (-9%) | 10mo | $279,900 | $192 | 36 |
| 20187 E Ocotillo Dr | 0.69mi | 3/2.0 (-1) | 1,834 (+15%) | 11mo | $375,000 | $204 | 29 |
Match score weights: distance 35% · size 25% · config 20% · recency 20%. Top-matched comps best support the ARV.
Projected returns pro-forma
10.0% appreciation · 3.0% rent growth · sell at horizon
- IRR
- 20.1%
- Equity multiple
- 2.63×
- Total profit
- $132,201
- Equity at exit
- $261,165
- IRR
- 18.3%
- Equity multiple
- 6.05×
- Total profit
- $409,595
- Equity at exit
- $563,212
Cash invested: $81,172 (down + closing). Projections, not guarantees.
Landlord ↔ Tenant lean methodology
- Overall (STATE)
- 87 Strongly Landlord-Friendly
- State Arizona
- 87 Strongly Landlord-Friendly · R+3
- County
- — inherits STATE
- City
- — inherits STATE
ZIP-level market 86333
- Home prices YoY
- 17.3%
- Active inventory
- 242
- Price-to-rent
- 11.9×
Monthly cashflow live
- Estimated rent
- $2,025 medium interval (Pro) →
- Mortgage (P&I)
- −$1,520
- Tax est. 1.5%
- −$362 /mo · $4,348/yr
- Insurance
- −$121
- HOA
- −$0
- Vacancy / Maint / Mgmt
- −$425
- Net cashflow
- $-404
Break-even live
UW: 25.0% down · 7.5% · 30yr · 1.5% tax · 5.0% vac · 8.0% maint · 8.0% mgmt
Financing live
Cash to close
- Down payment
- $72,475
- Closing costs
- $8,697
- Reserves months
- —
- Total cash needed
- —
Loan-product check · same deal, 3 products live
Conventional
25% down · 7.5% · 30yr
- Down + closing
- —
- Monthly P&I
- —
- Monthly cashflow
- —
- DSCR
- —
- Eligible?
- —
Personal DTI + credit; lowest rate.
DSCR
20% down · 8.5% · 30yr
- Down + closing
- —
- Monthly P&I
- —
- Monthly cashflow
- —
- DSCR
- —
- Eligible?
- —
No personal income docs; deal must DSCR.
Hard money
10% down · 12.0% · 12mo
- Down + closing
- —
- Monthly P&I
- —
- Monthly cashflow
- —
- DSCR
- —
- Eligible?
- —
Short-term bridge; refi at stabilization.
Listing history 22 events
-
2026-06-18price $289,900 Active 132 DOM
-
2026-06-18days on market $299,900 Active 132 DOM
-
2026-06-17days on market $299,900 Active 131 DOM
-
2026-06-16days on market $299,900 Active 130 DOM
-
2026-06-15days on market $299,900 Active 129 DOM
-
2026-06-14days on market $299,900 Active 127 DOM
-
2026-06-13days on market $299,900 Active 126 DOM
-
2026-06-10days on market $299,900 Active 124 DOM
-
2026-06-09days on market $299,900 Active 123 DOM
-
2026-06-08days on market $299,900 Active 122 DOM
-
2026-06-07days on market $299,900 Active 121 DOM
-
2026-06-03days on market $299,900 Active 117 DOM
-
2026-06-02days on market $299,900 Active 116 DOM
-
2026-06-01days on market $299,900 Active 115 DOM
-
2026-05-31days on market $299,900 Active 114 DOM
-
2026-05-30days on market $299,900 Active 113 DOM
-
2026-04-17price $299,900
-
2026-04-09price $309,900
-
2026-03-19price $319,900
-
2026-03-06price $344,500
-
2026-02-06$349,500 Active
-
2026-01-11historical $349,500
ⓘ Source: listings_history table (triggers on properties + properties_extension) + one-shot
backfill from property_details.listing_events for pre-trigger history.
Climate risk First Street
- Flood 1/10 Low FEMA zone X (unshaded) · 0% chance over 30 yrs
- Wildfire 6/10 Major
- Heat 6/10 Major 7 d/yr ≥101°F today · 17 d/yr by 30 yrs out
- Wind 1/10 Low
- Air quality 2/10 Low 1 unhealthy d/yr today · 1 by 30 yrs out
Nearby sold comps map
Loading sold comps map…
Walkable amenities ~0.75 mi
Loading nearby amenities…
Taxation est. · year 1
- Rental income
- $24,299
- − Mortgage interest
- −$16,239
- − Property taxes
- −$4,348
- − Insurance
- −$1,450
- − Repairs & maintenance
- −$1,944
- − Management
- −$1,944
- − Depreciation
- −$8,433
- Taxable loss
- −$10,059
- Est. tax savings @ 24.0%
- +$2,414
- After-tax cash flow
- $-2,431/yr
For passive investors: Depreciation is non-cash, so a rental often shows a tax loss while cash-flowing — sheltering income. Rental losses are passive: they offset passive income freely, and up to $25,000/yr can offset ordinary (W-2) income if you actively participate and your MAGI is under $100k (phasing out to $0 by $150k); unused losses carry forward. On sale, claimed depreciation is recaptured at up to 25%, and gains may owe capital-gains tax (a 1031 exchange can defer both). Figures are a year-1 estimate at your 24.0% rate — not tax advice; consult a CPA.
Schools (NCES district)
- District
- Mayer Unified School District (4473)
- NCES district ID
- 0404820
- Math proficiency
- 23% ▼ -11.00%
- Reading proficiency
- 26% ▼ -13.00%
- Median HH income
- $35,108
- Composite
- 20.22/100
- National rank
- #8627
- State rank
- #165 of 249 in AZ
Livability — Cordes Lakes
- Score
- 60/100
- State rank
- #181
- US rank
- #19144
Category grades
Schools grade is shown separately in the Schools card above.
Census & demographics
- Census place
- Cordes Lakes, AZ
- Population (ZIP)
- 6,425
Population outlook (Yavapai County) Hauer SSP2
- Today (2025)
- 241,389 people
- By 2030
- 249,523 · +3.4%
- By 2040
- 259,966 · +7.7%
- By 2050
- 264,736 · +9.7%
- By 2075
- 269,334 · +11.6%
- By 2100
- 256,505 · +6.3%
Race, ethnicity, and origin ACS 2023
- Neighborhood character
- Predominantly White (77%)
- Race & ethnicity
- White 77% Two or more races 15% Hispanic / Latino 14%
- Hispanic origin (detail)
- Mexican 11% Puerto Rican 1%
- Common ancestry
- Lithuanian 6% Iranian 3% Romanian 3%
- Foreign-born
- 5% · Canada
- Languages at home
- 93% English-only · Spanish 6% Russian/Polish/Slavic 1%
Political lean MEDSL · Yavapai
- 2024 margin
- Solid R (+33.9) · D 32.6% · R 66.5%
- 2008→2024 swing
- -9.5pp toward R · 2008: -24.4pp · 2024: -33.9pp
- All cycles
- 2024: R+33.9 2020: R+29.3 2016: R+31.4 2012: R+30.7 2008: R+24.4
Not yet ingested
- Civics
- —
Market trends
- HPI YoY
- ▲ 55.51%
- Current HPI
- 376.0374
- Rent YoY
- —
- Metro
- —
- State GDP YoY
- ▲ 4.54%
- F500 in state
- 20
Industry mix (Fortune 500 HQ in AZ)
| Industry | F500 HQs | Revenue |
|---|---|---|
| Technology | 2 | $13B |
|
||
| Mining / Metals | 1 | $23B |
|
||
| Environmental Services | 1 | $16B |
|
||
| Metals / Steel | 1 | $14B |
|
||
| Technology Distribution | 1 | $9B |
|
||
| Homebuilding | 1 | $8B |
|
||
Price history
-14.2% since first listed6 events — show timeline
- 2026-04-17 Price Changed $299,900 PAARMLS as Distributed by MLS Grid
- 2026-04-09 Price Changed $309,900 PAARMLS as Distributed by MLS Grid
- 2026-03-19 Price Changed $319,900 PAARMLS as Distributed by MLS Grid
- 2026-03-06 Price Changed $344,500 PAARMLS as Distributed by MLS Grid
- 2026-02-06 Listed $349,500 PAARMLS as Distributed by MLS Grid
- 2026-01-11 Coming Soon $349,500 PAARMLS as Distributed by MLS Grid
Cash-flow waterfall
monthlySold comps — $/sqft
last 12 mo · ≤1 miLoading sold comps…