 5-Plex
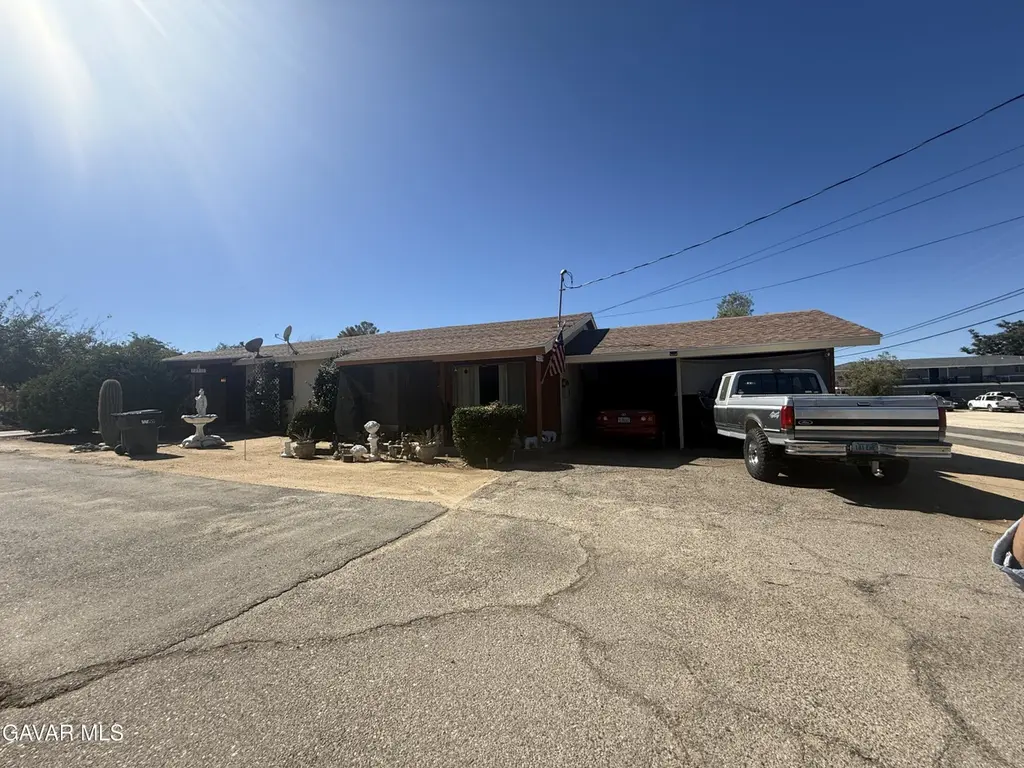
12529 Avenue V-10 · Sun Village, CA
Flood risk 1/10 · Minimal
- FEMA flood zone
- X (unshaded)
- Chance of flooding over 30 yrs
- 0.0%
- Est. flood insurance / yr
- $507 – $1,088
Fire risk 6/10 · Moderate
- Est. fire insurance / yr
- $659 – $1,223
Heat risk 6/10 · Moderate
- Hot days now (above 98°F)
- 3 days/yr
- Hot days in 30 yrs
- 6 days/yr
Wind risk 1/10 · Minimal
- Chance of severe wind over 30 yrs
- —
Air-quality risk 10/10 · Severe
- Unhealthy air days now
- 31 days/yr
- Unhealthy air days in 30 yrs
- 35 days/yr
Risk factors via First Street. Map © Google.
Why this score? — see what drove the B+ grade
The composite is a weighted blend of 9 inputs, each scored 0–100. Each bar is that input's sub-score; the figure is the points it added to the 100-point composite (weight × sub-score).
- Cash flow +30.0/30.0
- 1% rule +10.0/10.0
- DSCR +10.0/10.0
- Appreciation +10.0/10.0
- ARV discount +7.5/15.0
- Schools +2.7/10.0
- Rent growth +2.5/5.0
- Condition / age +2.5/5.0
- Livability +2.2/5.0
$650,000
🖨 Deal sheet 📄 Offer letter ✓ Due diligence
Multi-family units
County records classify this as Multi-Family (5+ Unit). Listing-text estimate: 5 units. confirmed
5+ unit building — per-unit beds/baths from public records are typically unavailable; the breakdown below (if shown) is an estimate from the listing text.
Listing remarks
Exceptional 5-Unit Investment Opportunity! Rare chance to own a versatile income-producing property in a growing area with easy highway access. The front home features a 2 bed / 1 bath with a private backyard, ideal for an owner-occupant. Live in the front and offset your mortgage while generating income from the back units or divide the lot, sell the home, and keep the units for passive income - buyer to verify. The rear includes two duplexes with a separate entrance, offering added privacy and strong rental appeal. This well-maintained property shows pride of ownership and presents excellent rental income potential with upside. Perfect for investors or buyers looking to build wealth throu
Key facts
- 0.82 acre lot
- 5 parking spots
- Built 1952
Property features AI
Finance
- Financial info: Five rental units with listed rents: $1,100; $1,000; $700; $700; $700; Price per unit listed at $130,000; Gross rent multiplier listed
Exterior
- Parking: Five parking spaces total; Four assigned parking spaces
- Utilities: Individual electric available for units; Master electric charges paid by tenants; Water and water heater charges paid by tenants; Gas utilities paid by landlord
- Home design: Frame construction; Asphalt/rock roof
- Construction: Frame construction; Asphalt/rock roof
- Exterior features: Approximately 10-year-old roof; Approximately 35,719 sq. ft. lot; Zoned LCR3
Interior
- Kitchen: No kitchen appliance details provided
- Bedrooms: Contains five units: one 2-bedroom unit and four 1-bedroom units; Unit 12529 is a 2-bedroom (single-story); Other units are 1-bedroom (single-story)
- Bathrooms: Each unit has one bathroom
- Heating & cooling: Central air / evaporator; Wall furnace
- Interior features: Income producing mult-unit property; Has alley access; Has fire sprinklers; Rent control in effect; Buyer to verify ADA compliance
- Laundry & utility: Individual electric meters available; Master electric paid by tenant; Water heater charges paid by tenant; Water (master) paid by tenant; Gas charges paid by landlord (individual and master)
Neighborhood map
What this means for you Summary
Snapshot
- This is a 5 × 6-bed/5.0-bath units multifamily listed at $650k.
Deal economics
- At list price, monthly cash flow is $9k ($110k/yr) — positive. Per door: $2k/mo.
- The deal already cash-flows at list — no discount required.
- Meets the 1% rule at list price ($16k rent vs $650k).
- Recommended offer: $630k (3.0% below list) — sets the bar for market timing.
- Cap rate 23.2% vs local median 3.2% in Sun Village — top-decile yield for the area; either an underpriced asset or a hidden risk that comps aren't pricing in. Stress-test before assuming the spread holds.
Location & tenants
- Location reads 44/100 on livability (#1,344 in CA) — a working-class tenant base; expect higher turnover. Strengths: housing A+; Watch: employment D+, schools F, crime F.
- Keppel Union Elementary (rural): math 23% / reading 33% proficiency, ranked #1,089 of 1,400 in CA (top 78%) — low school quality limits family demand, transient renter base, plan for 1-2y turnover; 74% free/reduced lunch — lower-income household profile, screen leases tightly.
- Market conditions: 97 active listings in the ZIP; 3 comparable units currently listed for rent nearby; rentals leasing fast (median 1d on market — plan ~1-2 weeks tenant-placement turnaround); 19,697 units permitted in Los Angeles County in 2024 (9,426 in 5+ unit buildings).
Forward outlook
- In year one you build about $69k of equity ($4k loan paydown + $65k appreciation (10.0% local appreciation)).
- Los Angeles County population projected at +9% by 2050 — modest demand growth; plan on rents tracking national, not racing it.
- At projected returns (10.0% appreciation + 3.0% rent growth), your $182k cash investment doubles in ~2 years — after that, you're playing with house money.
- By year 2, paydown + projected appreciation supports a ~$112k cash-out refi (75% LTV) — recoverable capital for the next deal without selling this one.
Negotiation context
- It's been on market 35 days — a 3% lower offer ($630k) is reasonable based on typical stale-listing flexibility.
- Current owner paid $75k; list at $650k implies a 767% gain — meaningful room to come down on a strong offer.
Risks & watch-outs
- Watch-outs: built in 1952 — expect roof / HVAC / electrical / plumbing capex.
- Climate carrying-cost: major wildfire risk; extreme-heat days projected 3→6/yr by 2055 (HVAC capex compounding) — expect insurance premiums to compound above CPI over the hold.
Questions for the listing agent
- It's been on market 35 days. Have you received any prior offers? Is the seller open to a 3% concession, seller financing, or rate buy-down credit?
- Can we see the unit-by-unit rent roll, current vacancy, and any below-market leases? What's the average tenancy length?
- What capital expenditures (roof, boiler, parking lot, exteriors) have been made in the last 5 years, and what's planned in the next 2?
- Built in 1952 — when were the roof, HVAC, electrical panel, plumbing, and water heater last replaced?
- Is there a deadline driving the sale (1031 exchange, divorce, estate, relocation)? That informs how much negotiation room exists.
- Schools are F-rated, which usually means shorter tenancies and higher turnover. Who's the typical renter profile here, and what's been the actual vacancy rate?
- Crime grade is F in this area — have there been break-ins, vandalism, or insurance claims at this property in the last 3 years? What carrier currently insures it and at what premium?
- What's the average days-on-market for RENTAL listings here right now (not sales)? A rising rental-DOM trend means longer vacancies and softer asking-rent achievability than the comps imply.
- What's the recent tenant-quality profile in this submarket — average credit score on applications, eviction rate, late-payment / NSF rate, and stable-employment percentage? A property-management company in the area should have these aggregated.
- How much new apartment / multifamily construction is in the pipeline within 1–3 miles? Heavy new supply (>2% of stock underway) typically softens rents 12–24 months out; light construction supports rent growth.
Investment metrics
- 1% rule
- 2.54% ✓
- Cap rate
- 23.16%
- Cash-on-cash
- 60.23%
- DSCR
- 3.68
- GRM
- 3.3
CMA / ARV
No comps found within radius.
Projected returns pro-forma
10.0% appreciation · 3.0% rent growth · sell at horizon
- IRR
- 72.4%
- Equity multiple
- 6.14×
- Total profit
- $935,676
- Equity at exit
- $585,571
- IRR
- 66.2%
- Equity multiple
- 13.62×
- Total profit
- $2,297,673
- Equity at exit
- $1,262,807
Cash invested: $182,000 (down + closing). Projections, not guarantees.
Landlord ↔ Tenant lean methodology
- Overall (STATE)
- 18 Strongly Tenant-Friendly
- State California
- 18 Strongly Tenant-Friendly · D+13
- County
- — inherits STATE
- City
- — inherits STATE
ZIP-level market 93553
- Home prices YoY
- 15.2%
- Active inventory
- 97
- Price-to-rent
- 16.4×
Monthly cashflow live
- Estimated rent
- $16,500 medium interval (Pro) →
- Mortgage (P&I)
- −$3,409
- Tax from tax record
- −$221 /mo · $2,652/yr
- Insurance
- −$271
- HOA
- −$0
- Vacancy / Maint / Mgmt
- −$3,465
- Net cashflow
- $9,135
Break-even live
5-unit breakdown (identical units grouped — click to expand)
| Units | Beds | Baths | Est. rent |
|---|---|---|---|
| 5× units | 6 | 5 | $16,500 |
| #1 | 6 | 5 | $3,300 |
| #2 | 6 | 5 | $3,300 |
| #3 | 6 | 5 | $3,300 |
| #4 | 6 | 5 | $3,300 |
| #5 | 6 | 5 | $3,300 |
| Total (5 units) | $16,500 | ||
UW: 25.0% down · 7.5% · 30yr · 1.5% tax · 5.0% vac · 8.0% maint · 8.0% mgmt
Financing live
Cash to close
- Down payment
- $162,500
- Closing costs
- $19,500
- Reserves months
- —
- Total cash needed
- —
Loan-product check · same deal, 3 products live
Conventional
25% down · 7.5% · 30yr
- Down + closing
- —
- Monthly P&I
- —
- Monthly cashflow
- —
- DSCR
- —
- Eligible?
- —
Personal DTI + credit; lowest rate.
DSCR
20% down · 8.5% · 30yr
- Down + closing
- —
- Monthly P&I
- —
- Monthly cashflow
- —
- DSCR
- —
- Eligible?
- —
No personal income docs; deal must DSCR.
Hard money
10% down · 12.0% · 12mo
- Down + closing
- —
- Monthly P&I
- —
- Monthly cashflow
- —
- DSCR
- —
- Eligible?
- —
Short-term bridge; refi at stabilization.
Rent comps 3 comps
| Address | Beds | Baths | Sqft | Rent | $/sqft | DOM | Units | Dist |
|---|---|---|---|---|---|---|---|---|
| 12509 Avenue V-10 Unit V-10 Pearblossom, CA | 2.0 | 1.0 | 736 | $2,200 | $2.99 | 1d | 1 | 0.02mi |
| 12307 Avenue V-10 Pearblossom, CA | 2.0 | 1.0 | 700 | $1,550 | $2.21 | 1d | 1 | 0.14mi |
| 12307 East Avenue V Pearblossom, CA | 2.0 | 1.0 | 700 | $1,550 | $2.21 | 1d | 1 | 0.99mi |
Listing history 11 events
-
2026-06-13days on market $650,000 Active 35 DOM
-
2026-06-09days on market $650,000 Active 32 DOM
-
2026-06-08days on market $650,000 Active 31 DOM
-
2026-06-07days on market $650,000 Active 30 DOM
-
2026-06-04days on market $650,000 Active 27 DOM
-
2026-06-03days on market $650,000 Active 26 DOM
-
2026-06-02days on market $650,000 Active 25 DOM
-
2026-06-01days on market $650,000 Active 24 DOM
-
2026-05-31days on market $650,000 Active 23 DOM
-
2026-04-30$650,000 Active
-
2001-12-28soldstatus $75,000
ⓘ Source: listings_history table (triggers on properties + properties_extension) + one-shot
backfill from property_details.listing_events for pre-trigger history.
Tax reassessment forecast CA · Resets to sale price
- Current annual tax
- $2,652 · $221/mo
- Projected year-2 tax
- $4,940 · $412/mo
- Expected delta
- +$2,288/yr (+$191/mo · 86.3%)
ⓘ Screening estimate from a state-policy table — verify with the county assessor before closing.
Climate risk First Street
- Flood 1/10 Low FEMA zone X (unshaded) · 0% chance over 30 yrs
- Wildfire 6/10 Major
- Heat 6/10 Major 3 d/yr ≥98°F today · 6 d/yr by 30 yrs out
- Wind 1/10 Low
- Air quality 10/10 Extreme 31 unhealthy d/yr today · 35 by 30 yrs out
Nearby sold comps map
Loading sold comps map…
Walkable amenities ~0.75 mi
Loading nearby amenities…
Taxation est. · year 1
- Rental income
- $198,000
- − Mortgage interest
- −$36,410
- − Property taxes
- −$2,652
- − Insurance
- −$3,250
- − Repairs & maintenance
- −$15,840
- − Management
- −$15,840
- − Depreciation
- −$18,909
- Taxable income
- $105,099
- Est. tax owed @ 24.0%
- −$25,224
- After-tax cash flow
- $84,391/yr
For passive investors: Depreciation is non-cash, so a rental often shows a tax loss while cash-flowing — sheltering income. Rental losses are passive: they offset passive income freely, and up to $25,000/yr can offset ordinary (W-2) income if you actively participate and your MAGI is under $100k (phasing out to $0 by $150k); unused losses carry forward. On sale, claimed depreciation is recaptured at up to 25%, and gains may owe capital-gains tax (a 1031 exchange can defer both). Figures are a year-1 estimate at your 24.0% rate — not tax advice; consult a CPA.
Schools (NCES district)
- District
- Keppel Union Elementary
- NCES district ID
- 0619440
- Math proficiency
- 23% ▼ -2.00%
- Reading proficiency
- 33% ▲ 1.00%
- Median HH income
- $48,099
- Composite
- 27.26/100
- National rank
- #12432
- State rank
- #1089 of 1400 in CA
Livability — Sun Village
- Score
- 44/100
- State rank
- #1344
- US rank
- #26817
Category grades
Schools grade is shown separately in the Schools card above.
Census & demographics
- Population (ZIP)
- 1,349
Population outlook (Los Angeles County) Hauer SSP2
- Today (2025)
- 10,940,515 people
- By 2030
- 11,256,481 · +2.9%
- By 2040
- 11,729,929 · +7.2%
- By 2050
- 11,948,407 · +9.2%
- By 2075
- 11,818,114 · +8.0%
- By 2100
- 10,842,928 · -0.9%
Race, ethnicity, and origin ACS 2023
- Neighborhood character
- Predominantly White (82%)
- Race & ethnicity
- White 82% Hispanic / Latino 16% Two or more races 4%
- Hispanic origin (detail)
- Mexican 14%
- Common ancestry
- Serbian 3% Lithuanian 3% Italian 1%
- Foreign-born
- 9% · Canada, China
- Languages at home
- 86% English-only · Spanish 11% Other Indo-European 3%
Political lean MEDSL · Los Angeles
- 2024 margin
- Solid D (+32.9) · D 64.8% · R 31.9% · Other 3.3%
- 2008→2024 swing
- -7.4pp toward R · 2008: 40.4pp · 2024: 32.9pp
- All cycles
- 2024: D+32.9 2020: D+44.2 2016: D+48.0 2012: D+40.0 2008: D+40.4
Not yet ingested
- Civics
- —
Market trends
- HPI YoY
- ▲ 50.60%
- Current HPI
- 383.9938
- Rent YoY
- —
- Metro
- —
- State GDP YoY
- ▲ 3.21%
- F500 in state
- 116
Industry mix (Fortune 500 HQ in CA)
| Industry | F500 HQs | Revenue |
|---|---|---|
| Technology | 27 | $1,492B |
|
||
| Financial Services | 3 | $174B |
|
||
| Retail | 3 | $44B |
|
||
| Insurance | 3 | $26B |
|
||
| Media / Entertainment | 2 | $115B |
|
||
| Pharmaceuticals / Biotech | 2 | $62B |
|
||
Price history
+766.7% since first listed2 events — show timeline
- 2026-04-30 Listed $650,000 AVMLS
- 2001-12-28 Sold (Public Records) $75,000 Public Records
Property tax history
+2.9%/yrLatest (2025): $2,652 · +16.8% YoY. Source: county tax records.
Cash-flow waterfall
monthlySold comps — $/sqft
last 12 mo · ≤1 miLoading sold comps…