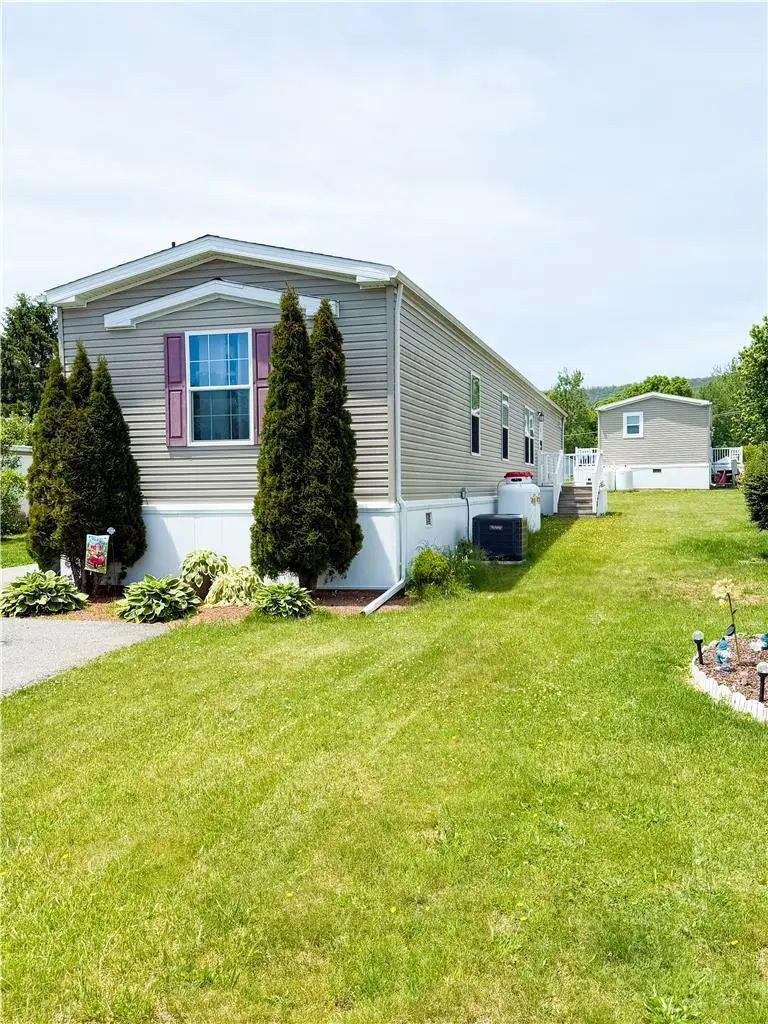
49 Ritzcraft Dr · Lehigh, PA
Flood risk 1/10 · Minimal
- FEMA flood zone
- X (unshaded)
- Chance of flooding over 30 yrs
- 0.0%
- Est. flood insurance / yr
- $473 – $860
Fire risk 3/10 · Minor
- Est. fire insurance / yr
- $511 – $949
Heat risk 4/10 · Minor
- Hot days now (above 97°F)
- 7 days/yr
- Hot days in 30 yrs
- 15 days/yr
Wind risk 4/10 · Minor
- Chance of severe wind over 30 yrs
- 15.0%
Air-quality risk 2/10 · Minimal
- Unhealthy air days now
- 1 days/yr
- Unhealthy air days in 30 yrs
- 2 days/yr
Risk factors via First Street. Map © Google.
Why this score? — see what drove the D+ grade
The composite is a weighted blend of 9 inputs, each scored 0–100. Each bar is that input's sub-score; the figure is the points it added to the 100-point composite (weight × sub-score).
- Cash flow +17.8/30.0
- 1% rule +10.0/10.0
- DSCR +5.6/10.0
- Schools +4.4/10.0
- Rent growth +2.5/5.0
- Livability +2.5/5.0
- Condition / age +2.5/5.0
- ARV discount +0.0/15.0
- Appreciation +0.0/10.0
$84,900
🖨 Deal sheet 📄 Offer letter ✓ Due diligence
Listing remarks
Welcome to 49 Ritzcraft Drive, located in the desirable Mountain View Community in Walnutport! This well-maintained 3-bedroom, 2-bath manufactured home offers comfortable one-floor living with an open and inviting floor plan designed for everyday convenience. Step inside to find a spacious living area that flows seamlessly into the dining space and kitchen, creating the perfect setting for entertaining family and friends. The primary suite features a private full bath and generous closet space, while two additional bedrooms provide flexibility for guests, a home office, or hobbies. Enjoy the ease of low-maintenance living with ample storage, dedicated laundry area, and off-street parking. W
Key facts
- Built 2018
- Listed 13 days
Property features AI
Finance
- HOA & community: Monthly association fee of $850
Exterior
- Parking: No garage
- Utilities: Public water; Public sewer
- Home design: Single-story; 1,216 above-grade finished area
- Construction: Vinyl siding; Wood siding; Asphalt and fiberglass roofing
- Exterior features: Leased propane tank; Mobile home on the property
Interior
- Kitchen: Dishwasher; Gas cooktop; Gas oven; Refrigerator; Electric water heater
- Bedrooms: Bedroom on the first level (14 x 16)
- Bathrooms: 2 full bathrooms
- Heating & cooling: Propane heating; Central air conditioning
- Interior features: Eat-in kitchen
- Laundry & utility: Electric water heater
Neighborhood map
What this means for you Summary
Snapshot
- This is a 3-bed/2.0-bath manufactured listed at $85k.
Deal economics
- At list price, monthly cash flow is $70 ($844/yr) — positive.
- The deal already cash-flows at list — no discount required.
- Meets the 1% rule at list price ($2k rent vs $85k).
Location & tenants
- Location reads: area grade D — affects rentability + tenant quality, not the cash-flow math above.
- Northampton Area SD (suburban): math 47% / reading 54% proficiency, ranked #153 of 539 in PA (top 28%) — acceptable for families but not a draw, mixed tenant base, ~2y average lease.
- Market conditions: 43 active listings in the ZIP; 567 units permitted in Northampton County in 2024 (151 in 5+ unit buildings).
Forward outlook
- Local home prices are declining (-3.0%/yr); year-one equity from $587 of loan paydown is wiped out by about $3k of value loss. Plan a longer hold.
Negotiation context
- Only 13 days on market — expect competitive offers; lowballing is unlikely to land.
- 3 sale attempts since 16y ago with the ask held roughly flat each time — persistent listings suggest the price (not the market) is what's stuck; bring a comps-based counter.
Risks & watch-outs
- Watch-outs: HOA is 44% of rent.
Questions for the listing agent
- What does the HOA fee cover, when was the last increase, and are there any pending special assessments or reserve-fund shortfalls?
- Is there a deadline driving the sale (1031 exchange, divorce, estate, relocation)? That informs how much negotiation room exists.
- The area grade is low — what's the realistic commute time and amenity access for the typical tenant pool here? Any planned neighborhood developments (good or bad) we should know about?
- What's the average days-on-market for RENTAL listings here right now (not sales)? A rising rental-DOM trend means longer vacancies and softer asking-rent achievability than the comps imply.
- What's the recent tenant-quality profile in this submarket — average credit score on applications, eviction rate, late-payment / NSF rate, and stable-employment percentage? A property-management company in the area should have these aggregated.
- How much new for-sale + rental construction is in the pipeline within 1–3 miles? Heavy new supply typically softens prices + rents 12–24 months out; constrained supply supports both.
Investment metrics
- 1% rule
- 2.27% ✓
- Cap rate
- 7.29%
- Cash-on-cash
- 3.55%
- DSCR
- 1.16
- GRM
- 3.7
CMA / ARV
- ARV (on-the-fly)
- $70,528
- Comps found
- 3
Show comp detail 3 sales within ~0.75 mi
| Address | Dist | Beds/Ba | Sqft | Sold | Price | $/sf | Match |
|---|---|---|---|---|---|---|---|
| 120 Duke St | 0.14mi | 3/2.0 | 1,216 (0%) | 9mo | $70,000 | $58 | 86 |
| 95 Nashua St | 0.13mi | 3/2.0 | 1,100 (-10%) | 6mo | $60,000 | $55 | 73 |
| 19 E Zimmer Dr | 0.14mi | 3/2.0 | 1,344 (+10%) | 10mo | $133,000 | $99 | 68 |
Match score weights: distance 35% · size 25% · config 20% · recency 20%. Top-matched comps best support the ARV.
Projected returns pro-forma
-3.0% appreciation · 3.0% rent growth · sell at horizon
- IRR
- -10.0%
- Equity multiple
- 0.63×
- Total profit
- $-8,717
- Equity at exit
- $12,659
- IRR
- 0.3%
- Equity multiple
- 1.02×
- Total profit
- $457
- Equity at exit
- $7,341
Cash invested: $23,772 (down + closing). Projections, not guarantees.
Landlord ↔ Tenant lean methodology
- Overall (STATE)
- 62 Landlord-Friendly
- State Pennsylvania
- 62 Landlord-Friendly · EVEN
- County
- — inherits STATE
- City
- — inherits STATE
ZIP-level market 18088
- Active inventory
- 43
- Price-to-rent
- 3.7×
Monthly cashflow live
- Estimated rent
- $1,928 medium interval (Pro) →
- Mortgage (P&I)
- −$445
- Tax from tax record
- −$122 /mo · $1,469/yr
- Insurance
- −$35
- HOA
- −$850
- Vacancy / Maint / Mgmt
- −$405
- Net cashflow
- $70
Break-even live
UW: 25.0% down · 7.5% · 30yr · 1.5% tax · 5.0% vac · 8.0% maint · 8.0% mgmt
Financing live
Cash to close
- Down payment
- $21,225
- Closing costs
- $2,547
- Reserves months
- —
- Total cash needed
- —
Loan-product check · same deal, 3 products live
Conventional
25% down · 7.5% · 30yr
- Down + closing
- —
- Monthly P&I
- —
- Monthly cashflow
- —
- DSCR
- —
- Eligible?
- —
Personal DTI + credit; lowest rate.
DSCR
20% down · 8.5% · 30yr
- Down + closing
- —
- Monthly P&I
- —
- Monthly cashflow
- —
- DSCR
- —
- Eligible?
- —
No personal income docs; deal must DSCR.
Hard money
10% down · 12.0% · 12mo
- Down + closing
- —
- Monthly P&I
- —
- Monthly cashflow
- —
- DSCR
- —
- Eligible?
- —
Short-term bridge; refi at stabilization.
HOA detail
- Monthly dues
- $850 · $10,200/yr
Listing history 10 events
-
2026-06-18days on market $84,900 Active 13 DOM
-
2026-06-17days on market $84,900 Active 12 DOM
-
2026-06-16days on market $84,900 Active 11 DOM
-
2026-06-15days on market $84,900 Active 10 DOM
-
2026-06-14pricedays on market $84,900 Active 8 DOM
-
2026-06-10days on market $87,900 Active 5 DOM
-
2026-06-09days on market $87,900 Active 4 DOM
-
2026-06-08days on market $87,900 Active 3 DOM
-
2026-06-07remarks 699-char remark
-
2026-06-07$87,900 Active 2 DOM
ⓘ Source: listings_history table (triggers on properties + properties_extension) + one-shot
backfill from property_details.listing_events for pre-trigger history.
Tax reassessment forecast PA · Partial reset (capped growth)
- Current annual tax
- $1,469 · $122/mo
- Projected year-2 tax
- $1,469 · $122/mo
- Expected delta
- $0/yr ($0/mo · 0.0%)
ⓘ Screening estimate from a state-policy table — verify with the county assessor before closing.
Climate risk First Street
- Flood 1/10 Low FEMA zone X (unshaded) · 0% chance over 30 yrs
- Wildfire 3/10 Moderate
- Heat 4/10 Moderate 7 d/yr ≥97°F today · 15 d/yr by 30 yrs out
- Wind 4/10 Moderate 15% chance of damaging wind over 30 yrs
- Air quality 2/10 Low 1 unhealthy d/yr today · 2 by 30 yrs out
Nearby sold comps map
Loading sold comps map…
Walkable amenities ~0.75 mi
Loading nearby amenities…
Taxation est. · year 1
- Rental income
- $23,139
- − Mortgage interest
- −$4,756
- − Property taxes
- −$1,469
- − Insurance
- −$424
- − Repairs & maintenance
- −$1,851
- − Management
- −$1,851
- − HOA
- −$10,200
- − Depreciation
- −$2,470
- Taxable income
- $118
- Est. tax owed @ 24.0%
- −$28
- After-tax cash flow
- $816/yr
For passive investors: Depreciation is non-cash, so a rental often shows a tax loss while cash-flowing — sheltering income. Rental losses are passive: they offset passive income freely, and up to $25,000/yr can offset ordinary (W-2) income if you actively participate and your MAGI is under $100k (phasing out to $0 by $150k); unused losses carry forward. On sale, claimed depreciation is recaptured at up to 25%, and gains may owe capital-gains tax (a 1031 exchange can defer both). Figures are a year-1 estimate at your 24.0% rate — not tax advice; consult a CPA.
Schools (NCES district)
- District
- Northampton Area SD
- NCES district ID
- 4217370
- Math proficiency
- 47% ▼ -1.00%
- Reading proficiency
- 54% ▼ -13.00%
- Median HH income
- $62,326
- Composite
- 44.35/100
- National rank
- #2822
- State rank
- #153 of 539 in PA
Livability — Lehigh
No livability data for this city. (Only ~50 U.S. cities are tracked.)
Census & demographics
- Population (ZIP)
- 8,162
Population outlook (Northampton County) Hauer SSP2
- Today (2025)
- 312,227 people
- By 2030
- 314,769 · +0.8%
- By 2040
- 316,914 · +1.5%
- By 2050
- 318,037 · +1.9%
- By 2075
- 334,003 · +7.0%
- By 2100
- 344,696 · +10.4%
Race, ethnicity, and origin ACS 2023
- Neighborhood character
- Predominantly White (89%)
- Race & ethnicity
- White 89% Two or more races 5% Hispanic / Latino 4% Black 2% Asian 1%
- Common ancestry
- Polish 7% Romanian 3% Danish 3%
- Foreign-born
- 2% · India, Canada
- Languages at home
- 96% English-only · Other Indo-European 2% Spanish 1%
Political lean MEDSL · Northampton
- 2024 margin
- Toss-up / Even · D 48.6% · R 50.4%
- 2008→2024 swing
- -14.1pp toward R · 2008: 12.3pp · 2024: -1.8pp
- All cycles
- 2024: R+1.8 2020: D+0.7 2016: R+3.8 2012: D+4.6 2008: D+12.3
Not yet ingested
- Civics
- —
Market trends
- HPI YoY
- ▼ -137.19%
- Current HPI
- 203.2109
- Rent YoY
- —
- Metro
- —
- State GDP YoY
- ▲ 1.68%
- F500 in state
- 34
Industry mix (Fortune 500 HQ in PA)
| Industry | F500 HQs | Revenue |
|---|---|---|
| Healthcare | 2 | $309B |
|
||
| Insurance | 2 | $27B |
|
||
| Telecommunications / Media | 1 | $124B |
|
||
| Industrial Distribution | 1 | $22B |
|
||
| Financial Services | 1 | $20B |
|
||
| Chemicals / Materials | 1 | $18B |
|
||
Price history
+204.2% since first listed5 events — show timeline
- 2026-06-05 Listed $87,900 GLVRMLS
- 2011-02-07 Listing Removed — GLVRMLS
- 2011-01-07 Listed $28,900 GLVRMLS
- 2010-12-31 Listing Removed — GLVRMLS
- 2010-06-17 Listed $28,900 GLVRMLS
Property tax history
+1.2%/yrLatest (2026): $1,469 · +4.4% YoY. Source: county tax records.
Cash-flow waterfall
monthlySold comps — $/sqft
last 12 mo · ≤1 miLoading sold comps…