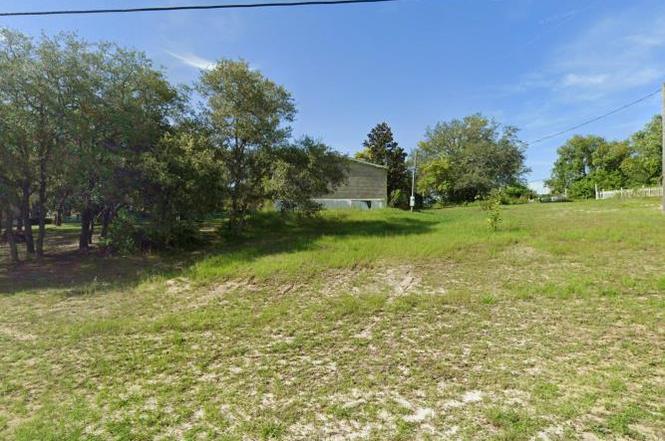
12122 Oneida Dr · Heritage Pines, FL
Flood risk 1/10 · Minimal
- FEMA flood zone
- X (unshaded)
- Chance of flooding over 30 yrs
- 0.0%
- Est. flood insurance / yr
- $507 – $1,088
Fire risk 4/10 · Minor
- Est. fire insurance / yr
- $947 – $1,759
Heat risk 10/10 · Severe
- Hot days now (above 110°F)
- 7 days/yr
- Hot days in 30 yrs
- 25 days/yr
Wind risk 10/10 · Severe
- Chance of severe wind over 30 yrs
- 99.0%
Air-quality risk 2/10 · Minimal
- Unhealthy air days now
- 1 days/yr
- Unhealthy air days in 30 yrs
- 3 days/yr
Risk factors via First Street. Map © Google.
Why this score? — see what drove the C grade
The composite is a weighted blend of 9 inputs, each scored 0–100. Each bar is that input's sub-score; the figure is the points it added to the 100-point composite (weight × sub-score).
- Cash flow +25.3/30.0
- DSCR +8.3/10.0
- ARV discount +7.5/15.0
- 1% rule +5.3/10.0
- Schools +4.3/10.0
- Livability +3.6/5.0
- Condition / age +2.5/5.0
- Rent growth +1.9/5.0
- Appreciation +0.0/10.0
$250,000
🖨 Deal sheet 📄 Offer letter ✓ Due diligence
Listing remarks
View by appointment only pets inside. Built In 2006. 2356 Sq Ft Of Living Area. needs some tender loving care needs new a/c but has a couple window units and 2 roll around air units for now, needs a shingles job , some kitchen cabinet and wallboard repair. The main floors are nice wood flooring planks and carpet in 2 bedrooms, a few rooms of flooring needs laid down but is here for bar area and master bedroom, kitchen and dining need flooring purchased, Back deck top needs replaced but has solid bottom large round pressure treated posts like around the big fire pit, it could use a few new wooden stairs replaced. Great for the Handy Man. There is a 14x30 shop/shed on property great for a bus
Key facts
- Wood flooring planks
- L shape property
- Boat parking
Tags
Neighborhood map
What this means for you Summary
Snapshot
- This is a 4-bed/2.0-bath manufactured listed at $250k.
Deal economics
- At list price, monthly cash flow is $564 ($7k/yr) — positive.
- The deal already cash-flows at list — no discount required.
- Meets the 1% rule at list price ($3k rent vs $250k).
- Recommended offer: $220k (12.0% below list) — sets the bar for market timing.
- Cap rate 9.0% vs local median 3.6% in Heritage Pines — top-decile yield for the area; either an underpriced asset or a hidden risk that comps aren't pricing in. Stress-test before assuming the spread holds.
Location & tenants
- Location reads 71/100 on livability (#399 in FL) — a middle-class / working-renter tenant base. Strengths: crime A+, cost of living A+, housing A+; Watch: employment C-, health & safety C-, amenities F.
- Pasco (suburban): math 50% / reading 52% proficiency, ranked #32 of 73 in FL (top 44%) — acceptable for families but not a draw, mixed tenant base, ~2y average lease.
- Market conditions: Rents soft (-2.3%/yr); 790 active listings in the ZIP; 1 comparable units currently listed for rent nearby; 6,765 units permitted in Pasco County in 2024 (1,250 in 5+ unit buildings).
- At $2,565/mo this rent would consume 60% of the median local household income ($51k/yr) (locally 946% of renters already pay >50% of income on rent) — very limited rent-growth headroom before tenants either downsize or default.
Forward outlook
- Local home prices are declining (-3.0%/yr); year-one equity from $2k of loan paydown is wiped out by about $8k of value loss. Plan a longer hold.
- Pasco County population projected at +29% by 2050 — long-run rental-demand tailwind backs the buy-and-hold thesis.
Negotiation context
- It's been on market 263 days — a 12% lower offer ($220k) is reasonable based on typical stale-listing flexibility.
- 5 sale attempts since 19y ago; this cycle's ask is 25% above the opening price — seller raised mid-cycle; expect resistance to lowballs.
- Current owner paid $119k; list at $250k implies a 110% gain — meaningful room to come down on a strong offer.
Risks & watch-outs
- Climate carrying-cost: severe wind risk, 99% chance of damaging wind over 30y; extreme-heat days projected 7→25/yr by 2055 (HVAC capex compounding) — expect insurance premiums to compound above CPI over the hold.
Questions for the listing agent
- It's been on market 263 days. Have you received any prior offers? Is the seller open to a 12% concession, seller financing, or rate buy-down credit?
- Why hasn't it sold? Are there any deal-killer items the seller is aware of (foundation, flood, title, zoning, code violations)?
- Is there a deadline driving the sale (1031 exchange, divorce, estate, relocation)? That informs how much negotiation room exists.
- What's the average days-on-market for RENTAL listings here right now (not sales)? A rising rental-DOM trend means longer vacancies and softer asking-rent achievability than the comps imply.
- What's the recent tenant-quality profile in this submarket — average credit score on applications, eviction rate, late-payment / NSF rate, and stable-employment percentage? A property-management company in the area should have these aggregated.
- How much new for-sale + rental construction is in the pipeline within 1–3 miles? Heavy new supply typically softens prices + rents 12–24 months out; constrained supply supports both.
Investment metrics
- 1% rule
- 1.03% ✓
- Cap rate
- 9.00%
- Cash-on-cash
- 9.67%
- DSCR
- 1.43
- GRM
- 8.1
CMA / ARV
No comps found within radius.
Projected returns pro-forma
-3.0% appreciation · 0.0% rent growth · sell at horizon
- IRR
- -4.8%
- Equity multiple
- 0.83×
- Total profit
- $-12,235
- Equity at exit
- $37,276
- IRR
- 1.4%
- Equity multiple
- 1.09×
- Total profit
- $6,042
- Equity at exit
- $21,615
Cash invested: $70,000 (down + closing). Projections, not guarantees.
Landlord ↔ Tenant lean methodology
- Overall (STATE)
- 87 Strongly Landlord-Friendly
- State Florida
- 87 Strongly Landlord-Friendly · R+3
- County
- — inherits STATE
- City
- — inherits STATE
ZIP-level market 34667
- Rents YoY
- -2.3%
- Active inventory
- 790
- Price-to-rent
- 8.1×
Monthly cashflow live
- Estimated rent
- $2,565 medium interval (Pro) →
- Mortgage (P&I)
- −$1,311
- Tax from tax record
- −$47 /mo · $562/yr
- Insurance
- −$104
- HOA
- −$0
- Vacancy / Maint / Mgmt
- −$539
- Net cashflow
- $564
Break-even live
UW: 25.0% down · 7.5% · 30yr · 1.5% tax · 5.0% vac · 8.0% maint · 8.0% mgmt
Financing live
Cash to close
- Down payment
- $62,500
- Closing costs
- $7,500
- Reserves months
- —
- Total cash needed
- —
Loan-product check · same deal, 3 products live
Conventional
25% down · 7.5% · 30yr
- Down + closing
- —
- Monthly P&I
- —
- Monthly cashflow
- —
- DSCR
- —
- Eligible?
- —
Personal DTI + credit; lowest rate.
DSCR
20% down · 8.5% · 30yr
- Down + closing
- —
- Monthly P&I
- —
- Monthly cashflow
- —
- DSCR
- —
- Eligible?
- —
No personal income docs; deal must DSCR.
Hard money
10% down · 12.0% · 12mo
- Down + closing
- —
- Monthly P&I
- —
- Monthly cashflow
- —
- DSCR
- —
- Eligible?
- —
Short-term bridge; refi at stabilization.
Rent comps 1 comps
| Address | Beds | Baths | Sqft | Rent | $/sqft | DOM | Units | Dist |
|---|---|---|---|---|---|---|---|---|
| 18720 Oak Way Dr Hudson, FL | 3.0 | 2.0 | 1839 | $2,700 | $1.47 | 4d | 1 | 0.45mi |
Listing history 22 events
-
2026-06-18days on market $250,000 Active 263 DOM
-
2026-06-17days on market $250,000 Active 262 DOM
-
2026-06-16days on market $250,000 Active 261 DOM
-
2026-06-15days on market $250,000 Active 260 DOM
-
2026-06-13days on market $250,000 Active 258 DOM
-
2026-06-09days on market $250,000 Active 254 DOM
-
2026-06-08days on market $250,000 Active 253 DOM
-
2026-06-07days on market $250,000 Active 252 DOM
-
2026-06-04days on market $250,000 Active 249 DOM
-
2026-06-03days on market $250,000 Active 248 DOM
-
2026-06-02days on market $250,000 Active 247 DOM
-
2026-06-01days on market $250,000 Active 246 DOM
-
2026-05-31days on market $250,000 Active 245 DOM
-
2026-01-09historical
-
2025-10-09$200,000 Active
-
2025-09-24$250,000 Active
-
2024-09-13status Pending
-
2024-09-11$160,000 Active
-
2008-07-31soldstatus $119,000
-
2008-07-25soldstatus $119,000
-
2008-05-14$119,900
-
2007-11-17$119,900
ⓘ Source: listings_history table (triggers on properties + properties_extension) + one-shot
backfill from property_details.listing_events for pre-trigger history.
Tax reassessment forecast FL · Resets to sale price
- Current annual tax
- $562 · $47/mo
- Projected year-2 tax
- $2,075 · $173/mo
- Expected delta
- +$1,513/yr (+$126/mo · 269.0%)
ⓘ Screening estimate from a state-policy table — verify with the county assessor before closing.
Climate risk First Street
- Flood 1/10 Low FEMA zone X (unshaded) · 0% chance over 30 yrs
- Wildfire 4/10 Moderate
- Heat 10/10 Extreme 7 d/yr ≥110°F today · 25 d/yr by 30 yrs out
- Wind 10/10 Extreme 99% chance of damaging wind over 30 yrs
- Air quality 2/10 Low 1 unhealthy d/yr today · 3 by 30 yrs out
Nearby sold comps map
Loading sold comps map…
Walkable amenities ~0.75 mi
Loading nearby amenities…
Taxation est. · year 1
- Rental income
- $30,774
- − Mortgage interest
- −$14,004
- − Property taxes
- −$562
- − Insurance
- −$1,250
- − Repairs & maintenance
- −$2,462
- − Management
- −$2,462
- − Depreciation
- −$7,273
- Taxable income
- $2,761
- Est. tax owed @ 24.0%
- −$663
- After-tax cash flow
- $6,104/yr
For passive investors: Depreciation is non-cash, so a rental often shows a tax loss while cash-flowing — sheltering income. Rental losses are passive: they offset passive income freely, and up to $25,000/yr can offset ordinary (W-2) income if you actively participate and your MAGI is under $100k (phasing out to $0 by $150k); unused losses carry forward. On sale, claimed depreciation is recaptured at up to 25%, and gains may owe capital-gains tax (a 1031 exchange can defer both). Figures are a year-1 estimate at your 24.0% rate — not tax advice; consult a CPA.
Schools (NCES district)
- District
- Pasco
- NCES district ID
- 1201530
- Math proficiency
- 50% ▼ -10.00%
- Reading proficiency
- 52% ▼ -5.00%
- Median HH income
- $45,039
- Composite
- 43.14/100
- National rank
- #3074
- State rank
- #32 of 73 in FL
Livability — Heritage Pines
- Score
- 71/100
- State rank
- #399
- US rank
- #7107
Category grades
Schools grade is shown separately in the Schools card above.
Census & demographics
- County
- Pasco County · 524,098 people
- Metro
- Tampa-St. Petersburg-Clearwater, FL
- Population (ZIP)
- 30,689
- Household income
- $51,280
- Rent vs Own
- Severe rent burden
- 946.0
Population outlook (Pasco County) Hauer SSP2
- Today (2025)
- 570,045 people
- By 2030
- 605,844 · +6.3%
- By 2040
- 674,806 · +18.4%
- By 2050
- 736,022 · +29.1%
- By 2075
- 862,900 · +51.4%
- By 2100
- 906,364 · +59.0%
Race, ethnicity, and origin ACS 2023
- Neighborhood character
- Predominantly White (86%)
- Race & ethnicity
- White 86% Hispanic / Latino 7% Two or more races 6% Black 2% Asian 2%
- Hispanic origin (detail)
- Mexican 1% Puerto Rican 2%
- Common ancestry
- Romanian 4% Lithuanian 3% Slovak 2%
- Foreign-born
- 7% · Canada, Jamaica, Vietnam
- Languages at home
- 91% English-only · Spanish 5% Other Indo-European 2% French/Haitian/Cajun 0%
Political lean MEDSL · Pasco
- 2024 margin
- Strong R (+25.2) · D 36.9% · R 62.1% · Other 1.0%
- 2008→2024 swing
- -21.6pp toward R · 2008: -3.6pp · 2024: -25.2pp
- All cycles
- 2024: R+25.2 2020: R+20.1 2016: R+21.6 2012: R+6.7 2008: R+3.6
Not yet ingested
- Civics
- —
Market trends
- HPI YoY
- ▼ -183.96%
- Current HPI
- 307.5552
- Rent YoY
- ▼ -2.26%
- Metro
- Tampa-St. Petersburg-Clearwater, FL
- State GDP YoY
- ▲ 3.28%
- F500 in state
- 36
Industry mix (Fortune 500 HQ in FL)
| Industry | F500 HQs | Revenue |
|---|---|---|
| Industrial Technology | 2 | $29B |
|
||
| Insurance | 2 | $17B |
|
||
| Retail | 1 | $60B |
|
||
| Technology Distribution | 1 | $58B |
|
||
| Homebuilding | 1 | $35B |
|
||
| Technology Manufacturing | 1 | $35B |
|
||
Price history
+66.8% since first listed9 events — show timeline
- 2026-01-09 Listing Removed — Stellar MLS as Distributed by MLS Grid
- 2025-10-09 Listed $200,000 Stellar MLS as Distributed by MLS Grid
- 2025-09-24 Listed $250,000 Fizber.com
- 2024-09-13 Pending — Stellar MLS as Distributed by MLS Grid
- 2024-09-11 Listed $160,000 Stellar MLS as Distributed by MLS Grid
- 2008-07-31 Sold (Public Records) $119,000 Public Records
- 2008-07-25 Sold (MLS) $119,000 Stellar MLS as Distributed by MLS Grid
- 2008-05-14 Listed $119,900 Stellar MLS as Distributed by MLS Grid
- 2007-11-17 Listed $119,900 Stellar MLS as Distributed by MLS Grid
Property tax history
+0.3%/yrLatest (2025): $562 · -21.4% YoY. Source: county tax records.
Cash-flow waterfall
monthlySold comps — $/sqft
last 12 mo · ≤1 miLoading sold comps…